Chapter 6 : The Process Cost Accounting System
Learning Objectives
After studying this chapter, you should be able to:
1. Describe the flow of products and their cost elements through continuous processing systems, and prepare the journal entries to record these events.
2. Explain equivalent units of production (EUP), and calculate EUP for each cost element in beginning and ending inventories and in the spoilage.
3. Describe the six steps for departmental cost accounting in a PCAS.
4. Demonstrate the differences in calculating product costs between FIFO and weighted-average methods.
5. Prepare a list of attributes needed in a relational database to prepare process cost reports in an REA environment.
Introduction
Process cost accounting systems (PCASs) are used in mass production environments where homogeneous products flow continuously through processes (departments), such as grinding, mixing, molding, and canning. Examples include beer, cement, flour, dairy products, and paint. As partially completed products move from process to process (department to department), their costs are accumulated within each process and then transferred with the products.
Job order cost accounting systems (JOCASs), on the other hand, are used in industries such as construction, printing, consulting, and some furniture manufacturing companies where each job or batch of products is relatively unique and easily identified. As jobs move through production, costs are accumulated within the job until it is completed.
As with the basic CAS (Chapter 4) and the JOCAS (Chapter 5), perpetual inventory systems with subsidiary ledgers for RMI, WIP, and FGI are generally used in a PCAS. In a JOCAS, direct materials, direct labor, and applied overhead costs are directly traced (journalized) to individual job order cost records. As direct materials are requisitioned for production, their costs move with them out of the RMI subsidiary ledger into the job's subsidiary ledger account in WIP. As jobs are completed, their costs move with them out of the factory (WIP subsidiary ledger account) into FGI. The job cost sheets also move with them, leaving the WIP subsidiary ledger system and becoming the FGI subsidiary ledger system.
The subsidiary ledger system in a PCAS does not accumulate WIP costs by job. Instead WIP subsidiary ledgers are created for each process or department. The FGI subsidiary ledger system is basically the same. Each different type of product (milk, cheese, cream, butter, and so forth) has its own FGI subsidiary ledger account.
Basically, in process costing, WIP costs are accumulated in a particular workcenter, cell, or department for an entire period, such as a month, then this total is divided by the number of units produced during the period. The basic formula for calculating the product's cost in a PCAS is:
Unit cost = Total department costs/Total units produced
Because each product is indistinguishable from any other product, each bears the same average cost as any other unit during the period.
The basic CAS presented in Chapter 4 is an example of a one-process manufacturing operation. Cost elements are journalized to a single WIP subsidiary account (Product Costs). In multiple-process manufacturing, a WIP subsidiary ledger account is required for each process. The output of process 1 becomes a direct material input into process 2; then the output of process 2 becomes one of the direct materials input into process 3, and so forth.
In a PCAS, instead of using job cost sheets, a department production cost report is used to provide a summary of the number of units moving through the department during the period along with their costs. The key differences between a JOCAS and PCAS are summarized in Exhibit 6-1.
|
JOCAS |
PCAS |
|
Uniquely identifiable jobs are worked on during each period, with each job normally requiring different levels of production resources. |
Identical products are produced on a continuous basis or for long periods of time. |
|
Costs are accumulated by individual jobs. |
Costs are accumulated by departments. |
|
The job cost sheet is the record controlling the accumulation of costs by jobs. |
The department production cost report is the key document showing the accumulation of costs by department. |
|
Unit costs are computed by job on the job cost sheet. |
Unit costs are calculated by department on the department production cost report. |
Understanding The Flow Of Units And Costs
LEARNING OBJECTIVE 1
Describe the flow of products and their cost elements through continuous processing systems, and prepare the journal entries to record these events.
Costs flow from one department to another as the units being manufactured move through the departments. The PCAS objective is to determine the departmental costs of products so that these costs can be combined to yield the total COGM. The processing departments can be configured in an unlimited number of ways as can the computer technology that supports them, the flow of products through them, and the flow of costs.
What Are The Different Processing And Cost Flows?
Normally most process production flows follow one of two basic configurations:
• Sequential
• Parallel
In addition to the flow of goods through these processes, modern plants also integrate computer technology to control processes, collect and process production cost data, and provide various performance measurement reports. The technology is linked together in a network, with computing resources distributed out to where workers and managers need them.
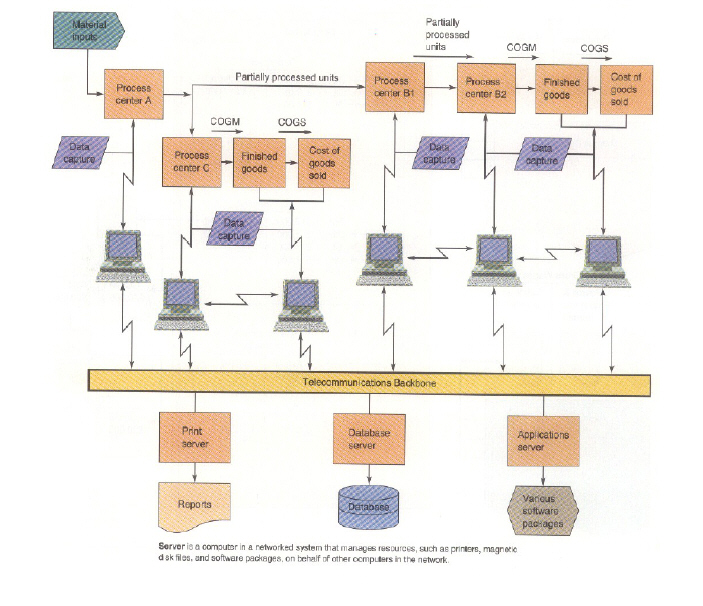
SEQUENTIAL PROCESSING. Sequential processing centers or departments and the supporting computer technology platform are illustrated in Exhibit 6-2
|
|
. Partially completed products flow from left to right, undergoing different kinds of processing in each processing center. Direct materials, direct labor, and applied overhead costs are traced to each center. Process center 2 receives the partially processed units from process center 1 together with the costs from process center 1. Process center 2 adds its own direct materials, direct labor (if materials and labor are added in process 2), and applied overhead costs. Process center 3 receives the further processed, but still incomplete, units and their costs from process center 2. Process center 3 then adds direct materials, direct labor, and applied overhead costs incurred in its process. The finished products and their total costs are finally transferred out of process center 3 to FGI. The costs of finished goods that are sold are then transferred to the COGS account. Meanwhile, the computer technology platform has collected and processed all the data generated by the total operation.
PARALLEL PROCESSING. In parallel processing, different products go through different processing centers or departments, depending on the nature of the product. Exhibit 6-3
|
, illustrates this processing configuration, which is used in companies such as oil refineries. An oil refinery, for example, inputs crude oil into process center A where its output is refined further into several end products. In Exhibit 6-3, process center A performs a “cracking” process in which the heavy hydrocarbons in the crude oil are broken up by heat into direct materials for process centers B 1 and B2, which produce gasoline. Process center C processes the materials from A into kerosene. Other joint products (not shown in the exhibit) derived from crude oil are naphtha, benzene, and paraffin. Costing joint products is illustrated in the last section of this chapter.
A Simple Example Of The Physical Flow Of Units In A Pcas
Exhibit 6-4
|
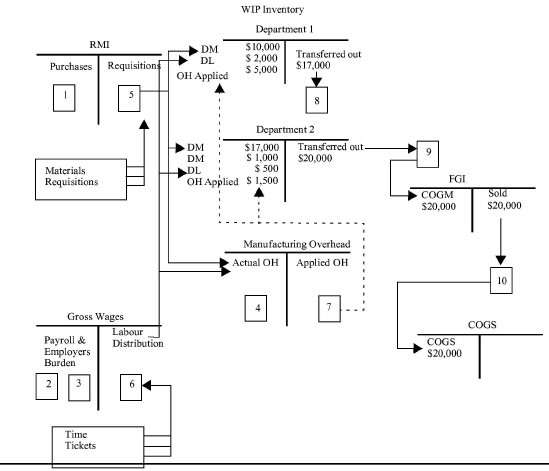
presents the physical flow of units, with their cost flows, for processing 10,000 gallons of milk at Model Dairies during May. Direct materials ($10,000), direct labor ($2,000), and applied overhead ($5,000) are used in department 1, where the 10,000 gallons of raw milk are pasteurized. In department 2, where packaging takes place, the pasteurized milk from process 1 is input as a direct material (transferred from process 1 at an average cost of $1.70 per gallon, or $17,000 in total for 10,000 gallons). Milk cartons are requisitioned from RMI ($1,000), and direct labor ($500) and applied overhead ($1,500) are incurred. These four costs are accumulated and divided by production volume to give an average cost per gallon of $2.00 ($20,000 divided by 10,000 gallons). The cartons of milk are transferred to cold storage (FGI at $20,000), awaiting delivery to customers (retail grocery stores). Then, when the milk is delivered, the COGS account is debited for $20,000 and FGI is credited for $20,000.
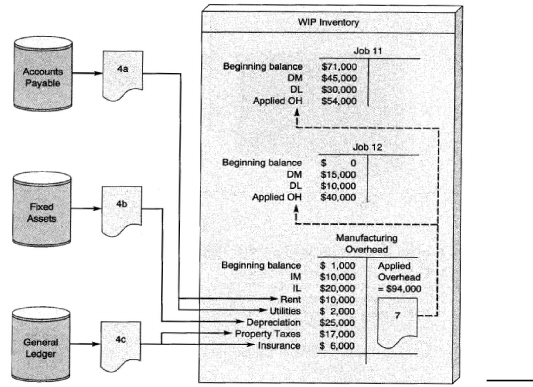
The PCAS journal entries that are different from those in a JOCAS are shown in Exhibit 6-5. Journal entries 1-4 recording the acquisition of cost elements (DM, DL, actual OH costs) are the same as in a basic CAS (reference Exhibit 4-4) and in a JOCAS (reference Exhibit 5-8).
When recording the usage of inputs, though, PCAS journal entries 5-7 debit WIP-Department instead of WIP-Job as in a JOCAS. A new journal entry is needed to transfer work-in-process between departments (new journal entry 8 in the PCAS). The journal entries to record the movement of completed products out of the factory and into finished goods inventory, and to record the sale of finished products, have been renumbered. Note that the subsidiary ledger systems for FGI and COGS are not set up by job number (because there are no jobs in a process costing system). Instead, they are set up by type of finished product (milk, butter, cream, cheese, and so on for Model Dairies).
|
Exhibit 6 -5 Model Dairies PCAS Journal Entries |
||
|
Partial Spreadsheet Program To Record Model Dairies Journal Entries For May 1995 |
||
|
Entries 1-4 are the same as in the prior chapters. |
dr's |
cr's |
|
5: REQUISITION OF RAW MATERIALS INTO THE FACTORY: WIP-Department 1 (DM) WIP-Department 2 (DM) WIP-Manufacturing Overhead (IM) Raw Materials Inventory
6: DISTRIBUTING GROSS WAGES TO PRODUCTS: WIP-Department 1 (DL) WIP-Department 2 (DL) WIP-Manufacturing Overhead (IL) Gross Wages
7: APPLYING OVERHEAD TO PRODUCTS: WIP-Department 1 (Applied OH) WIP-Department 2 (Applied OH) WIP-Manufacturing Overhead
8: WIP TRANSFER FROM DEPARTMENT 1 TO DEPARTMENT 2: WIP-Department 2 (DM from Dept. 1) WIP-Department 1
9: PRODUCTS COMPLETED: Finished Goods Inventory-Milk WIP-Department 2
10: PRODUCTS SOLD(INVENTORY RELIEF JOURNAL ENTRY ONLY): Cost of Goods Sold-Milk Finished Goods Inventory-Milk
|
$10,000 $1,000 ?
$2,000 $500 ?
$5,000 $1,500
$17,000
$20,000
$20,000 |
?
?
$6,500
$17,000
$20,000
$20,000 |
|
JOURNAL ENTRY RECORDING CONVENTIONS: |
||
|
1. Use a dash to separate a control account from a subsidiary account. 2. Use parentheses for a posting reference within a general ledger account. |
||
The important point to remember in designing the PCAS general ledger system is that WIP subsidiary accounts are departments rather than jobs. This is the only fundamental difference in assigning product costs between a PCAS and a JOCAS.
In most traditional process systems, though, each department has beginning and ending inventories of partially completed units on its assembly line for any month. This complicates the calculation of the costs of WIP transferred between departments for PCAS journal entry 8. An “equivalent units of production” calculation is needed, as explained in the next section. In JIT processes, where a cell produces the same sub-assembly over and over again (by kanban), there are no beginning and ending inventories within the cell, so the need to calculate equivalent units does not exist.
Determining Equivalent Units Of Production
LEARNING OBJECTIVE 2
Explain equivalent units of production (EUP), and calculate EUP for each cost element in the beginning and ending inventories and in the spoilage. (This learning objective will be continued on page 232.)
In the Model Dairies' example, all 10,000 gallons of milk were started and completed during May. But this situation is usually rare. In most traditional process systems, four types of events happen in any accounting period (i.e., a month):
• Products are started in the previous period (beginning WIP) and completed in the current period.
• Products are started in the current period and completed in the period.
• Products are started in the current period but are not completed by the end of the period (ending WIP).
• Products are spoiled (rejected) or reworked during the period.
What Is The Equivalent Units Of Production Calculation And Why Is It Needed?
Indeed, when beginning and ending inventories and spoilage exist, a calculation known as equivalent units of production (EUP) must be performed to measure how much production (work) was really done during the period. EUP represents the amount of completed output that could have been produced if all the work performed during the period had been for units both started and completed. It is an adjustment for the partial effort in beginning and ending inventories and in spoilage. In other words, EUP is how many units that could have been started, fully processed, and completed with the amount of inputs (costs) used during the month. EUP is divided into the total costs to obtain the cost per equivalent unit produced. This changes the basic formula for calculating unit cost to:
Unit cost = Total department costs / EUP
Returning to the Model Dairies example, assume that 10,000 gallons of milk were started during May in department 1, but only 9,000 were completed. The last 1,000 units were only 60 percent complete at the end of the month (thus, there were 1,000 gallons in ending WIP for department 1 in May). It is important to recognize that the $17,000 incurred in the department resulted in more than 9,000 gallons worth of milk production. Thus, the unit cost of the 9,000 gallons completed and transferred to department 2 is not $1.89 per gallon ($17,000 divided by 9,000 transferred gallons). Using this unit cost will overstate the cost of the 9,000 gallons transferred to department 2 and will result in no cost being associated with the 1,000 partially processed gallons left over at the end of May in ending WIP inventory.
Work was done on the ending WIP, so cost should be associated with it by the PCAS. But, how much? Ending WIP contained 1,000 gallons 60 percent complete, which is equivalent to the amount of work needed to fully complete 600 gallons (1,000 units 60 percent complete is equivalent to 600 units 100 percent complete). The formula for EUP is:
EUP = Units x Percentage complete
In department 1 during May, Model Dairies could have made 600 gallons of completely processed milk (pasteurized and ready to transfer to department 2) with the amount of work done on the ending WIP. This amount is in addition to the 9,000 gallons completed and transferred. Thus, Model Dairies pasteurized 9,000 gallons completely plus 1,000 gallons only 60 percent, or equivalently, the company did enough work to have made 9,600 gallons of fully pasteurized (completed) milk.The $17,000 in input costs used (recorded in journal entries 5-7) was enough to produce 9,600 gallons from start to finish (i.e., “from scratch”). On average, then, it cost $1.77 (rounded) per gallon to pasteurize milk in department 1 during May ($17,000 divided by 9,600 EUP). The total department 1 cost of the 9,000 gallons transferred out should be $15,930 ($1.77 per gallon times 9,000 gallons).
Computing Equivalent Units Of Production
The preceding example just considered the EUP for ending WIP. The EUP calculation is needed for each subset (or group) of partially completed units in the department for the month:
• The partially completed products in beginning WIP
• The partially completed products in ending WIP
• The partially completed products that are rejected during the month (spoilage)
Additionally, the EUP calculation has to be performed for each cost element that is input into the process at a different time, or in different amounts, from the other inputs. To demonstrate, consider again Model Dairies' ending WIP of 1,000 gallons in department 1. Those gallons were 60 percent complete. In other words, they were 60 percent through the department 1 process. But since all the raw milk was added at the beginning of the process, these 1,000 gallons were really 100 percent complete with respect to the amount (and cost) of raw milk input. Further complicating the unit cost calculation, only one-half of the direct labor needed to fully process these gallons had been incurred up to this point. So, the 1,000 gallons were only 50 percent complete with respect to direct labor. Finally, assume that overhead costs are used up uniformly throughout the process. Then, if the ending WIP was 60 percent “down-the-line”, these 1,000 gallons were 60 percent complete with respect to overhead.
|
Exhibit 6 -6 Model Dairies Department 1 Unit Cost |
|||||
|
PCAS FOR MODEL DAIRIES SPREADSHEET PROGRAM TO CALCULATE DEPARTMENT 1'S COST PER EUP For May 1995 |
|
|
|||
|
DATA SECTION: |
|
|
|
|
|
|
|
Units |
DM Added |
DL Added |
Applied OH |
|
|
Beginning WIP Inventory Beginning WIP % Complete Beginning WIP Cost Units Started Costs Added Ending WIP Inventory Ending WIP % Complete Units Completed Output Loss Output Loss % Complete |
0
10,000 1,000
9,000 0
|
- - $0 - $10,000 - 100.00% - - - |
- - $0 - $2,000 - 50.00% - - - |
- - $0 - $5,000 - 60.00% - - - |
|
|
SOLUTION SECTION: |
|
|
|
|
|
|
MODEL DAIRIES DEPARTMENT 1 COST REPORT MAY 1995 |
|
|
|||
|
EUP: |
Units |
DM Added |
DL Added |
Applied OH |
Totals |
|
Units Completed |
9,000 |
9,000 |
9,000 |
9,000
|
|
|
Less Beginning WIP |
0 |
0 |
0 |
0 |
|
|
Add Ending WIP |
1,000 |
1,000 |
500 |
600 |
|
|
Add Output Loss |
0 |
0 |
0 |
0 |
|
|
UNITS STARTED |
10,000 |
|
|
|
|
|
EQUIVALENT UNITS |
|
10,000 |
9,500 |
9,600 |
|
|
COST PER EUP: |
|
|
|
|
|
|
Beginning WIP Cost |
|
$0 |
$0 |
$0 |
$0 |
|
Costs Added This Month |
|
10,000 |
2,000 |
5,000 |
17,000 |
|
COSTS INCURRED |
|
$10,000 |
$2,000 |
$5,000 |
$17,000 |
|
UNIT COSTS |
|
$1.00 |
$0.21 |
$0.52 |
$1.73 |
|
|
|
|
|
||
Because each cost element is input in differing amounts and at differing times, separate EUP and unit cost calculations have to be performed for each cost element. The management accountant for Model Dairies created a spreadsheet program to perform all these calculations and determine the cost to make a gallon of pasteurized milk in department 1 for May. Exhibit 6-6 shows the output from this program.
There was no beginning WIP or spoilage, so these can be ignored at this time. They will be addressed in the next section. In interpreting the program's output, each cost element should be considered separately. First, consider the direct materials column (DM Added) of the program's Solution Section:
In total, 10,000 gallons of raw milk were input into the process at a cost of $10,000. Of these, 9,000 gallons were fully processed (completed), plus there were another 1,000 gallons in ending WIP (1,000 gallons times 100 percent complete for the raw milk direct material). In total, EUP for raw milk equals 10,000 gallons. Dividing the $10,000 cost by 10,000 EUP results in a $1.00 per gallon average cost for raw milk.
Second, consider the direct labor column (DL Added):
Enough labor was used (and cost incurred) to process the 9,000 gallons that were completed, plus 500 EUP in the ending WIP (1,000 gallons times 50 percent complete for labor). The $2,000 incurred on labor was enough to equivalently produce 9,500 completely processed gallons, yielding a unit cost for direct labor of $0.21 per gallon (rounded).
Third, consider the overhead column (Applied OH):
Enough overhead was incurred to fully process the 9,000 gallons completed, plus another 600 EUP in ending WIP (1,000 gallons times 60 percent complete for overhead). The $5,000 in applied overhead was enough to equivalently produce 9,600 completely processed gallons, yielding a unit cost for overhead of $0.52 per gallon (rounded).
In total, then, the cost of fully processing a gallon of raw milk into pasteurized milk within department 1 during May was $1.73 (the sum of the three inputs' unit costs).
Note that this example included the ending WIP percentage complete for each cost element. If information is only available from the shop floor as to the stage of completion of beginning WIP, ending WIP, or spoilage, then the management accountant will have to figure out what percentage complete each input is at these stages. In other words, the management accountant must answer the question, “If the ending WIP is 60 percent processed, what percentage complete is each cost element at that stage of the process?” This is the second of the six steps involved in departmental cost accounting in a PCAS.
Steps In Preparing The Pcas Journal Entry 8 For Department Transfers
LEARNING OBJECTIVE 3
Describe the six steps for departmental cost accounting in a PCAS.
The best way to learn how to set up and perform the steps necessary in preparing journal entry 8 is to go through, in detail, steps 2 through 5 in the six-step approach to departmental cost accounting. This section will highlight all six steps. In the next section, steps 2 through 5 will be demonstrated.
The Six-step Approach To Departmental Cost Accounting
Step 1. Journalize the acquisition and use of the cost elements. As in any basic CAS, journal entries 1-7 must be prepared and posted to the appropriate subsidiary ledger accounts in RMI and WIP.
Step 2. Summarize the flow of cost elements and calculate the input’s percentage complete. Units must be identified, such as those started in this period and those still in process from the previous period. This determines the number of units “to account for.” Units are “accounted for” according to whether they are transferred to the next process (department) or to finished goods (if this is the last department in the factory), are still in process (ending WIP), or were spoiled. The total units “accounted for” must agree with the total units “to account for.” Then, the percentage complete of each cost element for the partially completed units must be determined.
Step 3. Compute equivalent units of production. EUP must be calculated for each cost element in each subset of units only partially processed during the month (i.e., beginning WIP, ending WIP, and spoilage). If all direct materials are at the same degree of completion, a single direct materials calculation can be made. If multiple direct materials are used and are placed into production at different points, EUP calculations will be needed for each direct material. For example, in making vegetable soup, a tomato stock may be introduced at the beginning of the process, vegetables added at the 30 percent stage of completion, and cans brought in for packaging at the end of the process.
Step 4. Compute unit production costs. Once costs are accumulated by the processing centers or departments, and the period's output is determined in terms of EUP, unit production costs are computed by dividing the department's costs by its output expressed in EUP.
Step 5. Calculate the costs of completed and transferred output, ending WIP, and spoilage. In this step, total production costs are assigned to units transferred out, ending WIP inventory, and spoiled units. Journal entry 8 is prepared to record the transfer of products to the next department (or to FGI if this is the last department). In a normal PCAS, journal entry 8 is prepared from a department production cost report.
Step 6. Prepare cost management reports analyzing whether department costs were within budget. A variety of management control reports can be prepared. In a normal PCAS, departmental costs can be compared against budgeted costs, similar to the job cost reports in Exhibits 5-15 and 5-22 in the previous chapter. In a standard PCAS, standard costs can be used to prepare detailed cost variance reports by department. These types of reports will be illustrated in Chapter 8.
Cost Flows Within A Department: Fifo Versus Weighted-average Methods
So far, two production flows between departments (processes) have been identified: sequential and parallel processing. The question is, “Which department (WIP subsidiary ledger account) is debited for the costs of WIP transferred out of department X?” The calculation of EUP or unit costs is the same for sequential and parallel processes.
A new question, which does affect the calculation of EUP and unit cost, now needs to be addressed: “How does production flow through a particular department?” Most PCASs are based on one of two types of product flows: first-in, first-out (FIFO) and weighted-average (WA). Differences occur only when beginning WIP exists.
Beginning WIP in a department means that some processing costs are “left over” from last month. Last month's ending WIP is this month's beginning WIP. With a FIFO flow, the first units worked on are the first units completed. Production flows through a department as if on an assembly line or a JIT. Product 1 is started, then product 2, then product 3, and so forth. Product 1 is finished first, followed by product 2, then 3, and so forth. This production flow allows the PCAS to separate last month's production effort, and costs, from this month's. Thus, with a first-in, first-out (FIFO) cost flow method, department production cost reports can be prepared that isolate last month's costs from this month's, promoting cost trend analyses from month to month.
Some production processes within a department do not work on one product after another. For example, in the oil refinery mentioned earlier, when crude oil is input into the cracking process, it is mixed up with crude oil already in the processing tank. The output from this process is a mixture of leftover crude input last month (beginning WIP) and new crude input this month. Because last month's and this month's “work” are commingled, so are the costs in the PCAS. The best the PCAS can do is to compute a weighted- (or moving) average unit cost across the two months. This means that with a weighted-average (WA) cost flow method, beginning WIP (and its costs) are averaged with work (and costs) done this month in calculating EUP and unit costs. Thus, the only difference between the FIFO and WA methods is whether beginning WIP is separately accounted for or averaged in with this month's work.
Product Costing For First-in, First-out (Fifo) Process Flows
LEARNING OBJECTIVE 2
Explain equivalent units of production (EUP), and calculate EUP for each cost element in the beginning and ending inventories and in the spoilage.
The Pretty Pots example on the next page demonstrates steps 2 through 5 using a FIFO process flow. The data for Pretty Pots' production of clay pottery during July are included in the example.
Step 2: Summarize The Flow Of Cost Elements And Calculate The Inputs' Percentage Complete
Panel (a) of Exhibit 6-7
|
is called an input usage flow diagram. This is a line chart that maps how and when inputs are added into a process or department. To calculate EUP, the management accountant needs to know how much of each input is in the product. Review the Model Dairies example at the beginning of the chapter. Ending WIP was 1,000 gallons, 100 percent complete for raw milk, 50 percent complete for direct labor, and 60 percent complete for overhead. To obtain these percentages, the management accountant needs to know the input usage flows; that is, how much of an input is added into the process and when. Roy Potter's line chart provides a simple map of these input usage flows for Pretty Pots Molding Department. Preparing the input usage flow diagram is step 2 of the six steps in process costing.
|
INSIGHTS & APPLICATIONS Pretty Pots Production Data for the Molding Department Pretty Pots uses two processes, Molding and Firing, to manufacture clay flowerpots. Each pot is processed through both departments. From the firing process, the clay flowerpots are transferred to finished goods. In the Molding Department, a raw clay mixture known as Mud-X is started at the beginning of the process and mixed with water for two hours. |
The smooth liquefied clay is injected into molds where excess moisture is vaporized. Once the clay has set, the molds are removed, and the pots inspected. Sometimes, the clay has too much or too little moisture, causing the pots to collapse or crack, resulting in spoilage. After the clay pots are cured, they are transferred to the Firing Department where they are subjected to extreme heat. After firing is completed, the pots are glazed and/or handpainted and then transferred to the finished goods warehouse.Roy Potter, the management accountant, obtained the following information from the PCAS about Molding Department production data for July: |
Reviewing the input usage flow diagram in Exhibit 6-7a, notice that all direct materials (Mud-X and water) are added at the beginning of processing. Thirty percent of the direct labor is added over the first one-fourth (25 percent) of the process. This is the mixing operation in Roy Potter's notes. One-half of the direct labor is used over just 10 percent of the process (the mold removal and inspection operation). The last 20 percent of the direct labor used in the department is required during the last 40 percent of processing (curing). Overhead is used up uniformly throughout the department's operations.
|
|
COSTS |
UNITS |
|
Beginning work-in-process: |
|
50 |
|
Direct materials |
$ 75 |
|
|
Direct labor |
27 |
|
|
Applied overhead |
60 |
|
|
Total beginning WIP cost |
$162 |
|
|
Units started during July |
|
150 |
|
Units completed and transferred to Firing during July |
|
145 |
|
Ending work-in-process |
|
30 |
|
Spoilage during July |
|
25 |
|
Input costs incurred during July: Direct materials (Mud-X) |
$150 |
|
|
Direct labor |
354 |
|
|
Applied overhead |
492 |
|
|
Total costs added to process |
$996 |
|
|
Realizing that he needed more information, Roy went to see the production manager to find out how the molding process worked. The production manager walked Roy through the department, showing him how pots are made. The process wasn't as simple as Roy expected, so, he took some notes: During the first 25 percent of the process, clay and water are mixed. They are put into a big drum at the beginning of processing. The mixing process uses 30 percent of the department's labor time.
During the next 25 percent of the process, injection and molding take place. No labor is involved in this operation. The next 10 percent of the process involves mold removal and inspection (MR&I). This is a labor-intensive operation, requiring 50 percent of the department's labor time. |
The last 40 percent of the process is curing. This operation uses 20 percent of the labor needed to make pots in the Molding Department.
Now Roy understood the process better. He had observed the various operations involved, how much of each cost element was used in each operation, and when it was input. He then went back to his office and drew a simple line chart of the Molding Department's process.This line chart is shown in Exhibit 6-7a. He took the line chart back to the production manager to verify its correctness. With the line chart, Roy now had a simple method to calculate the percentage complete of beginning and ending WIT and spoilage for each cost element. With the percentage complete information, he could then write a spreadsheet program to calculate EUP and provide a department production cost report. |
With his input usage flow diagram, Roy Potter can now calculate how much of each input is in the beginning and ending WIP, as well as the spoiled pots for any month. All he has to do for a given month is to draw two dashed vertical lines where beginning and ending inventories are, and add the number of pots for each to the bottom of the diagram. Roy did this from the PCAS information for July in panel (b) of Exhibit 6-7. At the beginning of the month (BI), there were 50 pots 40 percent complete (i.e., they were 40 percent of the way down the assembly line). At the end of the month (EI is ending WIP on the input usage flow diagram), there were 30 pots 80 percent complete. Spoilage is identified when the pots are 60 percent complete (QC stands for quality control inspection in the diagram); 25 pots were rejected during July.
HOW MUCH OF EACH COST ELEMENT (ITS PERCENTAGE COMPLETE) IS IN BEGINNING WIP? The beginning WIP percentage complete for each input can be determined by noting how much of the input is in a pot by the time it is 40 percent “down-the-line.” Since all direct materials are added at the beginning, 100 percent of Mud-X and water are already in each pot comprising the beginning WIP. No more Mud-X or water has to be added to finish these pots in July. All the direct materials were added in June. In other words, the beginning WIP is 100 percent complete with respect to direct materials.
How much of the direct labor is in the beginning WIP? The answer is 30 percent. This amount was input by the time the pots are 25 percent down-the-line, and no more labor is used between that time and the point where the beginning WIP is. So, the beginning WIP is 30 percent complete with respect to direct labor.
Since overhead is added uniformly throughout the process, if the pots are 40 percent down-the-line, 40 percent of the overhead required to complete them has already been added. The beginning WIP is 40 percent complete with respect to overhead.
Roy Potter constructed a spreadsheet program to calculate EUP given the number of pots and their percentage complete for each input. The program, shown in Exhibit 6-8,
|
Exhibit 6 -8 Molding Department's EUP at Pretty Pots |
||||
|
PCAS FOR PRETTY POTS SPREADSHEET PROGRAM TO CALCULATE MOLDING DEPARTMENT'S EUP For July 201x |
||||
|
DATA SECTION: |
|
|
|
|
|
|
Units |
DM Added |
DL Added |
Applied OH |
|
Beginning WIP Inventory |
50 |
|
|
|
|
Beginning WIP % Complete |
|
100.00% |
30.00% |
40.00% |
|
Beginning WIP Cost |
|
$75 |
$27 |
$60 |
|
Units Started |
150 |
|
|
|
|
Costs Added |
|
$150 |
$354 |
$492 |
|
Ending WIP Inventory |
30 |
|
|
|
|
Ending WIP % Complete |
|
100.00% |
90.00% |
80.00% |
|
Units Completed |
145 |
|
|
|
|
Output Loss |
25 |
|
|
|
|
Output Loss % Complete |
|
100.00% |
80.00% |
60.00% |
|
Cost Method |
1 |
(1 = FIFO, 2 = WA) |
|
|
|
SOLUTION SECTION: FIFO |
|
|
|
|
|
|
|
PRETTY POTS MOLDING DEPARTMENT COST REPORT JULY 201x |
||
|
EUP: |
Units |
DM Added |
DL Added |
Applied OH |
|
Units Completed |
145 |
145 |
145 |
145 |
|
Less Beginning WIP |
<50> |
<50> |
<15> |
<20> |
|
Add Ending WIP |
30 |
30 |
27 |
24 |
|
Add Output Loss |
25 |
25 |
20 |
15 |
|
UNITS STARTED |
150 |
|
|
|
|
EQUIVALENT UNITS |
|
150 |
177 |
164 |
|
|
|
|
||
is the same one used in the Model Dairies illustration (Exhibit 6-6). Roy uses the Data Section to input each month's information. The percentage complete information for each cost element in the beginning WIP pots is in the second line (row) of the Data Section (the “Beginning WIP % Complete” line). The Solution Section is the formal report, which is automatically updated each time new raw data are input into the Data Section.
HOW MUCH OF EACH COST ELEMENT (ITS PERCENTAGE COMPLETE) IS IN THE SPOILED POTS REJECTED AT QC? Many traditional production processes have quality control (QC) inspection points throughout the process. In JITs, quality control is the responsibility of each cell worker when performing each operation within the cell. Thus, rejects (spoilage) can occur at any stage of production. If pots are rejected at the end of a process, calculating the EUP for each cost element is simple. Because each rejected pot is complete by the time it reaches the end of the process, 100 percent of all inputs are already in the pot; that is, it is 100 percent complete with respect to all cost elements.
But what if a pot is rejected part way through a process, such as at the 60 percent stage of completion in the Molding Department? How much of each cost element is in one of these rejected pots? Roy Potter used his input usage flow diagram in Exhibit 6-7b to determine the percentage complete of each cost element. Since all direct materials are added at the beginning, spoilage (the rejected pots) is 100 percent complete with respect to direct materials.
By the time a pot gets 60 percent through the department, 80 percent of the direct labor needed to make a pot already has been used (added to it). Thirty percent was incurred by the time the pots were 25 percent processed. By the time these pots were 60 percent of the way through the department, another 50 percent of labor was added. In total, then, spoilage is 80 percent complete with respect to direct labor.
Since overhead is added uniformly throughout the process, if pots are rejected when they are 60 percent through the department, then spoilage is 60 percent complete with respect to overhead. In Exhibit 6-8's Data Section, Roy Potter entered these percentages in the line labelled “Output Loss % Complete.”
HOW MUCH OF EACH COST ELEMENT (ITS PERCENTAGE COMPLETE) IS IN ENDING WIP? The ending WIP is 80 percent complete with its processing in the Molding Department. Since all direct materials are added at the beginning, 100 percent of the direct materials are already in these pots. No more direct materials have to be added next month to finish them. Thus, they are 100 percent complete with respect to direct materials. If the ending WIP is 80 percent processed through the department, then these pots are 80 percent complete with respect to overhead because overhead is added uniformly throughout the process.
Calculating the direct labor percentage complete is harder, however. Looking at the input usage flow diagram in Exhibit 6-7b, it is easy to see that 80 percent of direct labor is added by the time the pots are 60 percent of the way through the department. But, how much is added between the 60 percent and 80 percent stages of completion? Assuming the last 20 percent of labor is added uniformly over the last 40 percent of processing in the department, the amount added between 60 and 80 percent can be calculated using simple linear interpolation.
First, the amount of labor added between the 60 and 80 percent stages of completion can be intuitively determined. This is one-half of the processing (curing) during which 20 percent of labor is used. One-half of 20 percent is 10 percent. Alternatively, 20 percent of labor is added over 40 percent of the department's processing. Therefore, one-half percent of labor is added for each percent of processing. If 20 percent more processing is done, then 10 percent more labor is used. Using linear interpolation to verify this intuition:
|
percent added = |
Distance from starting point of line segment to units |
x |
input added over line segment |
|
length of line segment |
since 60% to 80% = 20%,
10% = (20% / 40%) X 20%
The labor added to the pots in ending WIP is 90 percent of what is needed to fully make a pot. Eighty percent was added by the time processing reached QC, and another 10 percent of labor was added during the curing process. In total, then, the ending WIP is 90 percent complete with respect to direct labor. These percentages are in the Data Section line “Ending WIP % Complete” (Exhibit 6-8).
Before completing step 2, Roy Potter used the input usage flow diagram to verify that all pots have been accounted for. Since there were 50 pots in beginning WIP and 150 pots started in July, two hundred pots could have been completed. In accounting for these 200 pots, 145 were completed, 30 were in ending WIP, and 25 pots were spoiled (rejected at QC). This internal control check is formally shown in the spreadsheet's Solution Section “Units” column. The “Units Started” of 150 pots is a summation of that column. This result is visually compared to the Data Section entry for units started to make sure they agree. Step 2 is now finished. The rest of the PCAS calculations are relatively simple.
Step 3: Calculate Fifo Eup
EUP is calculated for each subset of pots (beginning and ending WIP, spoilage) for each input. If there are three subsets of pots and three cost elements, then nine EUP calculations need to be made. The EUP formula is:
EUP = Units X Percentage complete
In the Solution Section of the spreadsheet program in Exhibit 6-8, each of these nine EUP calculations can be verified by looking at the spreadsheet cells for the three middle columns (DM Added, DL Added, Applied OH) and the three rows for the partially completed pots (Less Beginning WIP, Add Ending WIP, Add Output Loss). Output loss refers to rejected pots (spoilage).
Why are the beginning WIP pots subtracted from the pots completed? Remember that FIFO accounts for last month's work and costs separately from this month's. Consider Mud-X (the DM Added column in the spreadsheet's Solution Section). Even though 145 pots were completed in July, were 145 pots' worth of Mud-X needed in July? No, 50 pots were leftover from June (the July beginning WIP). All the Mud-X needed to make these pots was added in June, and no more was needed in July. In other words, to complete 145 pots in July, given a fully completed beginning WIP with respect to direct materials, only 95 pots' worth of Mud-X had to be requisitioned in July. In addition to this 95 pots' worth of Mud-X needed to complete the 145 pots, another 30 pots in ending WIP and 25 rejects also were 100 percent complete with respect to direct materials. In total, enough direct materials were used in July to fully process 150 pots (145 - 50 = 95, 95 + 30 + 25 = 150 EUP for direct materials).
Before proceeding, the definition of EUP should be reviewed to see if it makes sense. This same logic should be verified with the other cost elements (the DL Added and Applied OH columns in the Solution Section of Exhibit 6-8).
Step 4: Calculate Cost Per Unit
This is really a cost per EUP. This calculation is added to the bottom of the spreadsheet program as shown in Exhibit 6-9In July1, $150 worth of direct materials were requisitioned into the Molding Department. This was enough to make 150 pots, so the cost of Mud-X per pot was $1 in July. Remember, FIFO only considers July's effort (work or resources used) and costs. That is why the beginning WIP EUP was subtracted from the completed pots in the EUP calculation, and why beginning WIP cost is not considered in the cost per unit calculation here. (The work, as measured in EUP, is for the same time period as the costs. Both are only for July.) To emphasize that Beginning WIP Cost should not be included in the Cost Per EUP, Roy entered “n/a” in the cells for the Beginning WIP Cost line.
Because each cost element is used up in a different way throughout the Molding Department, separate EUP and cost per EUP calculations are necessary. Whenever two cost elements have identical usage flows, their EUP will be the same. Whenever cost elements have different usage flows, they must be accounted for individually.
|
Exhibit 6 -9 Molding Department's Unit Cost at Pretty Pots |
|||||
|
PCAS FOR PRETTY POTS SPREADSHEET PROGRAM TO CALCULATE MOLDING DEPARTMENT'S COST PER UNIT For July 1995 |
|
||||
|
DATA SECTION: |
|
|
|
|
|
|
|
Units |
DM Added |
DL Added |
Applied OH |
|
|
Beginning WIP Inventory Beginning WIP % Complete Beginning WIP Cost Units Started Costs Added Ending WIP Inventory Ending WIP % Complete Units Completed Output Loss Output Loss % Complete Cost Method (1 = FIFO, 2 = WA) |
50
150
30
145 25
1 |
100.00% $75
$150
100.00%
100.00% |
30.00% $27
$354
90.00%
80.00% |
40.00% $60
$492
80.00%
60.00% |
|
|
SOLUTION SECTION: FIFO |
|
|
|
||
|
|
PRETTY POTS MOLDING DEPARTMENT COST REPORT JULY 1995 |
|
|||
|
EUP: |
Units |
DM Added |
DL Added |
Applied OH |
Totals |
|
Units Completed |
145 |
145 |
145 |
145 |
|
|
Less Beginning WIP |
<50> |
<50> |
<15> |
<20> |
|
|
Add Ending WIP |
30 |
30 |
27 |
24 |
|
|
Add Output Loss |
25 |
25 |
20 |
15 |
|
|
UNITS STARTED |
150 |
|
|
|
|
|
EQUIVALENT UNITS |
|
150 |
177 |
164 |
|
|
COST PER EUP: |
|
|
|
||
|
Beginning WIP Costs |
|
n/a |
n/a |
n/a |
n/a |
|
Costs Added This Month |
|
$150 |
$354 |
$492 |
$996 |
|
COSTS INCURRED |
|
$150 |
$354 |
$492 |
$996 |
|
UNIT COSTS |
|
$1.00 |
$2.00 |
$3.00 |
$6.00 |
|
|
|
|
|||
The good news is that the formula is always the same, only the numeric values change. This is why process costing is an ideal application for spreadsheet software. The EUP formula, for example, can be entered into one cell and then copied to all the other spreadsheet cells where other EUP calculations are to be performed. If separate data and report (solution) sections are properly created in the program, then each month's raw data can be input, and the program will update the results for that month. In other words, the modern management accountant needs to know how to create “template” programs that are reusable month after month. Creating such a program fox process costing was relatively simple for Roy Potter, the management accountant for Pretty Pots.
Step 5: Calculate The Costs Of Completed Output, Ending Wip, And Spoilage
Roy Potter calls the final section of his spreadsheet program “Cost Allocations.” It is added to the bottom of the program and is shown in Exhibit 6-10 Again, only one formula is needed for virtually all the cells in this section of the spreadsheet:
Total cost of an input item for a particular subset of units = EUP X Cost per unit
Remembering that EUP = Units X Percentage complete for a cost element leads to the conclusion that there is only one basic formula in process costing:
EUP = Units X Percentage complete for a cost element
This formula yields EUP. When calculating the total cost of an input item, the cost per unit value is attached to the formula:
Total cost of an input for particular units = Units x % complete for a cost element x Cost per unit
To verify this, consider the DM Added column in the Cost Allocations section for ending WIP. There are 30 pots in ending WIP, 100 percent complete with respect to direct materials, multiplied by the direct materials cost of $1 per pot. For the direct labor cost in the output loss (spoilage), there are 25 spoiled pots, 80 percent complete with respect to direct labor, multiplied by the direct labor cost of $2 per pot (total direct labor cost in spoilage is $40).
The Units Completed subsection needs further elaboration. FIFO accounts for each month's work and costs separately. The 145 completed pots involved 50 pots from beginning WIP (started but not finished last month) plus 95 pots started and completed this month. This is shown in the “Units” column. The 50 pots have a beginning WIP cost (costs incurred last month) of $75 for direct materials, $27 for direct labor, and $60 in applied overhead. These 50 pots needed some more inputs to finish them in July. How many?
Cost to complete beginning WIP units = Units x (1 %Complete last month) X Cost per unit
To illustrate, the direct materials costs to complete the beginning WIP is zero. The beginning WIP was 100 percent complete with respect to direct materials last month, so no more direct materials had to be added in July.
|
Direct materials costs to complete the beginning WIP units |
= 50 units X (1 - 100%) X $1.00 per unit |
|
= 50 units X (1 - 1.00) X $1.00 per unit |
|
|
|
= $0 |
For direct labor, these 50 pots were 30 percent complete last month (this month's beginning WIP percentage complete). Therefore, only 70 percent of the required labor to make a pot had to be added in July. The 50 pots times 70 percent labor needed in July times July's labor cost of $2.00 per pot equals $70.
|
Direct labor costs to complete the beginning WIP units |
= 50 units X (1 - 30%) X $2.00 per unit |
|
= 50 units X (1 - 0.30) X $2.00 per unit |
|
|
= $70 |
For applied overhead:
|
Applied overhead costs to complete the beginning WIP units |
= 50 units X (1 - 40%) X $3.00 per unit |
|
|
= 50 units X (1 - 0.40) X $3.00 per unit |
|
|
= $90 |
These costs are shown in the Costs to Complete line just below the Beginning WIP Costs line in the Units Completed subsection of Cost Allocations in Exhibit 6-10. In total, the beginning WIP had a cost from June of $162. Another $160 (in direct labor and overhead) was needed to finish them in July.
The 95 pots started and completed in July had 100 percent of each cost element added in July times the July cost per pot for each input item. This is the same basic formula used for the ending WIP and spoilage.
|
Costs for 95 pots started and completed in July: |
||
|
|
Direct materials: |
95 pots X 100% complete X $1.00 per pot = $ 95 |
|
|
Direct labor: |
95 pots X 100% complete X $2.00 per pot = $190 |
|
|
Applied overhead: |
95 pots X 100% complete X $3.00 per pot = $285 |
|
Costs for 30 pots in ending WIP inventory: |
|||
|
|
Direct materials: |
30 pots X 100% complete X $1.00 per pot = $30 |
|
|
|
Direct labor: |
30 pots X 90% complete X $2.00 per pot = $54 |
|
|
|
Applied overhead: |
30 pots X 80% complete X $3.00 per pot = $72 |
|
|
Costs for 25 pots rejected (spoiled): |
|||
|
|
Direct materials: |
25 pots X 100% complete X $1.00 per pot = $25 |
|
|
|
Direct labor: |
25 pots X 80% complete X $2.00 per pot = $40 |
|
|
|
Applied overhead: |
25 pots X 60% complete X $3.00 per pot = $45 |
|
|
|
|
|
|
Before making the journal entry to record the pots transferred from the Molding Department to the Firing Department, Roy Potter performed one more internal control check. Have all the costs in WIP-Molding Department been accounted for? The beginning WIP cost was $162, costs added in July were $996, which equals $1,158 to account for. The cost of the pots transferred to Firing was $892, the cost of ending WIP was $156, and the cost of the spoiled pots was $110. The costs accounted for sum to the same $1,158. Therefore, all costs have been accounted for, and Roy Potter is ready to make journal entry 8 to record the transfer of the 145 completed pots from Molding to Firing.
The costs calculated in the preceding example were based on a FIFO flow of pots through the Molding Department. If a WA flow is appropriate, the costs could be different. Consequently, before making journal entry 8, the differences between the FIFO cost per unit and the WA cost per unit should be discussed.
Product Costing For Weighted-average (Wa) Process Flows
LEARNING OBJECTIVE 4
Demonstrate the differences in calculating product costs between FIFO and weighted-average methods.
In a FIFO flow, last month's work and costs can be separated from this month's. Last month's effort (the beginning WIP) is backed out of the EUP calculation, and last month's (July's beginning WIP) cost is separately treated in the Cost Allocations section of the department's production cost report. In a WA flow, however, the units worked on last month cannot be separated from the units worked on this month. Because the units in beginning WIP and the units started this month are mixed together, their costs cannot be separately accounted for and, instead, must be averaged together. This is the only difference between FIFO and WA: in FIFO, the beginning WIP is separately accounted for, but in WA it is averaged in with this month's work and costs.
|
Exhibit 6 -10 Molding Department's FIFO Cost Report at Pretty Pots |
|||||
|
SOLUTION SECTION: FIFO |
|
|
|||
|
|
PRETTY POTS MOLDING DEPARTMENT COST REPORT JULY 1995 |
|
|||
|
EUP: |
Units |
DM Added |
DL Added |
Applied OH |
Totals |
|
Units Completed |
145 |
145 |
145 |
145 |
|
|
Less Beginning WIP |
<50> |
<50> |
<15> |
<20> |
|
|
Add Ending WIP |
30 |
30 |
27 |
24 |
|
|
Add Output Loss |
25 |
25 |
20 |
15 |
|
|
UNITS STARTED |
150 |
|
|
|
|
|
EQUIVALENT UNITS |
|
150 |
177 |
164 |
|
|
COST PER EUP: |
|
|
|
|
|
|
Beginning WIP Cost |
|
n/a |
n/a |
n/a |
n/a |
|
Costs Added This Month |
|
$150 |
$354 |
$492 |
$996 |
|
COSTS INCURRED |
|
$150 |
$354 |
$492 |
$996 |
|
UNIT COSTS |
|
$1.00 |
$2.00 |
$3.00 |
$6.00 |
|
COST ALLOCATIONS: |
|
|
|
|
|
|
UNITS COMPLETED: |
145 |
n/a |
n/a |
n/a |
n/a |
|
Beginning WIP Costs |
50 |
$75 |
$27 |
$60 |
$162 |
|
Costs To Complete Beg. WIP |
|
0 |
70 |
90 |
160 |
|
Started This Month |
95 |
95 |
190 |
285 |
570 |
|
COSTS TRANSFERRED OUT |
|
$170 |
$287 |
$435 |
$892 |
|
ENDING WIP INVENTORY |
30 |
$30 |
$54 |
$72 |
$156 |
|
OUTPUT LOSS |
25 |
$25 |
$40 |
$45 |
$110 |
|
COSTS ACCOUNTED FOR: |
|
$225 |
$381 |
$552 |
$1,158 |
|
|
|
|
|
|
|
To illustrate, study the WA department production cost report for the Molding Department in Exhibit 6-11. In the EUP section, the beginning WIP EUP is not subtracted from the completed units (line 2). EUP includes last month's work on the beginning WIP with this month's work on all the products. Thus, in the Cost Per EUP section, the beginning WIP costs are also included in the Costs Incurred. The work on all the units is combined, and the costs for all this work are combined. The resulting unit cost is an average cost of work done last month with work done this month.
|
Exhibit 6 -11 Molding Department's Weighted-Average Cost Report at Pretty Pots |
|||||
|
SOLUTION SECTION: WA |
|
|
|||
|
|
PRETTY POTS MOLDING DEPARTMENT COST REPORT JULY 1995 |
|
|||
|
|
|||||
|
EUP: |
Units |
DM Added |
DL Added |
Applied OH |
Totals |
|
Units Completed |
145 |
145 |
145 |
145 |
|
|
Less Beginning WIP |
<50> |
n/a |
n/a |
n/a |
|
|
Add Ending WIP |
30 |
30 |
27 |
24 |
|
|
Add Output Loss |
25 |
25 |
20 |
15 |
|
|
UNITS STARTED |
150 |
|
|
|
|
|
EQUIVALENT UNITS |
|
200 |
192 |
184 |
|
|
|
|
|
|
|
|
|
COST PER EUP: |
|
|
|
|
|
|
Beginning WIP Costs |
|
$75 |
$27 |
$60 |
$162 |
|
Costs Added This Month |
|
150 |
354 |
492 |
996 |
|
COSTS INCURRED |
|
$225 |
$381 |
$552 |
$1,158 |
|
UNIT COSTS |
|
$1.13 |
$1.98 |
$3.00 |
$6.11 |
|
COST ALLOCATIONS: |
|
|
|
|
|
|
UNITS COMPLETED: |
145 |
$163 |
$288 |
$435 |
$886 |
|
Beginning WIP Costs |
|
n/a |
n/a |
n/a |
n/a |
|
Costs To Complete Beg. WIP |
|
n/a |
n/a |
n/a |
n/a |
|
Started This Month |
|
n/a |
n/a |
n/a |
n/a |
|
COSTS TRANSFERRED OUT |
|
$163 |
$288 |
$435 |
$886 |
|
ENDING WIP INVENTORY |
30 |
$34 |
$54 |
$72 |
$159 |
|
OUTPUT LOSS |
25 |
$28 |
$40 |
$45 |
$113 |
|
COSTS ACCOUNTED FOR:, |
|
$225 |
$381 |
$552 |
$1,158 |
Under Cost Allocations, the same formula used with FIFO is used with WA to calculate the total costs:
Total Cost = Units X % complete for a cost element X Cost per unit
The total cost of the completed units is straightforward with WA. There is no distinction between, or separate accounting for, beginning WIP and the rest of the units completed. To illustrate, the total cost of direct materials in the completed pots during July was $163 (145 pots times 100 percent complete times $1.13 per pot for direct materials).2 The same is true for each cost in this section. The cost of pots transferred to the Firing Department for journal entry 8 is $886 (145 pots times $6.11 each).
Comparing The Department Production Cost Reports
The FIFO and WA calculations for EUP, cost per unit, and cost totals are compared in Exhibit 6-12.FIFO accounts for beginning WIP separately, whereas WA does not. This single difference between the two methods leads to the six lines being different in the FIFO and WA reports as described next:
• Less Beginning WIP (EUP section, line 2). With FIFO the beginning WIP EUP is subtracted so that it can be separately accounted for. With WA it is not backed out and, thus, is included in EUP totals.
|
|
Exhibit 6 -12 Comparing the FIFO and Weighted-Average Methods |
||||||||||
|
SOLUTION SECTION: FIFO |
|
|
|
|
|
WA |
|
|
|
|
|
|
|
|
PRETTY POTS |
|
|
PRETTY POTS |
|
|||||
|
|
|
MOLDING DEPARTMENT COST REPORT |
|
|
MOLDING DEPARTMENT COST REPORT |
|
|||||
|
|
|
|
JULY 1995 |
|
|
|
|
JULY 1995 |
|
|
|
|
EUP: |
Units |
DM Added |
DL Added |
Applied OH |
Totals |
Units |
DM Added |
DL Added |
Applied OH |
Totals |
|
|
Units Completed |
145 |
145 |
145 |
145 |
|
145 |
145 |
145 |
145 |
|
|
|
|
Less Beginning WIP |
<50> |
<50> |
<15> |
<20> |
|
<50> |
n/a |
n/a |
n/a |
|
|
Add Ending WIP |
30 |
30 |
27 |
24 |
|
30 |
30 |
27 |
24 |
|
|
|
Add Output Loss |
25 |
25 |
20 |
15 |
|
25 |
25 |
20 |
15 |
|
|
|
UNITS STARTED |
150 |
|
|
|
|
150 |
|
|
|
|
|
|
EQUIVALENT UNITS |
|
150 |
177 |
164 |
|
|
200 |
192 |
184 |
|
|
|
COST PER EUP: |
|
|
|
|
|
|
|
|
|
|
|
|
|
Beginning WIP Cost |
|
n/a |
n/a |
n/a |
n/a |
|
$75 |
$ 27 |
60 |
62 |
|
Costs Added This Month |
|
$150 |
$354 |
$492 |
$996 |
|
150 |
354 |
492 |
996 |
|
|
|
COSTS INCURRED |
|
$150 |
$354 |
$492 |
$996 |
|
$225 |
$381 |
$552 |
$1,158 |
|
UNIT COSTS |
|
$1.00 |
$2.00 |
$3.00 |
$6.00 |
|
$1.13 |
$1.98 |
$3.00 |
$6.11 |
|
|
COST ALLOCATIONS: |
|
|
|
|
|
|
|
|
|
|
|
|
|
UNITS COMPLETED: |
145 |
n/a |
n/a |
n/a |
n/a |
145 |
$163 |
$288 |
$435 |
$886 |
|
|
Beginning WIP Costs |
50 |
$75 |
$27 |
$60 |
$162 |
|
n/a |
n/a |
n/a |
n/a |
|
|
Costs To Complete Beg. WIP. |
|
0 |
70 |
90 |
160 |
|
n/a |
n/a |
n/a |
n/a |
|
|
Started This. Month |
95 |
95 |
190 |
285 |
570 |
|
n/a |
n/a |
n/a |
n1a |
|
|
|
|
|
|
|
|
|
|
|
|
|
|
|
COSTS TRANSFERRED OUT |
|
$170 |
$287 |
$435 |
$892 |
|
$163 |
$288 |
$435 |
$886 |
|
ENDING WIP INVENTORY |
30 |
$30 |
$54 |
$72 |
$156 |
30 |
$34 |
$54 |
$72 |
$159 |
|
|
OUTPUT LOSS |
25 |
$25 |
$40 |
$45 |
$110 |
25 |
$28 |
$40 |
$45 |
$113 |
|
|
|
COSTS ACCOUNTED FOR: |
|
$225 |
$381 |
$552 |
$1,158 |
|
$225 |
$381 |
$552 |
$1,158 |
• Beginning WIP Costs (Cost Per EUP section, line 1). Beginning WIP cost is separately accounted for with FIFO, but is included with this month's costs in WA.
• The four lines under Units Completed (Cost Allocations section, Costs Transferred Out). With FIFO the cost of the units completed has to be separated between last month's cost and this month's cost (to complete the beginning WIP and the units both started and completed). Since last month and this month are combined with WA, no separate accounting is needed.
When the department production cost report is prepared manually, WA involves fewer calculations and is easier. When the reports are prepared with spreadsheet software, though, both methods can be run from the same program. Furthermore, the program can be used again in subsequent months simply by inputting a new month's raw data in the Data Section. The six lines of differences noted above can be dealt with by using an “If-Then” statement. For example, in the EUP section, the beginning WIP line can read, “If FIFO, subtract the beginning WIP EUP, if not, then input n / a.” In this way, one program can be used with multiple departments, some with FIFO flows and some with WA flows.3
Comparing The Fifo And Wa Information
By separately accounting for this month's costs, FIFO allows across-month cost comparisons (trend analysis). Exhibit 6-12 can be used to demonstrate this. This month's unit cost ($6.00, FIFO) is less than the average cost over the last two months ($6.11, WA). Costs must have decreased from last month. But, by how much? Look at the beginning WIP cost for direct materials. The $75 cost was for 50 pots, which were 100 percent complete with respect to direct materials. Last month's direct materials cost per EUP must have been $1.50 per pot ($75 = 50 pots times 100 percent complete times $1.50 unit cost). This month the direct materials only cost $1.00 per pot.
A similar calculation shows that direct labor went up. Last month, it cost $1.80 per pot ($27 = 50 pots times 30 percent complete times $1.80 unit cost). Workers got a raise effective July 1st. Overhead cost did not change because it is applied using a POR that does not change from month to month.4
Spoilage Accounting And Journal Entry 8
Spoilage has to be accounted for within journal entry 8, when the cost of the 145 completed pots is transferred from the Molding Department to the Firing Department. In traditional PCASs, normal spoilage is allocated to all the good pots made. In this way, the costs of rejects can be averaged into the cost of the salable pots. This is the same logic used in a JOCAS. The question is, “How much spoilage cost should be included in the cost of the good pots transferred to Firing?”
As in a traditional JOCAS, abnormal and normal spoilage are accounted for differently in a traditional PCAS. Abnormal spoilage is credited out of the WIP-Molding Department subsidiary ledger account and debited to a loss account. Normal spoilage is averaged over all the pots made. In a traditional JOCAS, normal spoilage is budgeted for and included in the POR. This can also be done in the PCAS. Then the cost of normal spoilage will be debited to overhead. The calculation of normal and abnormal spoilage, and journal entry 8, is shown below as Method 1 in the section titled Preparing Journal Entry 8 for Transfers.
Normal spoilage can also just be allocated over the good pots each month rather than being included in the overhead budget and the POR. Conceptually, this is a better approach than Method 1 in that the POR allocates spoilage to good pots as well as to pots that will eventually be spoiled. This does not happen in Method 2, as illustrated following Method 1.
Calculating Normal And Abnormal Spoilage
Refer to the input usage flow diagram in Exhibit 6-7b. Fifty pots in beginning WIP went through inspection (QC is at the department's 60 percent stage of completion), along with all 150 of the pots started in July. In total, 200 pots were inspected in July.5 Assume management considers a 10 percent failure rate (reject or spoilage rate) of the pots inspected to be normal. The first 20 pots rejected in July are normal output loss (NOL), and any excess is abnormal output loss (AOL).
Total spoilage is allocated between normal and abnormal as follows:
Normal spoilage cost = (NOL units/ Total spoilage) X Output loss cost
and,
Abnormal spoilage cost = (AOL units / Total spoilage) X Output loss cost
Pretty Pots Molding Department's spoilage in July is calculated as follows (using FIFO):
Normal spoilage cost = (20 units / 25 units) x $110 = $88
Abnormal spoilage cost = (5 units / 25 units) x $110 = $22
Preparing Journal Entry 8 For Transfers
In a traditional PCAS, using Method 1, which charges normal spoilage to overhead, the journal entry to record spoilage and transferred pots is:
|
JOURNAL ENTRY 8: Transfers between Departments (Method 1: Normal Spoilage to Overhead) |
||
|
WIP-Firing Department (pots) |
$892 |
|
|
WIP-Manufacturing Overhead (Spoilage) |
$ 88 |
|
|
Loss from Abnormal Spoilage |
$ 22 |
|
|
WIP-Molding Department |
|
$1,002 |
Before the Method 2 journal entry is made, the normal spoilage has to be allocated between the ending WIP and the pots transferred, because it has to be spread over all the good units that passed inspection. Of the 200 pots inspected, 25 were rejected; consequently, 175 passed.
To ending WIP cost = (30 units / 175 units) X $88 = $15 (rounded)
To transferred pots = (145 units / 175 units) X $88 = $73 (rounded)
|
Journal entry 8: Transfers between Departments (Method 2: Normal Spoilage to Good Pots) |
||
|
WIP-Firing Department (pots) |
$965 |
|
|
Loss from Abnormal Spoilage |
$ 22 |
|
|
WIP-Molding Department |
|
$987 |
With either method, the management accountant should verify that all costs have been correctly accounted for:
|
|
Method 1 |
Method 2 |
|
Good pots finished |
$892 |
$892 |
|
+ NOL (method 2) |
0 |
73 |
|
Costs to Firing Department |
$ 892 |
$ 965 |
|
Ending WIP good pots |
$156 |
$156 |
|
+ NOL (method 2) |
0 |
15 |
|
Ending WIP total cost |
$ 156 |
$ 171 |
|
+ Overhead (NOL, method 1) |
$ 88 |
$ 0 |
|
+ AOL (to loss account) |
$ 22 |
$ 22 |
|
Total costs accounted for |
$1,158 |
$1,158 |
Journal Entry 8 For World-class Manufacturing
Proponents of WCM, JIT, and TQM believe all spoilage is a nonvalue-added cost that should be accounted for separately and should not be allocated to the good output. These management accountants journalize all spoilage to a cost variance, as can be done in a JOCAS:
|
JOURNAL ENTRY 8: Transfers between Departments (WCM: All Spoilage to Cost Variance) |
||
|
WIP-Firing Department (pots) |
$892 |
|
|
WIP-Molding Department Spoilage Cost Variance |
$110 |
|
|
WIP-Molding Department |
|
$1,002 |
This spoilage is then reported to management in a special report along with the other cost variances of the Molding Department in July.
Through the concept of continuous improvement, world-class manufacturers are striving to eliminate spoilage, but to help achieve this goal, they need a performance measurement system. A performance measurement system, among other things, measures the production process and lets managers and workers know how well they are progressing toward the goal of zero defects. In these manufacturing environments, the goal is to drive spoilage or rework to insignificant levels in the short run (while eliminating them entirely in the long run).
In the meantime, spoilage and rework are still a significant part of production in many manufacturing firms. Thus, the purpose of this discussion, and the corresponding discussion in the last chapter for JOCASs, has been to explain how to account for such costs of spoilage when they do occur. By accounting for and spotlighting these costs, the management accountant can make management aware of their magnitude. Thus, managers can, at the very least, use this information to start on the road to total quality management.
Joint And By-product Costing In A Pcas
This section discusses situations in which a process or department produces more than one type of product (output). Depending on the monetary significance of the products, they can be joint products, or one is the main product and the other a by-product.
Joint costs are those costs incurred in a single operation that yields two or more products or services simultaneously. Joint products are two or more products (or services) that:
• Have relatively significant sales values, and
• Are not separately identifiable as individual products until their split-off point
The split-off point is the production juncture where the joint products and by-products become individually identifiable. For example, in mining gold, the leaching process yields both gold and silver. If both have significant sales value, they are joint products.
By-products are incidental products of a joint process that:
• Have minor sales value as compared with the sales value of the major product or products, and
• Are not separately identifiable as individual products until their split-off point
By-products are often disposed of for small amounts of revenue or are recycled in the production process. Current market values for gold are around $400 per ounce, compared to around $4 per ounce for silver. Many mining companies therefore treat silver (and the other ores that are leached out of the mining process) as a by-product. At one time, silver was accounted for as a joint product--and may be again in the future.
Contrarily, many products once considered by-products now make significant contributions to the enterprise's profits and have been reclassified as joint products. For example, shavings and wood chips, once considered by-products of lumber mills, are now sold to paper mills as raw materials for making paper products.
Joint costs are incurred up to the split-off point. The following are examples of industries where joint costs are common:
• Meat packing
• Lumber
• Dairy
• Food processing
• Petroleum
• Chemical
Joint products receive some pro rata share of the department's joint production costs prior to split off, generally according to some arbitrary cost allocation formula. By-products are not assigned any of the prior joint costs. By-products are inventoried at their net realizable value, as is scrap held for sale in Chapter 5. By-products' net realizable values are deducted from the joint costs prior to allocating them between the joint products.
At the split-off point, several products emerge, and the management accountant has to allocate the costs incurred up to that time among the joint products. The arbitrary methods usually selected to allocate these joint costs are based on some physical measure or on the joint products' relative sales values at the split-off point. In practice, many variations of these allocation methods are used.
The Physical Measure Method
Under the physical measure method, the total production costs incurred in the joint process are allocated to the various joint products according to the ratios of their physical output measurement. Product output measurements include units, litres, pounds, tons, gallons, or square feet. The cost allocated under this method may bear no relation to the costs incurred or the revenue generated by the various products.
The Relative Sales Value Method
Under the relative sales value method, joint costs are allocated among the various joint products in proportion to their anticipated sales values; that is, the expected market prices of the products when they are sold. The relative sales value method is probably the most widely used method.
This method is based on the assumption that costs should be allocated on the basis of a product's ability to “bear” them. Thus, products with the largest sales value should absorb most of the costs. The sales value used in this method is often the value at the split-off point. In situations where products are sold without additional processing, the relative sales value is the market price of each product times the quantity produced.
When products can be processed further into a refined or new product, but a market exists for them as they are, the sales value used for joint cost allocation purposes is the amount that could have been received if the products had been sold before being processed further. When joint products that have no market at the split-off point are processed further, a relative sales value must be assigned at the split-off point. The most widely used method in this situation is to estimate the sales value of the finished product and reduce it by the production costs incurred to complete the product after the split-off point (its net realizable value).
The New Horizons example on the following page shows how the physical measure and relative sales value methods are used. New Horizons manufactures two chemicals, both of which are sold at the split-off point.
ALLOCATING JOINT COSTS BY THE PHYSICAL MEASURE METHOD. In this case, a pound is the physical measurement unit. Thus, 40 percent of the joint costs would be allocated to Xyclog, because the 4,000 pounds of Xyclog obtained is 40 percent of the total number of usable pounds resulting from the process. The proportion of joint costs allocated to Zonia is 60 percent for similar reasons. Computations are as follows:
|
Product |
Pounds |
Ratio |
Allocated joint Costs |
Cost Per pound |
|
Xyclog |
4,000 |
40% |
$160,000 |
$40 |
|
Zonia |
6,000 |
60% |
240,000 |
40 |
|
|
10,000 |
100% |
$400,000 |
|
Note that the physical measurement method results in identical costs per pound for both products. This outcome implies that the benefits accruing from a pound of each product are identical. Identical benefits, however, will accrue
|
INSIGHTS & APPLICATIONS New Horizons Chemical Company Assume that New Horizons manufactures Xyclog and Zonia by processing fuzzy pears, a newly discovered fruit from the Amazon. New Horizons sells Xyclog to a pharmaceutical company as a raw material, which is used as the main ingredient for a hair restorer product. Zonia is sold to a cosmetic firm that uses it as a prime ingredient for lip gloss. |
Management at New Horizons has considered processing both Xyclog and Zonia further into consumer products but has not elected to do so at this time. Therefore, Xyclog and Zonia are considered finished goods as far as New Horizons is concerned. For every 11,000 pounds of fuzzy pears put into process, 4,000 pounds of Xyclog and 6,000 pounds of Zonia are produced. The remaining 1,000 pounds is waste for which there is no value. Production costs for processing 11,000 pounds of fuzzy pears are $400,000. |
only if the products are homogeneous. If the unit sales prices of the joint products are relatively close to each other, the products would be considered homogeneous, and the physical measurement method would be acceptable to most management accountants.
ALLOCATING JOINT COSTS BY THE RELATIVE SALES VALUE METHOD. Assume that the sales price for Xyclog is $50 per pound and the sales price for Zonia is $100 per pound. This substantial difference in sales price indicates that the products are not homogeneous. Note that the following calculations Provide costs per unit that are in proportion to the sales prices:
|
Product |
Pounds |
Market Price |
Sales Value |
Ratio |
Allocated Joint Costs |
Cost Per Pound |
|
Xyclog |
4,000 |
$ 50 |
$200,000 |
25% |
$100,000 |
$25 |
|
Zonia |
6,000 |
100 |
600,000 |
75% |
300,000 |
50 |
|
|
10,000 |
|
$800,000 |
100% |
$400,000 |
|
The relative sales value method results in identical gross margin ratios for the joint products, in contrast to the physical measurement method where they have the same cost per pound. The relative sales value method implies that the benefits accruing to a dollar of sales from each product are identical.
Attributes Needed For A Process Cost Report
Assuming you are in a company with a relational database driven accounting system, what attributes do you need to add to the basic database tables in order to produce the Process Costing reports? Using the generic REA template in Exhibit 6-13 to work on your answer. Include both the attribute and the table it would be from.
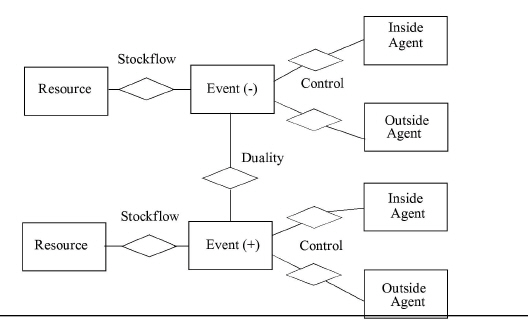
|
Summary Of Learning Objectives
The major goals of this chapter were to enable you to achieve four learning objectives:
Learning objective 1. Describe the flow of products and their cost elements through continuous processing systems, and prepare the journal entries to record these events.
Units can flow through production in many different ways, but the following are two common product flow configurations:
• Sequential
• Parallel
In a sequential configuration, products flow from one processing department to another in a serial fashion. Costs are transferred from one WIP subsidiary account to another as the units are transferred between departments, with the cost of finished goods being transferred from the last WIP subsidiary account to FGI.
In a parallel product flow, two or more products go through two or more processing departments or centers. These different processes may be carried out simultaneously, or one process may run for a while and then another starts. The flow of costs reflects the flow of units in parallel processing just as it does in sequential processing.
When an enterprise has more than one processing center and different process flow configurations, computer technology becomes an effective and efficient ally for the management accountant. Workstations in each processing center are connected in a network that covers the entire process across all processing centers. By facilitating the prompt entering and processing of data, the network can help coordinate production activities through generating online real-time reports of results. The journal entries for a normal PCAS are illustrated in the demonstration problems that follow.
Learning objective 2. Explain equivalent units of production (EUP), and calculate EUP for each cost element' in the beginning and ending inventories and in the spoilage.
If no partially completed units are rejected, or remain in WIP inventory at either the beginning or the end of the period, the unit production cost for that process can be computed very easily. The total production costs are simply divided by the number of units completed during the period. There is no need for EUP calculations.
When some units have only been partially completed during the period, as is often the case, EUP must be calculated because a partially completed unit must carry a production cost that is a fraction of the production cost of a completed whole unit. To compute EUP, the actual number of units is multiplied by their stage of completion. For example, the EUP for 500 units 30 percent complete are 150 units. Because cost elements can be input into the process at different stages and in varying amounts, EUP calculations are separately required for each cost element in each of the subsets of partially completed units (beginning and ending WIP and spoilage).
Spreadsheet programs are particularly helpful in EUP calculations because the same formula is used over and over again:
EUP = Units X Percentage complete for each cost element
If two cost elements are input into a department in exactly the same quantities and at the same times, they will have the same equivalent units. The EUP calculations are illustrated in the demonstration problems that follow.
Learning objective 3. Describe the six steps for departmental cost accounting in a PCAS.
Step 1 involves journalizing the acquisition and use of the cost elements through journal entries 1-7. Step 2 summarizes the flow of cost elements and production in the department by preparing an input usage flow diagram. In step 3, EUP are calculated for each cost element in each subset of units only partially processed during the month (beginning WIP, ending WIP, and spoilage). Step 4 entails computing unit production costs. Once costs are accumulated by the processing centers or departments, and the period's output is determined in terms of EUP, unit production costs are computed by dividing the department's costs by its output expressed in EUP. Step 5 calculates the costs of completed and transferred output, ending WIP, and spoilage. In this step, total production costs are assigned to units transferred out, ending WIP inventory, and spoiled units.
Journal entry 8 is prepared to record the transfer of products to the next department (or to FGI if this is the last department). In a normal PCAS, journal entry 8 is prepared from a departmental production cost report. Step 6 concerns preparing cost management reports analyzing whether department costs were within budget. A variety of management control reports can be prepared. In a normal PCAS, departmental costs can be compared against budgeted costs, similar to the job cost reports prepared in Exhibits 5-15 and 5-22 in the last chapter. Special spoilage and rework cost reports can be prepared if these costs are properly accounted for. In a standard PCAS, standard costs can be used to prepare detailed cost variance reports by department.
Learning objective 4. Demonstrate the differences in calculating product costs between FIFO and weighted-average methods.
If a beginning WIP inventory exists, then some production costs were charged to it in the previous accounting period. These production costs can either (1) be averaged with the current costs in calculating the unit production cost to be used this period, or (2) remain attached to the specific units in the beginning WIP inventory. The first alternative is performed by the weighted-average (WA) cost flow method. The second alternative is performed by the FIFO cost flow method.
If there is no beginning WIP, the FIFO and WA methods yield the same product costs. The separate accounting for last month's work and costs with FIFO results in three calculation differences in the two methods' production reports. In calculating EUP, beginning WIP EUP is subtracted from completed output with FIFO, but not with WA. In determining the cost to use with EUP, only this month's costs added to the department are used with FIFO because this method includes only this month's work in its EUP. With the WA method, EUP includes last month's work in the beginning WIP, so its cost includes the beginning WIP cost.
The third difference occurs in computing the cost of the completed output. FIFO requires separate calculations for the costs to complete the beginning WIP and the costs of the units both started and completed. These are then added to the beginning WIP cost to yield the cost of the completed output. Since the WA method does not account for beginning WIP separately, the average unit cost is simply multiplied by the total units completed, without regard to whether they came from beginning WIP or units started this period.
Learning objective 5. Prepare a list of attributes needed in a relational database to prepare process cost reports in an REA environment.
Developing a Process Cost Accounting System in a relational database involves adding a number of attributes to the basic tables and writing the JOCAS reports. These should be seen as extensions of the basic model.
Important Terms
By-products Incidental outputs of a joint process.
Department production cost report A PCAS report of the units produced in a department during a specified period together with their EUP and related costs.
Equivalent units of production (EUP) The number of units that could have been fully produced (made from “scratch,” or started and completed) during a period with the amount of each cost element input into that department or process.
First-in, first-out (FIFO) cost flow method A method used to account for cost flows in a PCAS in which EUP and unit costs relate only to work done during the current period.
Input usage flows The flow of cost elements in a process or department. They represent when and how much of direct materials, direct labor, and overhead are added to the process.
Input usage flow diagram A line chart that summarizes how and when cost elements are added into production. It maps input usage flows throughout production.
Joint costs Those costs incurred in a single process that yields two or more products or services simultaneously.
Joint products Two or more products resulting from a joint process. Each joint product has substantial revenue-generating ability.
Parallel processing A method of arranging processing departments or centers in which, after a certain point, some units may go through different processing departments.
Physical measure method A procedure used to allocate joint costs to the various joint products in proportion to their physical output measurement.
Relative sales value method A procedure used to allocate joint costs to the various joint products in proportion to their anticipated sales values.
Sequential processing A method of arranging processing departments in which all units flow serially from one department to another.
Split-off point The point at which the outputs of a joint process are first identifiable or can be separated as individual products.
Weighted-average (WA) cost flow method A method used to account for cost flows in a PCAS that computes an average cost per EUP. To compute this average, beginning inventory units and costs are combined with current production and costs.
Demonstration Problems
DEMONSTRATION PROBLEM 1
Journal entries to record cost elements acquisition and usage, and transfers between departments in a normal PCAS. Using the annual information below for Topper, Inc., prepare the journal entries for each event. (Note: this is the same problem as Demonstration Problem 1 in Chapters 4 and 5. It is repeated to facilitate comparisons between journal entries in a basic CAS, JOCAS, and PCAS.)
1. Raw materials beginning balance is zero, and the ending balance is $20,000. Purchases made on account are $100,000.
2. There is a $200,000 factory payroll for the year, with the following withholding rates: federal income taxes 10%, state income taxes 5%, Social Security taxes 7.5%, pension plan 2%, health insurance 1.5%.
3. Topper's payroll tax burden and fringe benefits rates are as follows: federal unemployment tax rate = 0.8% and the state's = 5.4%; fringe benefits include vacation pay (2 weeks when 50 weeks are worked in a year), Topper's contribution to a pension plan of 5.0%, and its contribution to the health insurance plan of 3.3%.
4. Other actual overhead costs, paid on account, are $88,000. Factory equipment depreciation equals $200,000.
5. Direct materials requisitioned equal $75,000.
6. $175,000 of factory labor costs represents direct labor.
7. Overhead allocation assuming a POR of 200% of direct labor cost.
New information:
8. The direct materials were for two departments: A = $50,000 and B = $25,000
9. Department A incurred $100,000 of direct labor, and department B incurred $75,000.
10. Departments A and B had no beginning WIP or ending WIP balances. 11. All Department B production was completed and transferred to FGI.
Study note: Verify that the only journal entries that have changed from the Chapter 4 and 5 solutions are the three cost element usage journal entries (5-7). These now debit WIP-Department instead of WIP-Job as in a JOCAS. Journal entry 8 is unique to the PCAS.
SOLUTION TO DEMONSTRATION PROBLEM 1
|
|
|||
|
Ref General Ledger Account Titles |
dr's |
cr's |
Notes: |
|
PURCHASE (ACQUISITION) OF RAW MATERIALS: 1: Raw Materials Inventory |
$100,000 |
|
given |
|
Accounts Payable |
|
$100,000 |
all RMI purchases are charged |
|
PREPARING (RECORDING) PAYCHECKS: 2: Gross Wages |
$200,000 |
|
given |
|
FIT Withholdings Payable |
|
$20,000 |
+$GROSS WAGES*0.1 |
|
SIT Withholdings Payable |
|
$10,000 |
+$GROSS WAGES*0.05 |
|
FICA Taxes Payable |
|
$15,000 |
+$GROSS WAGES*0.075 |
|
Pension Plan Payable |
|
$4,000 |
+$GROSS WAGES*0.02 |
|
Health Insurance Payable |
|
$3,000 |
+$GROSS WAGES*0.015 |
|
Wages Payable |
|
$148,000 |
GROSS WAGES - WITHHOLDINGS |
|
EMPLOYER'S PAYROLL TAXES & BENEFITS (BURDEN): 3: Gross Wages |
$52,000 |
|
SUM (PAYROLL BURDEN) |
|
FICA Taxes Payable |
|
$15,000 |
= withheld from paycheques |
|
FUTA Taxes Payable |
|
$1,600 |
+$GROSS WAGES*0.008, |
|
SUTA Taxes Payable |
|
$10,800 |
+$GROSS WAGES*0.054 |
|
Pension Plan Payable |
|
$10,000 |
+$GROSS WAGES*0.05 |
|
Health Insurance Payable |
|
$6,600 |
+$GROSS WAGES*0.033 |
|
Vacation Payable |
|
$8,000 |
+$GROSS WAGES*0.04 |
|
OTHER OVERHEAD COSTS INCURRED: 4: WIP-Manufacturing overhead (Other OH costs) |
$88,000 |
|
amounts given |
|
WIP-Manufacturing Overhead (Depreciation) |
$200,000 |
|
|
|
Accounts Payable |
|
$88,000 |
amounts charged |
|
Accumulated Depreciation-Factory Equipment |
|
$200,000 |
|
|
REQUISITION OF RAW MATERIALS INTO THE FACTORY: 5: WIP-Department A (DM) |
$50,000 |
|
given |
|
WIP-Department B (DM) |
$25,000 |
|
given |
|
WIP-Manufacturing Overhead (IM) |
$5,000 |
|
“plug” to balance |
|
Raw Materials Inventory |
|
$80,000 |
calculate from T-account |
|
DISTRIBUTING GROSS WAGES TO PRODUCTS: |
|
|
|
|
6: WIP-Department A (DL) |
$100,000 |
|
given |
|
WIP-Department B (DL) |
$75,000 |
|
given |
|
WIP-Manufacturing Overhead (IL) |
$77,000 |
|
“plug” to balance |
|
Gross Wages |
|
$252,000 |
gross pay + employer burden |
|
|
|
|
|
|
APPLIED OVERHEAD TO PRODUCTS: |
|
|
|
|
7: WIP-Department A (Applied Overhead) |
$200,000 |
|
POR = 200% of DL$ |
|
WIP-Department B (Applied Overhead) |
$150,000 |
|
|
|
WIP inventory-Manufacturing Overhead |
|
$350,000 |
DL$ = $175,000 (given) |
|
|
|
|
|
|
WIP TRANSFER FROM DEPARTMENT A TO DEPARTMENT B: |
|
|
|
|
8: WIP-Department B (DM transferred from A) |
$350,000 |
|
sum of input costs added |
|
WIP-Department A |
|
$350,000 |
|
|
|
|
|
|
|
PRODUCTS COMPLETED: |
|
|
|
|
9: Finished Goods Inventory |
$600,000 |
|
sum of input costs added + costs transferred from dept. A |
|
WIP-Department B |
|
$600,000 |
|
|
JOURNAL ENTRY RECORDING CONVENTIONS: 1. Use a dash to separate a control account from a subsidiary account. 2. Use parentheses for a posting reference within a general ledger account. |
|||
DEMONSTRATION PROBLEM 2 Equivalent units calculations.
Lollipops, Inc., a confectioner, produces lollipops in three departments. The first department makes secret centers. The second department inserts the secret centers into a candy mold and adds a powdered candy mix, heating and cooling it to produce a hard candy, inspecting it, and then inserting a stick. The third department wraps and boxes the lollipops.
The following information is available about the production process, units worked on, and costs for Department 2 during the month of April:
• Direct material 1: Secret centers transferred in from Department I are all added at the start of production.
• Direct material 2: 40% of the materials (candy mix) added within Department 2 are input uniformly over the first 40% of processing. Another 35% is added uniformly until processing is 50% complete. The last 25% of materials added (sticks) occurs over the last 20% of processing.
• Direct labor: 75% is incurred uniformly throughout the first half of processing. Another 15% occurs uniformly over the next 30% of processing, with the last 10% added during the last one-fifth of the process.
• Overhead: Overhead items are added uniformly throughout the entire process.
• Quality control inspection: Lollipops are inspected at the 70% completion point. A reject rate of 10% of the units inspected is considered normal.
|
DATA SECTION: |
Units |
DM Trans in |
DM Added |
DL Added |
Applied OH |
|
BEG WIP INV |
20 |
|
|
||
|
BEG % COMPLETE |
30% |
(Beginning WIP is 30% down the assembly line) |
|
||
|
BEG WIP COST |
|
$400 |
$24 |
$135 |
$55 |
|
UNITS STARTED |
100 |
|
|
|
|
|
COSTS ADDED |
|
$800 |
$421 |
$1,676 |
$203 |
|
END WIP INV |
20 |
|
|
|
|
|
END % COMPLETE |
60% |
|
|
|
|
|
UNITS COMPLETED |
85 |
|
|
|
|
|
OUTPUT LOSS |
15 |
|
|
|
|
Required:
Calculate both FIFO and WA equivalent units.
SOLUTION TO DEMONSTRATION PROBLEM 2: Lollipops, Inc. Department 2 Input Usage Flow Diagram.
Lollipops, Inc., Department 2 Input Usage Flow Diagram.
Note: DM-TI is the direct materials transferred in from Department 1DM-A is the direct materials added within Department 2
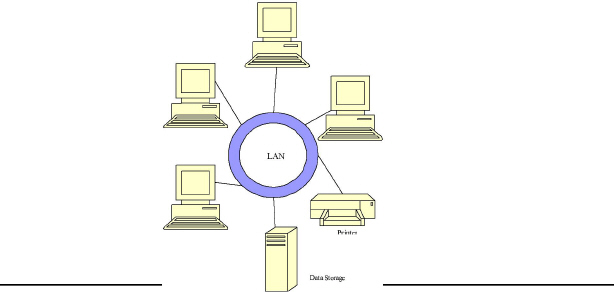
|
|
|
|
|
|
|
|
||
|
|
|
Percentage Complete Calculations |
|
|||||
|
Units: |
DM-TI |
DM-A |
DL |
OH |
||||
|
BI: |
100% |
(.3 /.4) x 40% = 30% |
(.30 /.5) x 75% = 45% |
30% |
||||
|
|
|
|
|
|
|
|
|
|
|
El: |
100% |
40% + 35% = |
75% |
75% ((.1/.3) x .15) = 80% |
60% |
|||
|
|
|
|
|
|
|
|
|
|
|
QC: |
100% |
40% + 35% = |
75% |
75% ((.2/.3) x .15) = 85% |
70% |
|||
|
|
|
|
|
|
|
|
||
|
DATA SECTION: |
|
|
|
|
|
|
|
|
Units |
DM Trans in |
DM Added |
DL Added |
|
Applied OH |
|
BEG WIP INV |
20 |
|
|
|
|
|
|
BEG % COMPLETE |
|
100.00% |
30.00% |
|
45.00% |
30.00% |
|
BEG WIP COST |
|
$400 |
$24 |
$135 |
|
$55 |
|
UNITS STARTED |
100 |
|
|
|
|
|
|
COSTS ADDED |
|
$800 |
$421 |
$1,676 |
|
$203 |
|
END WIP INV |
20 |
|
|
|
|
|
|
END % COMPLETE |
|
100.00% |
75.00% |
|
80.00% |
60.00% |
|
UNITS COMPLETED |
85 |
|
|
|
|
|
|
OUTPUT LOSS |
15 |
|
|
|
|
|
|
LOSS % COMPLETE |
|
100.00% |
75.00% |
|
85.00% |
70.00% |
|
COST METHOD |
1 |
(1 = FIFO, 2 = WEIGHTED-AVERAGE) |
||||
|
SOLUTION SECTION: |
FIFO |
|
|
|
|
|
|
LOLLIPOPS, INC. DEPARTMENT 2 COST REPORT APRIL 1994 |
|||||
|
EQUIVALENT UNITS |
Units |
DM Trans in |
DM Added |
DL Added |
Applied OH |
|
UNITS COMPLETED |
85 |
85.00 |
85.00 |
85.00 |
85.00 |
|
LESS: BEG WIP |
<20> |
<20.00> |
<6.00> |
<9.00> |
<6.00> |
|
ADD: ENDING WIP |
20 |
20.00 |
15.00 |
16.00 |
12.00 |
|
ADD: OUTPUT LOSS |
15 |
15.00 |
11.25 |
12.75 |
10.50 |
|
UNITS STARTED |
100 |
|
|
|
|
|
EQUIVALENT UNITS |
|
100.00 |
105.25 |
104.75 |
101.50 |
|
SOLUTION SECTION: |
Weighted-Average |
|
|
|
|||
|
LOLLIPOPS, INC. DEPARTMENT 2 COST REPORT APRIL 1994 |
|
||||||
|
EQUIVALENT UNITS |
Units |
|
DM Trans in |
DM Added |
DL Added |
Applied OH |
|
|
UNITS COMPLETED LESS: BEG WIP ADD: ENDING WIP ADD: OUTPUT LOSS |
85 <20> 20 15 |
|
85 n/a 20 15 |
85 n/a 15 11.25 |
85 n/a 16 12.75 |
85 n/a 12 10.50 |
|
|
UNITS STARTED EQUIVALENT UNITS |
100 |
|
120 |
111.25 |
113.75 |
107.50 |
|
|
DEMONSTRATION PROBLEM 3 Transferring costs between departments using WA and FIFO cost flow methods.Using the information from Demonstration Problem 2, prepare the Department 2 production cost report for April using both the FIFO and WA methods. Then prepare the following journal entries to transfer lollipops from Department 2 to Department 3: 1. Both FIFO and WA journal entries with all spoilage treated as a department cost variance. 2. Using the WA cost values only with normal spoilage treated as a cost of overhead. 3. Using the WA cost values only with normal spoilage allocated to the good lollipops passing inspection. |
|||||||
|
SOLUTION TO DEMONSTRATION PROBLEM 3: FIFO Report: |
|
|
|
||||
|
Solution Section: Fifo |
|
|
|
|
|
||
|
|
|
LOLLIPOPS, INC. PRODUCTION DEPARTMENT 2 COST REPORT APRIL 1994 |
|
|
|||
|
Equivalent Units: |
Units |
DM Trans in |
DM Added |
DL Added |
Applied OH |
Totals |
|
|
Units Completed |
85 |
85.00 |
85.00 |
85.00 |
85.00 |
|
|
|
Less: Beg Wip |
<20> |
<20.00> |
<6.00> |
<9.00> |
<6.00> |
|
|
|
Add: Ending Wip |
20 |
20.00 |
15.00 |
16.00 |
12.00 |
|
|
|
Add: Output Loss |
15 |
15.00 |
11.25 |
12.75 |
10.50 |
|
|
|
Units Started |
100 |
|
|
|
|
|
|
|
Equivalent Units |
|
100.00 |
105.25 |
104.75 |
101.50 |
|
|
|
|
|
|
|
|
|
|
|
|
Cost/equivalent Unit: |
|
|
|
|
|
|
|
|
Beginning Wip Costs Costs Added This Month |
|
n/a $800 |
n/a $421 |
n/a $1,676 |
n/a $203 |
n/a $3,100 |
|
|
Costs Incurred |
|
$800 |
$421 |
$1,676 |
$203 |
$3,100 |
|
|
Unit Costs |
|
$8.00 |
$4.00 |
$16.00 |
$2.00 |
$30.00 |
|
|
|
|
|
|
|
|
|
|
|
Cost Allocations: |
|
|
|
|
|
|
|
|
Units Completed: |
85 |
n/a |
n/a |
n/a |
n/a |
n/a |
|
|
Beg Wip Costs |
20 |
$400 |
$24 |
$135 |
$55 |
$614 |
|
|
Costs To Complete |
|
0 |
56 |
176 |
28 |
260 |
|
|
Started This Month |
65 |
520 |
260 |
1,040 |
130 |
1,950 |
|
|
Costs Transferred Out |
|
$920 |
$340 |
$1,351 |
$213 |
$2,824 |
|
|
Ending Wip Inv.: |
20 |
$160 |
$60 |
$256 |
$24 |
$500 |
|
|
Output Loss: |
15 |
$120 |
$45 |
$204 |
$21 |
$390 |
|
|
Costs Accounted For: |
|
$1,200 |
$445 |
$1,811 |
$258 |
$3,714 |
|
|
|
|
|
|
|||
|
SOLUTION TO DEMONSTRATION PROBLEM 3: WA Report. |
|
|
|
|||
|
SOLUTION SECTION: WA |
|
|
|
|||
|
LOLLIPOPS, INC. PRODUCTION DEPARTMENT 2 COST REPORT APRIL 1994 |
||||||
|
EQUIVALENT UNITS: |
Units |
DM Trans in |
DM Added |
DL Added
|
Applied OH |
Totals |
|
UNITS COMPLETED |
85 |
85.00 |
85.00 |
85.00 |
85.00 |
|
|
LESS: BEG WIP |
<20> |
n/a |
n/a |
n/a |
n/a |
|
|
ADD: ENDING WIP |
20 |
20.00 |
15.00 |
16.00 |
12.00 |
|
|
ADD: OUTPUT LOSS |
15 |
15.00 |
11.25 |
12.75 |
10.50 |
|
|
UNITS STARTED |
100 |
|
|
|
|
|
|
EQUIVALENT UNITS |
|
120.00 |
111.25 |
113.75 |
107.50 |
|
|
COST/EQUIVALENT UNIT: |
|
|
|
|
|
|
|
BEGINNING WIP COSTS |
|
$400 |
$24 |
$135 |
$55 |
$614 |
|
COSTS ADDED THIS MONTH |
|
800 |
421 |
1,676 |
203 |
$3,100 |
|
COSTS INCURRED |
|
$1,200 |
$445 |
$1,811 |
$258 |
$3,714 |
|
UNIT COSTS |
|
$10.00 |
$4.00 |
$15.92 |
$2.40 |
$32.32 |
|
COST ALLOCATIONS: |
|
|
|
|
|
|
|
UNITS COMPLETED: |
85 |
$850 |
$340 |
$1,353 |
$204 |
$2,747 |
|
BEG WIP COSTS |
|
n/a |
n/a |
n/a |
n/a |
n/a |
|
COSTS TO COMPLETE |
|
n/a |
n/a |
n/a |
n/a |
n/a |
|
STARTED THIS MONTH |
|
n/a |
n/a |
n/a |
n/a |
n/a |
|
COSTS TRANSFERRED OUT |
|
$850 |
$340 |
$1,353 |
$204 |
$2,747 |
|
ENDING WIP INV: |
20 |
$200 |
$60 |
$255 |
$29 |
$544 |
|
OUTPUT LOSS: |
15 |
$150 |
$45 |
$203 |
$25 |
$423 |
|
COSTS ACCOUNTED FOR: |
|
$1,200 |
$445 |
$1,811 |
$258 |
$3,714 |
|
SOLUTION TO DEMONSTRATION PROBLEM 3: Journal entries for transfers. la. FIFO: |
|||||
|
|
WIP-Department 3 (DM from Dept. 2) WIP-Department 2 Spoilage Cost Variance WIP-Department 2 |
|
$2,824 $ 390 |
$3,214 |
|
|
lb. |
WA: |
|
|||
|
|
WIP-Department 3 (DM from Dept. 2) |
|
$2,747 |
|
|
|
|
WIP-Department 2 Spoilage Cost Variance |
|
$ 423 |
|
|
|
|
WIP-Department 2 |
|
|
$3,170 |
|
|
2. |
WIP-Department 3 (DM from Dept. 2) |
|
$2,747 |
|
|
|
|
WIP-Manufacturing Overhead (Spoilage) |
|
$ 282 |
|
|
|
|
Loss from Abnormal Spoilage |
|
$ 141 |
|
|
|
|
WIP-Department 2 |
|
|
$3,170 |
|
|
3. |
WIP-Department 3 (DM from Dept. 2)* |
|
$3,029 |
|
|
|
|
Loss from Abnormal Spoilage |
|
$ 141 |
|
|
|
|
WIP-Department 2 |
|
|
$3,170 |
|
* Note: All NOL is added to transferred out lollipops because the El units have not yet been inspected and, therefore, are not part of the good lollipops passing inspection.
NOL and AOL Calculations:
NOL = 10% X [20 units (BI) + 100 units (started) - 20 units (EI) = 100 units] = 10 units
AOL = 15 units rejected - 10 units (NOL) = 5 units
Normal spoilage cost = (10 units / 15units) X $423 = $282
Abnormal spoilage cost = (5 units / 15 units) X $423 = $141
Review Questions
6.1 Compare a process and a job order production environment.
6.2 Compare the WIP subsidiary ledger system in a JOCAS and in a PCAS.
6.3 What is the basic formula for computing unit cost in a PCAS?
6.4 How does the basic CAS in Chapter 4 compare to a PCAS?
6.5 What is the purpose of a department production cost report?
6.6 List the key differences between a JOCAS and PCAS.
6.7 What is the basic objective of a PCAS?
6.8 Describe the physical flow of units and the flow of costs in a sequential processing configuration.
6.9 Describe the physical flow of units and the flow of costs in a parallel processing configuration.
6.10 Give an example of a product line that is made sequentially and one made in a parallel process.
6.11 How is WIP transferred into a subsequent department accounted for within the receiving department?
6.12 Which PCAS journal entries are the same as those in a JOCAS?
6.13 Which PCAS journal entries are different from those in a JOCAS?
6.14 What new journal entry is required in a PCAS, and why?
6.15 What is the one difference in recording cost element usage journal entries in a PCAS as compared to a JOCAS?
6.16 What is the difference between PCAS and JOCAS subsidiary ledger systems for FGI and COGS?
6.17 What is meant by EUP? Why is it necessary to use EUP to determine the actual production for a period?
6.18 What four events usually happen in traditional PCASs?
6.19 How does the existence of partially completed output in a department change the basic PCAS formula for calculating unit cost?
6.20 What is the formula for EUP? Give an example calculation.
6.21 List and briefly describe the six steps in a PCAS.
6.22 Contrast “units to be accounted for” and “units accounted for.” Why is this distinction important?
6.23 Why is it important to ascertain how products flow through a department?
6.24 Explain a FIFO flow. Give an example product that would be produced in this way.
6.25 Explain a WA cost flow. Give an example product that would be produced in this way.
6.26 What can be said about the FIFO and WA cost flow methods when there is no beginning WIP in a department? Why is this true?
6.27 What is an input usage flow? Why is it important in calculating EUP?
6.28 What is an input usage flow diagram, and why is it important?
6.29 What is linear interpolation, and why is it important in determining a cost element's percentage complete for a specific subset of products?
6.30 What is the formula for linear interpolation? Give an example calculation.
6.31 What is the difference between WA and FIFO EUP?
6.32 Why is beginning WIP EUP subtracted from units completed in FIFO, but not in WA?
6.33. Explain why multiple EUP may have to be calculated for direct materials.
6.34 When will different cost elements have the same EUP?
6.35 List two versions of the formula for calculating the total cost of an input item in a particular subset of units.
6.36 What is the total cost formula for FIFO costs to complete the beginning WIP this month?
6.37 What is the one basic difference between FIFO and WA, and what effect does it have on the production department cost reports?
6.38 From the standpoint of cost control, why is the FIFO method superior to the WA method?
6.39 How can last month's unit cost be calculated from this month's FIFO cost report? Give an example.
6.40 Differentiate between normal and abnormal spoilage. Explain how both should be reported for management purposes.
6.41 How are the amounts of normal and abnormal spoilage determined at an inspection point?
6.42 What is the justification for spreading the cost of spoiled units over the remaining good units?
6.43 When does normal spoilage have to be allocated between ending WIP and good units transferred out of the department?
6.44 Define:
• Joint costs
• Joint products
• Split-off point
• By-products
Give an example of a situation in which all these terms come into play.
6.45 Describe two methods of allocating joint costs to joint products.
6.46 What are the implications for the joint products' unit costs and profit from using these two methods?
Chapter-specific Problems
These problems require responses based directly on concepts and techniques presented in the text.
6.47 calculating equivalent units of production. Xanadu produces multimedia computers. Its sales for May are 125,000 units. The following additional data are provided:
|
|
NUMBER OF UNITS |
|
Beginning inventory: |
|
|
Work-in-process |
-0- |
|
Finished goods |
37,500 |
|
Budgeted inventory at May 31: |
|
|
Work-in-process (75% processed) |
8,000 |
|
Finished goods |
30,000 |
Required: Calculate the number of equivalent units of production (EUP) for Xanadu for May assuming all inputs are added uniformly throughout production.
6.48 Calculating equivalent units of production. [AICPA adapted] The Lodi Company uses a process costing system to account for the costs of its only product, Wizmo. Production begins in the Fabrication Department where units of raw material are molded into various connecting parts. After fabrication is complete, the units are transferred to the Assembly Department. No material is added in the Assembly Department. After assembly is complete, the units are transferred to the Packaging Department
|
|
UNITS |
|
Beginning WIP (40% complete as to conversion costs) |
500 |
|
Started |
2,000 |
|
Transferred to the Finishing Department |
2,100 |
|
Ending WIP (25% complete as to conversion costs) |
400 |
Direct labor and overhead are added into the process uniformly, so they are combined together as conversion costs for EUP calculations.
Required:
a. What are the EUP for the month of July?
b. Using the same data, what are the EUP under the WA method?
6.50 Calculating FIFO equivalent units of production. The Assembly Department is the second process of Elgin Company's production cycle. On May 1, beginning WIP contained 25,000 units that were 60% complete as to overhead. During May, 100,000 units were transferred in from the first process. On May 31, ending WIP contained 20,000 units that were 80% complete as to overhead; 100,000 units were completed. Direct materials are added at the end of the process. Direct labor is added uniformly over the last half of the process. Spoilage occurs at the 75% stage of completion. Overhead is added uniformly throughout the process.
Required: Using the FIFO cost flow method, calculate the EUP at May 31.
6.51 Calculating WA EUP. Using the information from the preceding problem, calculate the weighted-average EUP.
6.52 Production cost report using the WA method. [AICPA adapted] You have just been hired as the cost accountant for Digitech Corporation. This position has been vacant for one month. Fred Sotheby, manager of Digitech’s tax department, has performed some computations for last month's information. However, he confesses that he doesn't remember a great deal about cost accounting. Fred took the following costs and units for last month (July 1994) from the financial statements:
|
|
UNITS |
COSTS |
|
Work-in-process (50% complete as to labor and overhead) |
300,000 |
$ 660,960 |
|
Finished goods |
200,000 |
1,009,800 |
Materials are added at the beginning of production, and overhead is applied to each product at the rate of 60% of direct labor costs. Labor and overhead are incurred uniformly throughout the process. There was no finished goods inventory at the beginning of last month. A review of Digitech's inventory cost records provides you with the following information:
|
|
Units |
Direct Materials costs |
Direct Labour Costs |
|
Work-in-process, 07/01/94 |
|
|
|
|
(80% complete as to labor and overhead) |
200,000 |
$ 200,000 |
$ 315,000 |
|
Units started in production |
1,000,000 |
|
|
|
Units completed in July |
900,000 |
|
|
|
Costs for July |
|
1,300,000 |
1,995,000 |
Required:
a. Prepare a production cost report for July.
b. Prepare the journal entry to correct the recorded amounts for finished goods and work-in-process inventory.
6.53 Production cost report in second department using the WA method. Lakeview Corporation manufactures plastic toys that require operations in three separate departments: Molding, Assembling, and Finishing. Additional materials are added during the assembly process. The company uses the WA method, and the following information is available for the Assembling Department for the month of June 1994.
|
|
|
|
|
Beginning inventory (degree of completion: transferred in 100%; direct materials,100%; direct labor, 60%; overhead, 50%) |
2,000 units |
|
|
Transferred in from Molding |
10,000 units |
|
|
Ending inventory (degree of completion: transferred in, 100%; direct materials,90%; direct labor, 70%; overhead, 35%) |
4,000 units |
|
|
Transferred to Finishing |
8,000 units 1 |
|
|
|
|
|
|
COSTS |
Beginning Inventory |
Current Period |
|
Transferred in |
$32,000 |
$160,000 |
|
Direct materials |
20,000 |
96,000 |
|
Direct labor |
7,200 |
36,000 |
|
Overhead |
5,500 |
18,000 |
Required: Prepare a production cost report for the Assembling Department for June 1994. [AICPA adapted]
6.54. Weighted-average and FIFO methods. The Belltone company assembles cellular telephones on a one-process operation. Belltone combines DL and OH into conversion costs. Data for May follow:
|
|
|
|
Units |
|
Beginning WIP inventory: |
|
|
|
|
Direct materials (100% complete) |
|
|
10,000 |
|
Conversion costs (75% complete) |
|
|
10,000 |
|
Units started during May |
|
|
70,000 |
|
Ending WIP inventory: Direct materials (100% complete) |
|
|
12,000 |
|
Conversion costs (40% complete) |
|
|
12,000 |
|
Costs of beginning WIP inventory: Direct materials |
$ 12,000 |
|
|
|
Conversion costs |
14,000 |
$ 26,000 |
|
|
Costs of current period: Direct materials |
$ 86,000 |
|
|
|
Conversion costs |
100,000 |
186,000 |
|
|
|
|
$212,000 |
|
Required:
a. Assuming the WA method, prepare a production cost report for May.
b. Assuming the FIFO method, prepare a production cost report for May.
6.55 FIFO and WA production reports. Marshall Manufacturing produces a single product in two production departments: Department A and Department B. The following data pertain to production in both departments for the month of June:
|
|
DEPARTMENT A |
DEPARTMENT B |
|
Beginning WIP inventory |
2,000 |
1,000 |
|
Units started |
6,000 |
------- |
|
Units transferred to B |
5,000 |
------- |
|
Units transferred to finished goods |
|
4,000 |
|
Ending WIP inventory |
3,000 |
2,000 |
|
Cost data: Direct materials |
$32,000 |
$ ------- |
|
Conversion costs |
37,000 |
25,500 |
|
Beginning WIP inventory costs: Transferred in * |
------------ |
11,000 |
|
Direct materials |
8,000 |
|
|
Conversion costs |
5,000 |
6,000 |
*Also called prior department costs.
In Department A, the direct materials are added at the beginning of the process, and the beginning WIP inventory is three-fifths complete as to conversion costs (DL + OH), while ending WIP inventory is two-thirds complete. No additional direct materials are added in Department B. Conversion costs are incurred uniformly throughout both departments. The beginning WIP inventory in Department B is 75% complete and the ending WIP inventory is 25% complete as to conversion costs.
Required: Determine the value of WIP inventory as of June 30 and the cost of goods transferred to finished goods inventory using the WA and FIFO cost flow methods. [AICPA adapted]
6.56 Converting the form of units, adding materials, and accounting for spoilage. Portland Chemical Company manufactures one product called LawnCare. Process Center A and Process Center B are required to produce this product. Physical production data for March are as follows:
• Units transferred:
• From Process Center A to Process Center B: 2,200 pounds
• From Process Center B to finished goods: 900 gallons
• Units spoiled in Process Center B: 100 gallons
Inventory data:
|
|
Process Center A |
Process Center B |
||
|
|
Beginning |
Ending |
Beginning |
Ending |
|
Units |
200 |
300 |
200 |
300 |
|
Degree of completion as to conversion costs: |
1/2 |
1/2 |
1/2 |
2/3 |
For each unit of Process Center A output, two units of raw material X are put in at the start of processing. For each unit of Process Center B output, three cans of raw material Y are put in at the end of processing and two pounds of Process Center A output are put in at the start. Spoilage generally occurs in Process Center B at the start of the process.
Work-in-process accounts are maintained for materials, conversion costs (DL + OH), and prior department costs. Portland uses the FIFO cost flow method for inventory evaluation for Process Center A and the WA cost flow method for inventory valuation for Process Center B.
Required: Determine the EUP for Process Center A and Process Center B. [AICPA adapted]
6.57 Weighted-average method versus the FIFO method. Kristina Company, which manufactures quality paint sold at premium prices, uses a single production department. Production begins with the blending of various chemicals, which are added at the beginning of the process, and ends with the canning of the paint. Canning occurs when the mixture reaches the 90% stage of completion. The gallon cans are then transferred to the Shipping Department for crating and shipment. Labor and overhead are added continuously throughout the process. Factory overhead is applied on the basis of direct labor hours at the rate of $3 per hour.
Prior to May, when a change in the process was implemented, WIP inventories were insignificant. The change in the process enables greater production but results in material amounts of WIP for the first time. The company has always used the WA method to determine equivalent production and unit costs. Now, production management is considering changing from the WA method to the FIFO method.
The following data relate to actual production during the month of May:
|
COSTS FOR MAY |
|
|
Work-in-process inventory, May 1(4,000 gallons 25% complete): Direct materials-chemicals |
$ 45,600 |
|
Direct labor ($10 per hour) |
6,250 |
|
Factory overhead |
1,875 |
|
May costs added: Direct materials-chemicals |
228,400 |
|
Direct materials-cans |
7,000 |
|
Direct labor ($10 per hour) |
35,000 |
|
Factory overhead |
10,500 |
|
|
|
|
UNITS FOR MAY |
GALLONS |
|
Work-in-process inventory, May 1 |
|
|
(25% complete) |
4,000 |
|
Sent to Shipping Department |
20,000 |
|
Started in May |
21,000 |
|
Work-in-process inventory, May 31(80% complete) |
5,000 |
Required:
a. Prepare a schedule of equivalent units for each cost element for the month of May using the:
1. WA method. 2. FIFO method.
b. Calculate the cost (to the nearest cent) per equivalent unit for each cost element for the month of May using the:
1. WA method. 2. FIFO method.
c. Discuss the advantages and disadvantages of using the WA method versus the FIFO method, and explain under what circumstances each method should be used. [CMA adapted]
6.58 Transferred-in and conversion costs per EUP using the WA method. [AICPA adapted] The following data pertain to the Malone Company:
|
|
|
|
Units |
Costs |
|
|
|
Beginning WIP inventory Units transferred in Units completed Ending WIP inventory
|
5,000 35,000 37,000 3,000 |
$6,300 58,000 |
|
|
|
|
|
|
|
|
Transferred In Costs |
Direct Materials Costs |
Conversion Costs |
Total Costs |
|
Beginning WIP |
$ 2,900 |
$ - |
$ 3,400 |
$ 6,300 |
|
Transferred in |
17,500 |
25,500 |
15,000 |
58,000 |
|
|
$20,400 |
$25,500 |
$18,400 |
$64,300 |
Conversion costs (DL + OH) were 20% complete as to beginning WIP inventory and 40% complete as to ending WIP inventory. All direct materials are added at the end of the process. The WA method is used.
Required: a. Calculate the cost per EUP for conversion costs, rounded to the nearest penny.
b. Calculate the portion of the total costs of ending WIP inventory attributable to transferred in costs.
6.59 Calculating abnormal spoilage. A company that manufactures baseballs begins operations on January 1. Each baseball requires three elements:
• A hard plastic core
• Several yards of twine that are wrapped around the plastic core
• A piece of leather to cover the baseball
The plastic core is started down a conveyor belt and is automatically wrapped with twine to the approximate size of a baseball, at which time the leather cover is sewn to the wrapped twine.
Finished baseballs are inspected, and defective ones are pulled out. Defective baseballs cannot be economically reworked and are destroyed. Normal spoilage is 3% of baseballs that pass inspection. Costs for the first week of operations are:
|
Direct materials cost |
$ 840 |
|
Conversion costs (DL + OH) |
315 |
|
|
$1,155 |
During the week, 2,100 baseballs were completed, and 2,000 passed inspection. There was no ending WIP inventory.
Required: Calculate abnormal spoilage cost. [CIA adapted]
6.60 The FIFO method for spoilage. Sedco Manufacturing manufactures product A in three processes, each of which is done by a different department. The Finishing Department is the last process before product A is completed and transferred to finished goods inventory.
All materials needed to complete product A are added at the beginning of the process in the Finishing Department, and spoiled units, if any, occur only at this point. Conversion costs (DL + OH) are incurred uniformly throughout the process. The company uses the FIFO cost flow method in its cost accounting system and has accumulated the following data for October for the Finishing Department:
|
1. Production of Product A: |
|
|
Beginning WIP inventory (conversion work is 3/4 complete) |
10,000 |
|
Transferred from preceding departments during October |
40,000 |
|
Completed and transferred to finished goods inventory during October |
35,000 |
|
Ending WIP inventory (conversion work is 1/2 complete) |
10,000 |
|
2. Cost of beginning WIP inventory: |
|
|
Costs from preceding departments |
$ 38,000 |
|
Costs added in Finishing Department prior to October 1: Direct materials |
21,500 |
|
Conversion costs |
81,000 |
|
|
$140,500 |
|
3. |
Units transferred to the Finishing Department during October had costs of $140,000 assigned from preceding departments. |
|
|
4. |
During October, the Finishing Department incurred the following costs |
|
|
|
Direct materials |
$ 70,000 |
|
|
Conversion costs |
292,500 |
|
|
|
$362,500 |
Required:
a. Prepare a production cost report for the Finishing Department using the FIFO method.
b. Even though the problem states that spoilage occurs at the beginning of the process, prepare a production cost report for the Finishing Department assuming that spoilage occurs at the end of the process.
6.61 Assigning costs to transferred units, ending WIP, and abnormal spoilage. The Babbage Company uses a process costing system in its three-department operation. A unit of product passes through molding, assembly, and finishing before it is transferred to finished goods. Finishing Department data for May follow:
|
|
|
|
Beginning WIP |
1,400 |
|
Units transferred in from the Assembly Department |
14,000 |
|
Units spoiled |
700 |
|
Units transferred to finished goods inventory |
11,200 |
Direct materials are added at the beginning of the processing in the Finishing Department without changing the number of units being processed. Beginning WIP inventory was 70% complete as to conversion costs (DL + OH).
Ending WIP inventory was 40% complete as to conversion costs. All spoilage was discovered at final inspection before the units were transferred to finished goods; 560 of the units spoiled were within the limit considered normal.
The Babbage Company uses the WA method. The equivalent units and the current costs per EUP for each cost factor are as follows:
|
|
Eup |
Current Costs Per Eup |
|
Transferred in |
15,400 |
$5 |
|
Direct materials |
15,400 |
1 |
|
Conversion costs |
13,300 |
3 |
|
Total cost per EUP |
|
$9 |
Required:
a. Calculate the cost of production transferred to the finished goods inventory.
b. Calculate the costs assigned to WIP inventory on May 31.
c. What are the total costs transferred in from the Assembly Department during May if the total costs of prior departments included in the WIP of the Finishing Department on May 1 amounted to $6,300?
d. What is the cost associated with abnormal spoilage?
e. To what account are abnormal spoilage costs usually charged? [CMA adapted]
Think-tank Problems
Although these problems are based on chapter material, reading extra material, reviewing previous chapters, and using creativity may be required to develop workable solutions.
6.62 Equivalent units of production and unit costs. Wood Glow Manufacturing Company produces a single product, a wood refinishing kit that sells for $17.95. The final processing of the kits occurs in the Packaging Department. An internal quilted wrap is applied at the beginning of the packaging process. A compartmented outside box printed with instructions and the company's name and logo is added when units are 60% through the process. Conversion costs, consisting of direct labor and applied overhead, occur evenly throughout the packaging process. Conversion activities after the addition of the box involve package sealing, testing for leakage, and final inspection. Rejections in the Packaging Department are rare and may be ignored. The following data pertain to the activities of the Packaging Department during the month of October:
• Beginning WIP inventory was 10,000 units, 40% complete as to conversion costs.
• 30,000 units were started and completed in the month.
• There were 10,000 units in ending WIP, 80% complete as to conversion costs.
|
The Packaging Department's October costs were: |
|
|
Quilted wrap |
$80,000 |
|
Outside boxes |
50,000 |
|
Direct labor |
22,000 |
|
Applied overhead ($3 per direct labor dollar) |
66,000 |
The costs transferred in from prior processing were $3 per unit. The cost of goods sold for the month was $240,000, and the ending finished goods inventory was $84,000. Wood Glow uses the FIFO method of inventory valuation.
Wood Glow's controller, Mark Brandon, has been asked to analyze the activities of the Packaging Department for the month of October. Brandon knows that in order to properly determine the department's unit cost of production, he must first calculate the EUP.
Required:
a. Prepare an EUP schedule for the October activity in the Packaging Department. Be sure to account for the beginning WIP inventory, the units started and completed during the month, and the ending WIP inventory.
b. Determine the cost per equivalent unit of the October production.
c. Assuming that the actual overhead incurred during October was $5,000 more than the overhead applied, describe how the value of the ending WIP inventory could be determined. [CMA adapted]
6.63 Production cost report using WA and FIFO methods. Deterra, Inc., uses three departments to produce a detergent. The Finishing Department is the third and last step before the product is transferred to storage.
All materials needed to give the detergent its final composition are added at the beginning of the process in the Finishing Department. Any lost units occur only at this point and are considered to be normal.
The company uses FIFO costing. The following data for the Finishing Department for October have been made available:
|
Production data: In process, October 1 (labor and factory overhead, .75 complete) Transferred in from preceding department Finished and transferred to storage In process, October 31(labor and factory overhead, .5 complete) |
10,000 gallons 40,000 gallons 35,000 gallons 10,000 gallons |
|
Additional data: Work-in-process inventory, October 1: Cost from preceding department |
$ 38,000 |
|
Cost from this department: Materials |
21,500 |
|
Labor |
39,000 |
|
Factory overhead |
42,000 |
|
Total work-in-process inventory, October 1 |
$140,500 |
|
Transferred in during October |
$140,000 |
|
Cost added in this department Materials |
$ 70,000 |
|
Labor |
162,500 |
|
Factory overhead |
130,000 |
|
Total costs added |
$362,500 |
|
Total costs to be accounted for |
$643,000 |
Required:
a. Prepare a production cost report for the Finishing Department for October using the FIFO method.
b. Prepare a production cost report for the Finishing Department for October using the WA method. (Carry unit cost calculations to three decimal places and round up the digit “5” in the fourth decimal place.)
6.64 Accretion and production cost reports for two departments using the FIFO an WA methods. The Crews Company produces a chemical agent for commercial use. The company accounts for production in two cost centers: (1) Cooking and (2) Mix-Pack. In the first cost center, liquid substances are combined in large cooker and boiled. After the batch is cooked, it is transferred to Mix-Pack, the second cost center, where a quantity of alcohol equal to the liquid measure of the batch is added. Following this, the batch is mixed and bottled in one-gallon containers:
Material is added at the beginning of production in each cost center, and labor is added equally during production in each cost center. The FIFO method is use in the Cooking Department and the WA method in the Mix-Pack Department.
The following information is available for the month of October:
|
|
COOKING |
MIX-PACK |
|
|
$ 996 |
$ 114 |
|
|
Cooking |
Mix-Pack |
|
Work-in-process, October 1: Materials |
$996 |
$114 |
|
Labor |
100 |
60 |
|
Overhead |
80 |
48 |
|
Prior department cost |
0 |
426 |
|
Month of October: Materials |
$39,600 |
$15,276 |
|
Labor |
10,050 |
16,000 |
|
Overhead |
8,040 |
12,800 |
Inventory and production records show that Cooking had 1,000 gallons, 40% processed, on October 1 and 800 gallons, 50% processed, on October 31; Mix-Pack had 600 gallons, 50% processed, on October 1 and 1,000 gallons, 30% processed, on October 31.
Production reports for October show that Cooking started 40,000 gallons into production and completed and transferred 40,200 gallons to Mix-Pack, and Mix-Pack completed and transferred 80,000 one-gallon containers of the finished product to the distribution warehouse.
Required:
a. Prepare a production cost report for the Cooking Department.
b. Prepare a production cost report for the Mix-Pack Department. [AICPA adapted]
6.65 Normal and abnormal spoilage. Romano Foods, Inc., manufactures Roman Surprise Fresh Frozen Pizzas, which are 12 inches in diameter and retail for $4.69 to $5.99, depending upon the topping. The company employs a PCAS in which the product flows through several processes. Joe Corolla, Vice President of Production, has had a long-running disagreement with the controller, Sue Marshall, over the handling of spoilage costs. Corolla resists every attempt to charge production with variance responsibilities unless they are favorable. Spoilage costs have not been significant in the past, but in November, the Mixing Department had a substantial amount of spoilage. Traditionally, Romano Foods has treated 10% of good output as normal spoilage. The department input 120,000 units of ingredients, and 13,000 dough units were rejected at inspection. Marshall is concerned about the abnormal spoilage and wants Corolla to take corrective steps. Corolla, on the other hand, maintains that the Mixing Department is operating properly. He has prepared the following report for the Mixing Department to support his contention.
|
|
Romano Foods-Mixing Department Production Cost Report Month Ended November 30, 20x8 |
|
|||
|
|
|
Good Output Units |
10% Normal Spoilage |
Abnormal Spoilage |
Good Unit Cost |
|
Input Units |
Total Cost |
||||
|
120,000 |
$45,360 |
107,000 |
12,000 |
1,000 |
$0.42 |
|
|
Budgeted unit cost |
$0.435 |
|
||
|
|
Actual cost per good unit |
0.420 |
|
||
|
|
Favorable variance |
$0.015 |
|
||
|
|
|
|
COST RECONCILIATION |
|
|
Cost of 107,000 good units |
|
|
@ $0.42 each |
$44,940 |
|
Abnormal spoilage (charge to purchasing for buying inferior materials): 1,000 units @ $0.42 each |
420 |
|
Total cost |
$45,360 |
|
|
|
Required:
a. Revise Joe Corolla's production cost report for November 20x8 by calculating
1. The number of units of normal spoilage.
2. The number of units of abnormal spoilage.
3. The total and unit costs of the Mixing Department's production of good units in November.
4. The total and unit costs of abnormal spoilage.
b. Prepare the journal entry to transfer costs for the Mixing Department for November to the Assembly Department.
c. Describe how Joe Corolla's production cost report shows the performance of the Mixing Department to be less favorable than that shown in the revised report. [CMA adapted]
6.66 Equivalent units of production cost per unit, normal spoilage, and ending WIP costs. Ranka Company manufactures high-quality leather products. The company's profits have declined during the past nine months. Ranka has used unit cost data (which were developed 18 months ago) in planning and controlling its operations. In an attempt to isolate the causes of poor profit performance, management is investigating the manufacturing operations of each of its products.
One of Ranka's main products is fine leather belts. The belts are produced in a single, continuous process in the Bluett Plant. During the process, leather strips are sewn, punched, and dyed. Buckles are attached by rivets when the belts are 70% complete as to direct labor and overhead (conversion costs). The belts then enter a final finishing stage to conclude the process. Labor and overhead are applied continuously during the process.
The leather belts are inspected twice during the process: (1) just before the buckles are attached (70% point in the process) and (2) at the conclusion of the finishing stage (100% point in the process). Ranka uses the WA method to calculate its unit costs.
The leather belts produced at the Bluett Plant sell wholesale for $9.95 each. Management wants to compare the current manufacturing costs per unit with the prices on the market for leather belts. Top management has asked the Bluett Plant to submit data on the cost of manufacturing the leather belts for the month of October. These data will be used to evaluate whether modifications in the production process should be initiated or whether an increase in the selling price of the belts is justified. The cost per equivalent unit being used for planning and control purposes is $5.35 per unit.
On October 1, the WIP inventory consisted of 400 partially completed units. The belts were 25% complete as to conversion costs. The costs included in the inventory on October 1 were as follows:
|
Leather strips |
$1,000 |
|
Conversion costs |
300 |
|
|
$1,300 |
During October, 7,600 leather strips were placed in production. A total of 6,800 good leather belts were completed. A total of 300 belts were identified as defective at the two inspection points--100 at the first inspection point (before the buckle is attached) and 200 at the final inspection point (after finishing). The quantity of defective belts was considered normal. In addition, 200 belts were removed from the production line when the process was 40% complete as to conversion costs because they had been damaged as a result of a malfunction during the sewing operation. This malfunction was considered an unusual occurrence, so the spoilage was classified as abnormal. Defective (spoiled) units are not reprocessed and have zero salvage value. The WIP inventory on October 31 consisted of 700 belts that were 50% complete as to conversion costs.
The costs charged to production during October were as follows:
|
Leather strips |
$20,600 |
|
Buckles |
4,550 |
|
Conversion costs |
20,700 |
|
Total |
$45,850 |
Required:
a. What are the EUP for the leather strips for October?
b. What is the cost per EUP for the buckles?
c. What are the total production costs to account for in October?
d. What is the total cost per EUP?
e. What is the total cost of normal spoilage?
f. What is the total ending WIP inventory cost?
g. What is the average cost per unit for finished goods?
h. If the 300 defective belts (normal spoilage) were reworked and management wanted to be sure that the incremental costs did not exceed the cost of producing new units, how would the rework costs be accounted for? [CMA adapted]
6.67 Weighted-average method, normal spoilage, and abnormal spoilage. APCO Company manufactures various lines of bicycles. Because of the high volume of each type of product, the company employs a process cost system using the WA method to determine unit costs. Bicycle parts are manufactured in the Molding Department and transferred to the Assembly Department, where they are partially assembled. After assembly, the bicycles are sent to the Packing Department.
Cost per unit data for the 20-inch dirt bike has been completed through the Molding Department. Annual cost and production figures for the Assembly Department are as follows:
|
|
Production Data |
|
|
|
Beginning inventory |
3,000 units (100% complete as to transferred in; 100% complete as to assembly materials; 80% complete as to conversion, DL + OH) |
||
|
Transferred in during year |
45,000 units (100% complete as to transferred in)
|
||
|
Transferred out to Packing during year |
40,000 units |
|
|
|
Ending inventory |
4,000 units (100% complete as to transferred in; 50% complete as to assembly materials; 20% complete as to conversion) |
||
|
|
|
|
|
|
|
Cost Data Transferred In |
Direct Materials |
Conversion Costs |
|
Beginning inventory |
$ 82,200 |
$ 6,660 |
$ 11,930 |
|
Current period |
1,237,800 |
96,840 |
236,590 |
|
Totals |
$1,320,000 |
$103,500 |
$248,520 |
Defective bicycles are identified at an inspection point when the assembly process is 70% complete; all assembly materials have been added by this point of the process. The normal rejection percentage for defective bicycles is 5% of the bicycles reaching the inspection point. Any defective bicycles over and above the 5% quota are considered as abnormal. All defective bikes are removed from the production process.
Required:
a. Compute the number of defective bikes considered to be:
1 A normal amount of defective bikes.
2 An abnormal amount of defective bikes.
b. Compute the weighted-average EUP for the year for:
1 Bicycles transferred in from the Molding Department.
2 Bicycles produced with regard to assembly material.
3 Bicycles produced with regard to assembly conversion.
c. Compute the cost per equivalent unit for the fully assembled dirt bike.
d. Compute the amount of the total production cost of $1,672,020 that will be associated with the following items:
1 Normal defective units.
2 Abnormal defective units.
3 Good units completed in the Assembly Department.
4 Ending WIP inventory in the Assembly Department.
e. Describe how the applicable dollar amounts for the following items would be presented in the financial statements:
1 Normal defective units.
2 Abnormal defective units.
3 Completed units transferred to the Packing Department.
4 Ending WIP inventory in the Assembly Department.
f. Discuss some potential reasons why spoilage might occur in this company. Which of these reasons would you consider important enough to correct and why? How might you attempt to correct these problems? [CMA adapted]
6.68 Inventory costing using the WA and FIFO methods. In attempting to verify the costing of the December 31, 20x4, inventory of WIP and finished goods recorded on Spirit Corporation's books, the auditor finds:
|
Finished goods, 200,000 units |
$1,009,800 |
|
Work-in-process, 300,000 units, 50% complete as to labor and factory overhead |
660,960 |
Materials are added to production at the beginning of the manufacturing process, and factory overhead is applied at the rate of 60% of direct labor cost. Spirit's inventory cost records disclosed zero finished goods on January 1, 20x4, and the following additional information for 20x4:
|
|
Units |
Direct Materials cost |
Direct Labor Cost |
|
Work-in-process, January 1 |
|
|
|
|
(80 percent complete as to labor and factory overhead) |
200,000 |
$ 200,000 |
$ 315,000 |
|
Units started in production: |
1,000,000 |
|
|
|
Materials cost |
|
$1,300,000 |
|
|
Labor cost |
|
|
$1,995,000 |
|
Units completed |
900,000 |
|
|
Required:
a. What are the EUP for labor under the WA method?
b. What are the EUP for labor under the FIFO method?
c. What is the unit cost for overhead using the WA method?
d. What is the unit cost for overhead using the FIFO method?
e. What is the cost per EUP for labor using the WA method?
f. What is the cost per EUP for labor using the FIFO method?
g. What is the total cost for the ending inventory of finished goods using the WA method?
h. What is the cost assigned to the 300,000 units in ending WIP inventory using the WA method?
i. What is the cost of finished goods in ending inventory per the books?
j. Prepare the necessary journal entry to state the WIP and finished goods inventories correctly, using the WA method. [AICPA adapted]
6.69 Comprehensive problem. Ballinger Paper Products manufactures a high-quality paper box. The Box Department applies two separate operations-cutting and folding. The paper is first cut and trimmed to the dimensions of a box form by one machine group. One square foot of paper is equivalent to four box forms. The trimmings from this process have no scrap value. Box forms are then creased and folded (i.e., completed) by a second machine group. Any partially processed boxes in the department are cut box forms that are ready for creasing and folding. These partially processed boxes are considered 50% complete as to labor and overhead.
During June, the Materials Department purchased 1,210,000 square feet of unprocessed paper for $244,000. Conversion costs (DL + OH) for the month were $226,000. A quantity equal to 30,000 boxes was spoiled during paper cutting, and 70,000 boxes were spoiled during folding. All spoilage has a zero salvage value, is considered abnormal, and cannot be reprocessed. Ballinger applies the WA method to all inventories. Inventory data for June follow:
|
Inventory |
June 1 |
June 30 |
||
|
Physical Units |
Units On Hand |
Cost |
Units On Hand |
|
|
Materials Department: paper |
square feet |
390,000 |
$76,000 |
200,000 |
|
Box Department: boxes cut, not folded |
number |
800,000 |
55,000* |
300,000 |
|
Finished goods: completed boxes |
number |
250,000 |
18,000 |
50,000 |
*$35,000 materials + $20,000 conversion costs.
Required (round unit costs to the nearest cent):
a. What is the cost of paper available in June?
b. What is the number of units transferred out of the Materials Department?
c. What is the cost of units transferred out of the Materials Department?
d. What is the number of units transferred out of the Box Department?
e. What is the total number of units transferred from finished goods to cost of goods sold?
f. What is the number of EUP for direct materials and conversion costs, respectively, for the Box Department under the WA method?
g. What is the number of EUP for direct materials and conversion costs, respectively, for the Box Department under the FIFO method?
h. What are the unit direct materials and conversion costs, respectively, assuming the WA method for June for the Box Department?
i. What is the total unit cost for June for the Box Department?
j. What are the number of total completed units and their material costs, respectively, for the Box Department?
k. What are the total completed units and their conversion costs, respectively, in the Box Department?
1. How many units are available in finished goods, and what is their cost?
m. What is the unit cost for finished goods?
n. What is the cost of units sold for June? [AICPA adapted]
6.70 Joint costs. [AICPA adapted] In its three departments, Amaco Chemical Company manufactures several products:
1. In Department 1, the raw materials amanic acid and bonyl hydroxide are used to produce Amanyl, Bonanyl, and Am-Salt. Amanyl is sold to others who use it as a raw material in the manufacture of stimulants. Bonanyl is not salable without further processing. Although Am-Salt is a commercial product for which there is a ready market, Amaco does not sell this product, preferring to submit it to further processing.
2. In Department 2, Bonanyl is processed into the marketable product, Bonanyl-X. The relationship between Bonanyl used and Bonanyl-X produced has remained constant for several months.
3. In Department 3, Am-Salt and the raw material Colb are used to produce Colbanyl, a liquid propellant that is in great demand. As an inevitable part of this process, Demanyl is also produced. Demanyl was discarded as scrap until it was discovered that it is useful as a catalyst in the manufacture of glue; for two years, Amaco has been able to sell all of its production of Demanyl.
In its financial statements, Amaco states inventory at the lower of cost (on the FIFO basis) or market. Unit cost of the items most recently produced must therefore be computed. Costs allocated to Demanyl are computed so that after allowing for packaging and selling cost of $0.04 per pound, no profit or loss will be recognized on sales of this product. Certain data for October 20x2 follow:
|
Raw Materials |
|
|
|
|
Pounds Used |
Total Cost |
|
Amanic acid |
6,300 |
$5,670 |
|
Bony] hydroxide |
9,100 |
6,370 |
|
Colb |
5,600 |
2,240 |
|
Conversion Costs (Labor And Overhead) |
|
|
|
Total Cost |
|
Department 1 Department 2 Department 3 |
$33,600 3,306 22,400 |
|
PRODUCTS |
|
|
|
Pounds Produced |
Inventories (Pounds) |
Sales Price Per Pound |
|
|
September 30 |
October 31 |
|||
|
Amanyl |
3,600 |
|
|
$ 6.65 |
|
Bonanyl |
2,800 |
210 |
110 |
|
|
Am-Salt |
7,600 |
|
|
6.30 |
|
Bonanyl-X |
2,755 |
|
|
4.20 |
|
Colbanyl |
1,400 |
|
|
43.00 |
|
Demanyl |
9,800 |
|
|
.54 |
Required:
Prepare the following schedules for October 20x2. Supporting computations should be prepared in good form. Round answers to the nearest cent.
a. Cost per pound of Amanyl, Bonanyl, and Am-Salt produced using the WA method.
b. Cost per pound of Amanyl, Bonanyl, and Am-Salt produced using the relative sales value method.
c. Cost per pound of Colbanyl produced. Assume that the cost per pound of Am-Salt produced was $3.40.
6.71 Joint costs. Multiproduct Corporation is a chemical manufacturer that produces two main products (Pepco-1 and Repke-3) and a by-product (SE-5) from a joint process. If Multiproduct had the proper facilities, it could process SE-5 further into a main product. The ratio of output quantities to input quantity of direct materials used in the joint process remains consistent with the processing conditions and activity level.
Multiproduct currently uses the physical method of allocating joint costs to the main products. The FIFO inventory method is used to value the main products. The by-product is inventoried at its net realizable value, and the net realizable value of the by-product is used to reduce the joint production costs before the joint costs are allocated to the main products.
Jim Simpson, Multiproduct's controller, wants to implement the relative sales value method of joint cost allocation. He believes that inventoriable costs should be based on each product's ability to contribute to the recovery of joint production costs. The net realizable value of the by-product would be treated in the same manner as with the physical method.
Data regarding Multiproduct's operations for November 20x6 follow:
|
|
Main Products |
By-product |
|
|
PEPCO-1 |
REPKE-3 |
SE-5 |
|
|
Finished goods inventory in gallons on November 1, 20x6 |
20,000 |
40,000 |
10,000 |
|
November sales in gallons |
800,000 |
700,000 |
200,000 |
|
November production in gallons |
900,000 |
720,000 |
240,000 |
|
Sales value per gallon at split-off point |
$2.00 |
$1.50 |
$0.55 * |
|
Additional processing costs after split-off |
$1,800,000 |
$720,000 |
- |
|
Final sales value per gallon |
$5.00 |
$4.00 |
- |
*Disposal and selling costs of $0.05 per gallon will be incurred to sell the by-product.
The joint production costs amounted to $2,640,000 for November 20x6.
Required:
a. Describe the relative sales value method, and explain how it accomplishes Jim Simpson's objective.
b. Assuming Multiproduct Corporation adopts the relative sales value method for internal reporting purposes:
1. Calculate how the joint production cost for November 20x6 would be allocated.
2. Determine the dollar values of the finished goods inventories for Pepco-1, Repke-3, and SE-5 as of November 30, 20x6.
c. Multiproduct Corporation plans to expand its production facilities to enable it to further process SE-5 into a main product. Discuss how the allocation of the joint production costs under the relative sales value method will change when SE-5 becomes a main product.
6.72 Distinguish between joint costs and other costs and discuss allocation methods. The Harbison Company manufactures two sizes of plate glass, which are produced simultaneously in the same manufacturing process. Since the small sheets of plate glass are cut from large sheets that contain flaws, the joint costs are allocated equally to each good sheet, large and small, produced. The difference in after-split-off costs for large and small sheets is material.
In 20x1, the company decided to increase its efforts to sell the large sheets because they produce a larger gross margin than the small sheets. Accordingly, the amount of the fixed advertising budget devoted to large sheets was increased, and the amount devoted to small sheets was decreased. No changes in sales prices were made, however.
By mid-year, the production scheduling department had increased the monthly production of large sheets in order to stay above the minimum inventory level. However, it also had cut back the monthly production of small sheets because the inventory ceiling had been reached.
At the end of 20x1, the net result of the change in product mix was a decrease of $112,000 in gross margin. Although sales of large sheets had increased 34,500 units, sales of small sheets had decreased 40,200 units.
Required:
a. Distinguish between joint costs and each of the following:
1. After-split-off costs.
2. Fixed costs.
3. Prime costs.
4. Indirect costs.
b. Discuss the propriety of allocating joint costs for general-purpose financial statements on the basis of:
1 Physical measures, such as weights or units.
2 Relative sales or market value.
c. In developing weights for allocating joint costs to joint products, why is the relative sales value of each joint product usually reduced by its after-split-off costs?
d. Identify the mistake that the Harbison Company made in deciding to change its product mix, and explain why the change caused a smaller gross margin for 20x1.
6.73 Allocation of joint costs. Doe Corporation grows, processes, cans, and sells three main pineapple products--sliced pineapple, crushed pineapple, and pineapple juice. The outside skin is cut off in the Cutting Department and processed as animal feed. The skin is treated as a by-product. Doe's production process is as follows:
Pineapples first are processed in the Cutting Department. The pineapples are washed, and the outside skin is cut away. Then the pineapples are cored and trimmed for slicing. The three main products (sliced, crushed, juice) and the by-product (animal feed) are recognizable after processing in the Cutting Department. Each product is then transferred to a separate department for final processing.
The trimmed pineapples are forwarded to the Slicing Department where they are sliced and canned. Any juice generated during the slicing operation is packed in the cans with the slices.
The pieces of pineapple trimmed from the fruit are diced and canned in the Crushing Department. Again, the juice generated during this operation is packed in the can with the crushed pineapple.
The core and surplus pineapple generated from the Cutting Department are pulverized into a liquid in the Juicing Department. An evaporation loss equal to 8% of the weight of the good output produced in this department occurs as the juices are heated.
The outside skin is chopped into animal feed in the Feed Department.
Doe Corporation uses the net realizable value (relative sales value) method to assign costs of the joint process to its main products. The by-product is inventoried at its market value.
A total of 270,000 pounds entered the Cutting Department during May. Processing data and costs for May are summarized in the following schedule:
|
May Processing Data And Costs |
|||
|
Department |
Costs Incurred |
Proportion Of Product By Weight Transferred To Departments |
Selling Price Per Pound Of Final Product |
|
Cutting |
$60,000 |
- |
None |
|
Slicing |
4,700 |
35% |
$.60 |
|
Crushing |
10,580 |
28 |
.55 |
|
Juicing |
3,250 |
27 |
.30 |
|
Animal feed |
700 |
10 |
.10 |
|
Total |
$79,230 |
100% |
|
Required:
a. How many net pounds of pineapple juice were produced in May?
b. What is the net realizable value of pineapple slices at the split-off point?
c. What is the total amount of separable costs for the three main products?
d. What is the total amount of joint costs for the Cutting Department to be signed to each of the three main products in accordance with Doe's policy?
e. How much of the joint costs is allocated to crushed pineapple?
f. What is the gross margin for the pineapple juice?
6.74 Complex EUP calculations. Lovers Delight makes speciality candies. One of its products, a heart-shaped lollipop containing two secret centers and sticks, is manufactured within three departments. Department 1 makes secret centers. Department 2 inserts the secret centers into a candy mold and adds a powered candy mix, heating and cooling it to produce a hard candy, inspecting it, and then inserting the sticks. Department 3 wraps and boxes the lollipops.
The following information is available about the production process, units worked on, and costs for Department 2 during the month of April:
• Direct material 1: Secret centers transferred in from Department I are all added at the start of production.
• Direct material 2: 15% of the materials (candy mix) added within Department 2 are input uniformly over the first 30% of processing. Another 60% is added uniformly until processing is 60% complete. The last 25% of materials added (sticks) occurs over the last 40% of processing.
• Direct labor: All of the direct labor is incurred uniformly throughout the first 80% of processing.
• Overhead: Overhead items are added uniformly throughout the entire process.
Quality control inspection: Lollipops are inspected at the 72% completion point. A reject rate of 5% of the units inspected is considered normal.
|
Data Section: |
|
|
|
|
Units |
DM Trans In DM Added DL Added Applied OH |
|
Beg Wip Inv |
10 |
|
|
Beg % Complete |
20% |
(Beginning WIP Inventory is 20% down the assembly line) |
|
Units Started |
120 |
|
|
End Wip Inv |
20 |
|
|
End % Complete |
50% |
(Ending WIP Inventory is 50% down the assembly line) |
|
Units Completed |
80 |
|
Required:
a. Calculate EUP assuming a FIFO cost flow.
b. Calculate EUP assuming a WA cost flow.