Chapter 9 : The Need For Multiple Overhead Accounts
LEARNING OBJECTIVES
After studying this chapter, you should be able to:
1. Discuss the need for multiple overhead accounts within WIP.
2. Describe how the general ledger system for WIP can be designed to provide more accurate product cost information and cost management information.
3. Explain how to allocate service department costs to production departments, and describe the different methods that can be used.
4. Design an SCAS that includes cost variances for both production and service departments.
INTRODUCTION
As Chapter 4 pointed out, all CASs satisfy one overall goal, to determine the cost of products or services. The cost of a product or service is used for many purposes:
• Evaluate how well the organization is doing relative to its budget
• Facilitate continuous improvement
• Derive the value of inventory and cost of goods manufactured and sold for financial reporting
• Value inventory for taxation
• Price products or bid on contracts for various jobs
• Determine product or job profitability
• Decide whether to make or buy certain components
Contrary to popular belief, there is no such thing as the one “true product cost.” All product and service costs are based on assumptions, estimates, allocations, and averages. It is up to the management accountant to choose the costing procedures that best fit the production system and management's need for cost control, and then aim for costs that are approximately accurate. Remember the “relevancy” attribute of high-quality information from Chapter 1: “It's more important to be approximately right than precisely wrong.”
The purpose of this chapter is to provide the theory and tools necessary for designing more sophisticated CASs to account for overhead. If all costs could be directly traced to individual products, the “true cost” of the products would be known and objectively measurable. However, all costs are not directly traceable. As manufacturers become more capital intensive (automated), the proportion of indirect costs (overhead) increases. Accounting for overhead is the albatross around the management accountant's neck.
Many traditional manufacturers still maintain only one total overhead account and one plantwide TOH POR to apply all the overhead into jobs (JOCAS) or production departments (PCAS). The need for separate VOH and FOH subsidiary WIP accounts when budgeting overhead for the standard cost card and manufacturing cost equation was discussed in Chapter 7. In this chapter, the VOH and FOH accounts within WIP become control accounts. The CAS design issues involved will be identified in the following order:
• Within VOH and FOH, separate subsidiary overhead accounts will be created for each production department.
• Service department costs will be identified, and separate VOH and FOH accounts created for each service department. Service departments provide services to production departments.1 Because their costs are not directly traceable to products, they are part of the plant's total overhead.
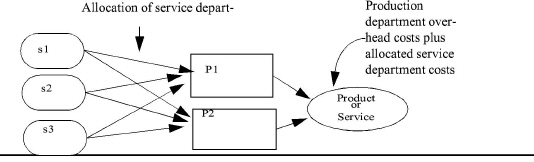
• For service department costs to be included in the cost (and the sales price) of products, they have to be allocated to the production departments' VOH and FOH accounts. This means that two sets of overhead allocations have to be made. First, service department costs are allocated into the overhead accounts of production departments. Second, the production departments' overhead, which now includes the service department costs, is allocated (applied) to the products. This is illustrated in Exhibit 9-1.2Different methods for making the first set of allocations (service department-to-production overhead accounts) will be examined.
• Finally, cost variances are designed into the CAS for better cost management information.
|
|
PLANTWIDE VERSUS MULTIPLE PREDETERMINED OVERHEAD RATES
LEARNING OBJECTIVE
Discuss the need for multiple overhead accounts within WIP
The management accountant can develop a single plantwide TOH POR. Or, instead of using one plantwide blanket rate, the TOH POR may be subdivided into two or more component PORs. The following examples demonstrate both situations.
Plantwide Total Predetermined Overhead Rate
Assume that Cerro Company makes only one product and uses one TOH POR for the entire plant's overhead, rather than separate rates for VOH and FOH costs. Cerro estimates 100,000 machine hours as the level of activity, $340,000 VOH costs, and $400,000 FOH costs. The single plantwide TOH POR for Cerro is calculated as follows:
|
Total estimated VOH costs |
$340,000 |
|
|
Total estimated FOH costs |
$ 400,000 |
|
|
Estimated TOH costs |
$ 740,000 |
|
|
Divided by estimated level of activity in machine hours |
100,000 |
Mhr |
|
Single plantwide TOH POR per machine hour |
$7.40 |
|
For each machine hour used during the period on a job (JOCAS) or in a production department (PCAS), the TOH POR will apply $7.40 of overhead to the products in journal entry 7.
Multiple Predetermined Overhead Rates
In a simple one-product company such as Cerro's, a single plantwide TOH POR may be sufficient. In highly diversified companies, a single plantwide TOH POR may result in misinformation that leads to wrong decisions, Therefore, the goals in subdividing the TOH POR are to provide more useful cost management information and more accurate product or service costing. The TOH POR can be subdivided in a number of different ways:
• Separate rates for applying VOH and FOH
• Separate rates for each production department
• Separate rates for different machines
• Separate rates for each product line or service class
• Separate rates for applying material-related, labor-related, and machine-related overhead costs
In deciding whether to use multiple PORs, the management accountant should analyze both the operations and the kinds of products made or services performed:
• When there are important differences in the nature of the work performed in different areas of the plant, separate PORs for these areas, such as departments, JIT cells, and/or machines, should be used.
• When significantly different products or services use resources in different ways, separate PORs should be used for each product or service.
• When products differ substantially in their relative use of direct materials, a more accurate allocation of materials-related overhead costs (such as purchasing, receiving, storing, and handling) may result from using a materials-related POR.
• In special situations, similar arguments can be made for using separate PORs for applying different labor-related and machine-related overhead.
Departmental Overhead Rates
Normally, however, the best way to begin designing the overhead accounting system is to set up separate PORs for production departments. No matter how diverse the products or services, they will receive a fairer share of the overhead if separate production department PORs are used. For example, if product x flows through three departments, it will be charged its appropriate share of overhead costs within each department, assuming a proper activity application base is chosen. If product Y flows through two departments, it likewise will be charged its appropriate share of overhead costs from only these departments.
Indeed, the management accountant can use various combinations. The aim is to search for the most accurate basis for applying overhead costs to products or services. But there is a practical limit to the extent overhead rates can be subdivided. At some point, further subdivision leads to an insignificant change in product or service costs and does not provide more useful cost management information. Each company must decide on the number of overhead rates after experimenting with different methods. A balance should be struck between the need for more detailed accuracy on the one side and the time and cost of preparing and applying multiple overhead rates on the other side. The accompanying Starfire Company case on the next page illustrates the differing results from using departmental PORs versus a single plantwide overhead rate.
What is learned from the Starfire case?
• If departmental TOH PORs are used, the applied overhead costs more closely reflect the different amounts and types of machine and labor work performed on the two products.
• If a plantwide TOH POR based on machine hours is used, too much of the Painting Department's overhead is applied to car bodies and too little to truck bodies. Labor usage causes Painting Department overhead. Car bodies require only 4 hours of painting labor, while truck bodies require 14 hours. In other words, less Painting Department overhead should be included in the cost of a car body than in the cost of a truck body. But, when machine hours are used to apply overhead, the opposite situation results. Applying overhead based on machine hours results in 12 machine hours worth of overhead being applied to car bodies and only 5 machine hours worth of overhead being applied to truck bodies. Thus, more Painting Department overhead is applied to car bodies than to truck bodies.
• An even more serious miscosting occurs when the plantwide TOH POR is based on direct labor hours. The majority of the plant's overhead is caused by machine usage in the Assembly Department. Car bodies require 12 machine hours whereas truck bodies only require 5 machine hours. Obviously, more Assembly Department overhead should be applied to car bodies than to truck bodies. However, since car bodies require less direct labor hours of work than do truck bodies, less overhead is applied to car bodies than to truck bodies!
|
Insights and Applications Starfire Company's Use of Departmental versus. Plantwide Overhead Rates Starfire has two production departments: Assembly and Painting. Assembly work is performed by robots, and depreciation, utilities, and maintenance make up a large part of this department's overhead costs. Painting and special detail work are performed manually by skilled workers.
|
Starfire makes two products: fiberglass bodies for its Starfire miniature automobile and for its customized miniature truck line. Car bodies require 12 machine hours in Assembly and 4 direct labor hours in Painting. Truck bodies require 5 machine hours in Assembly and 14 direct labor hours in Painting. Total budgeted overhead is $800,000 for the Assembly Department and $177,500 for the Painting Department. Departmental and plantwide POR calculations follow: |
|
|
Assembly Department |
Painting Department |
|
Estimated annual overhead |
$800,000 |
$177,500 |
|
Estimated annual direct labor hours (DLhr) |
-0- |
50,000 |
|
Estimated annual machine hours (Mhr) |
80,000 |
5,000 |
|
|
|
|
|
Departmental TOH PORs: |
|
|
|
Assembly: $800,000 - 80,000 Mhr = $10.00 per Mhr |
|
|
|
Painting: $177,500 - 50,000 DLhr = $ 3.55 per DLhr |
|
|
|
|
|
|
|
Total plantwide overhead costs: $800,000 + $177,500 = $977,500 |
|
|
|
Plantwide overhead rate using Mhr:$977,500 / 85,000 Mhr = $11.50 per Mhr Plantwide overhead rate using DLhr: $977,500 / 50,000 DLhr = $19.55 per DLhr |
|
|
|
OVERHEAD APPLIED: |
CAR BODIES |
|
TRUCK BODIES |
|
|
Using departmental overhead rates: Assembly |
$10.00 x 12 Mhr = |
$120.00 |
$10.00 x 5 Mhr = |
$ 50.00 |
|
Painting |
$ 3.55 x 4 DLhr = |
14.20 |
$ 3.55 x 14 DLhr = |
$ 49.70 |
|
Totals |
|
$134.20 |
|
$ 99.70 |
|
Using plantwide overhead rates: Based on Mhr |
$11.50 x 12 Mhr = |
$138.00 |
$11.50 x 5 Mhr = |
$ 57.50 |
|
Based on DLhr |
$19.55 x 4 DLhr = |
$ 78.20 |
$19.55 x 14 DLhr = |
$273.70 |
|
The direct materials cost per unit for truck bodies is $100, and the direct labor cost is $ 50. Adding the various overhead amounts to these prime costs gives the total product cost under each method. The following calculations show the product costs and the profit or loss for truck bodies assuming a selling price of $300 per unit: |
|||
|
|
Departmental Rates |
Plantwide Rate (Mhr) |
Plantwide Rate (Dlhr) |
|
Direct materials |
$100.00 |
$100.00 |
$100.00 |
|
Direct labor |
50.00 |
50.00 |
50.00 |
|
Overhead |
99.70 |
57.50 |
273.70 |
|
Total cost |
<$249.70> |
<$207.50> |
<$423.70> |
|
Selling price |
300.00 |
300.00 |
300.00 |
|
Profit (loss) |
$ 50.30 |
$ 92.50 |
<$123.70> |
• Use of either plantwide TOH POR ignores the different causes of overhead in the two departments, as well as the different amounts of those activities used in each department. Using a machine hour base, too much Painting Department overhead is applied to car bodies, and too little to truck bodies. Car bodies are cross-subsidizing truck bodies. When a direct labor base is used, though, truck bodies are cross-subsidizing car bodies. Truck bodies absorb some of the overhead that car bodies should have been charged. Cross-subsidization occurs when too much overhead is applied to one product, while too little is applied to other products.
Use of the product costs generated from plantwide TOH PORs may cause management to make wrong decisions about truck bodies (and car bodies). The product cost produced by a plantwide TOH POR based on machine hours will make management think that truck bodies are more profitable than the product line actually is. This belief may motivate management to employ more resources to produce more truck bodies, thereby diverting resources from other more profitable products.
If the plantwide TOH POR based on direct labor hours is used, management may think that truck bodies should be eliminated because this product line appears to be generating a significant loss. The more accurate product cost is generated by the departmental overhead rates because they more closely reflect truck bodies' utilization of different overhead resources in each department. Thus, decisions based on the product costs produced by the departmental overhead rates should be better decisions.
Predetermined Variable and Fixed Overhead Rates
To support management analysis of overhead costs, it is usually desirable to calculate two PORs, a variable overhead (VOH) rate and a fixed overhead (FOH) rate. Generally, separate VOH and FOH rates provide managers with more useful information than just developing one TOH POR for VOH and FOH costs combined. Budgeting separate VOH and FOH PORs was introduced in Chapter 7. The last section of this chapter will illustrate an allocation method using separate VOH and FOH PORs.
Many traditional CASs were designed primarily for financial reporting needs. Cost management information was viewed as less important. With respect to accounting for overhead, just one TOH subsidiary account was designed into the WIP general ledger system. Overhead costs were debited into this account in journal entries 4, 5, and 6. Overhead was applied to products in total using one plantwide TOH POR in journal entry 7. This type of overhead accounting was illustrated for a basic CAS in Chapter 4 (Exhibit 4-2), for a JOCAS in Chapter 5 (Exhibit 5-1), and for a PCAS in Chapter 6 (Exhibit 6-4). Similarly, the Starfire Company example above, which illustrated separate overhead accounts for each production department, did not have separate VOH and FOH accounts within the departments.
In the discussion that follows, VOH and FOH will not be separated to avoid overly complicating the calculations. Furthermore, the techniques that follow are usually used with total overhead on professional accounting certification exams. Nevertheless, even though the VOH and FOH accounts are not separate in the CAS examples that follow, their separation is important for standard cost card calculations and overhead budgeting, as well as in cost control through four-way overhead cost variance analysis.
Service Department PORs
Learning
Objective 2
Describe how the general ledger system for WIP can be designed to provide more accurate product cost information and cost management information.
Production departments (also called operating departments, cells, or workcenters) are where the central purposes of the organization are carried out. Examples include the surgery department in a hospital, the shoe department in a retail store, and the assembly department in a manufacturing enterprise.
Service departments, by contrast, do not engage directly in production activities. Rather, they provide assistance and support that facilitate the activities of the production departments. Examples include the human resources department, purchasing, storeroom, maintenance, computing center, engineering, internal auditing, and cafeteria. Although service departments do not engage directly in the producing activities of the organization, their costs are part of the cost of manufacturing products or providing services.
Because service department costs cannot be directly traced to products being manufactured or services (for the customer) performed by the company, these costs must be allocated to the production departments' overhead accounts. The service department costs then become part of the budgeted overhead costs of the production departments. In this manner, they are included with the other overhead costs of the production department in calculating the departmental TOH POR. In total, these “all-inclusive” departmental PORs, therefore, ultimately apply all the plant's overhead to the products when the PORs are used in the overhead application journal entry 7.
This type of CAS design results in a three-stage overhead allocation process:
• Stage one: Overhead cost assignments. As overhead costs are incurred, they are debited to the proper service and production department overhead accounts. This is called primary cost assignment. Some costs can be directly traced to each service department and production department, including the following:
1 Salaries, employment taxes, and fringe benefits of the production department foremen and managers of the service departments
2 Indirect materials requisitioned by production departments and all materials used by service departments
3 Depreciation of machinery within production departments and other equipment, furniture, and fixtures of service departments
4 Wages, employment taxes, and fringe benefits of workers within service departments
Stage one primary cost assignment directly traces costs to service departments. It also directly traces as many VOH and FOH costs as is possible to the production departments. These are properly considered direct costs to the departments even though they may be indirect (overhead) costs with respect to individual products. A cost element can be directly traceable to one cost object (such as a department) and still be an indirect cost with respect to another cost object (such as a job). Thus, these costs are labelled as direct VOH costs (DVOH) and direct FOH costs (DFOH).
Stage two: Service department overhead cost allocations. Once overhead costs are accumulated in the service and production department overhead accounts within WIP, the service department costs can be allocated to the production department overhead accounts so that they can be included in the departmental TOH PORs. This is called secondary cost allocation. The management accountant must use a reasonable allocation base for secondary cost allocations. The allocation base for each service used must bear a relationship to the costs of the services being rendered. Ideally, this is a cause-and-effect relationship. If, for example, the costs of operating the human resources department tend to vary with the number of people employed, this service department's costs can be allocated according to the number of employees working in each production department. As another example, the purchasing department's costs may be allocated to production department overhead accounts on the basis of the number of purchase orders processed for each producing department. Some common bases used in allocating service department costs are presented in Exhibit 9-2.
|
Exhibit 9-2 Possible Stage-Two Allocation Bases for Service Department |
|
|
Service Departments |
Possible Allocation Bases |
|
Cafeteria |
Number of employees |
|
Medical infirmary |
Periodic survey of cases handled, number of employees |
|
Airport ground services |
Number of flights |
|
Occupancy services |
Square footage |
|
Materials handled |
Volume handled, number of requisitions |
|
Power |
Kilowatt hours used, number of machines |
|
Computing center |
Number of reports, computer time |
|
Human resources |
Number of employees, turnover of labor, periodic survey of time spent |
|
Custodial |
Square footage |
|
Repairs and maintenance |
Number of machines, number of repair calls |
|
Laundry |
Pounds of laundry, number of items processed |
• Stage three: Overhead cost application. Finally, once the overhead costs are accumulated in the proper overhead accounts (stage one), and service department costs allocated to production department overhead accounts (stage two), the departmental PORs can be developed for applying overhead to the products (stage three). As with secondary cost allocations, the management accountant must choose a basis for the PORs, hopefully derived from a cause-and-effect relationship between the department's overhead cost incurrence and the products made. Choosing the proper basis for the POR was discussed in Chapter 7 as part of preparing the standard cost card lines for VOH and FOR.
In summary, any overhead costs that can be specifically associated with a production or service department should be directly assigned to it. For example, the costs of computer supplies are charged directly to the computing center. Lease payments on computer equipment also are charged directly to the computing center. Food costs are charged directly to the cafeteria.
The service department costs should be allocated according to some measure that has a cause-and-effect or benefit relationship. Thus, such items as building depreciation, insurance, and taxes are commonly allocated on the basis of square feet of floor space occupied. Plant heating and cooling costs may be allocated on cubic feet of space occupied. Costs of lighting may be allocated on the basis of kilowatt hours. inspection costs may be allocated on the basis of direct labor hours and so on.
Stage two allocates all overhead to production department overhead accounts. In stage three, overhead is applied from the production department overhead accounts to the products produced or services rendered by the company, using departmental PORs. Refer to Exhibit 9-1 to verify this.
METHODS OF PERFORMING SERVICE DEPARTMENT SECONDARY COST ALLOCATIONS
Learning
Objective 3.
Explain how to allocate service department costs to production departments, and describe the different methods that can be used.
Four common methods exist for allocating service department costs to production department overhead accounts. The first three methods are illustrated here, assuming there is one total overhead account for each service department and production department. The fourth method, illustrated in the next section of this chapter, uses separate VOH and FOH accounts for each service and production department. The first three methods discussed, in order of increasing sophistication, are as follows:
• Direct method
• Step method
• Reciprocal method
The Direct Method
The direct method is widely used for allocating service department costs. This method allocates each service department's total costs directly to the production departments' overhead accounts. This method's major weakness is that it ignores any service rendered by one service department to another. For example, Birchtree Manufacturing makes white-water rafting products such as canoes, kayaks, and rafts. These products are made in two production departments, Assembly and Finishing. The plant has four service departments, each with its own subsidiary ledger account within WIP-Manufacturing Overhead. These services include the Human Resources Department, Occupancy Services, the Computing Center, and the Engineering Department.
Obviously, each of the four service departments occupies space and should be allocated some occupancy costs (building depreciation, property taxes and insurance, heating and air conditioning, and so forth). The Human Resources and Engineering Departments also use computer services. To determine the “real costs” of each service more accurately, inter-service department cost allocations should be made. The Human Resources Department's cost should include some allocation of Occupancy Services costs and Computing Center costs. The direct method, however, ignores this inter-service department usage in determining the costs of each service allocated in stage two, secondary cost allocations.
With the direct method, the primary costs of operating each service department are allocated directly to the production departments. This method is the simplest and quickest way to allocate service costs. The number of secondary cost allocations is equal to the number of service departments. Exhibit 9-3 illustrates the direct method cost allocation worksheet. Each department's primary costs are shown as the first line. The secondary cost allocations to production departments are made using the following bases:
|
DEPARTMENT |
ALLOCATION BASE |
PERCENTAGE |
SERVICE DEPARTMENT ALLOCATION |
|
Human Resources |
Budgeted payroll: |
|
|
|
Assembly |
$60,000 |
75% |
$165,000 |
|
Finishing |
20,000 |
25% |
55,000 |
|
Total |
$80,000 |
100% |
$220,000 |
|
Occupancy Services |
Square feet: |
|
|
|
Assembly |
14,000 square feet |
70% |
$105,000 |
|
Finishing |
6,000 square feet |
30% |
45,000 |
|
Total |
20,000 square feet |
100% |
$150,000 |
|
Computing Center |
Expected reports: |
|
|
|
Assembly |
40 reports |
40% |
$ 72,000 |
|
Finishing |
60 reports |
60% |
108,000 |
|
Total |
100 reports |
100%, |
$180,000 |
|
Engineering |
Budgeted machine hours: |
|
|
|
Assembly |
2,000 machine hours |
80% |
$ 80,000 |
|
Finishing |
500 machine hours |
20% |
20,000 |
|
Total |
2,500 machine hours |
100% |
$100,000 |
The budgeted Human Resources cost of $220,000 is allocated to Assembly and Finishing on the basis of 75 percent and 25 percent, respectively, using
|
Exhibit 9-3 Cost Allocation Worksheet for the Direct Method |
||||||||
|
|
Birchtree Manufacturing Allocation of Service Department Costs |
|
|
|||||
|
|
|
Service Departments |
|
|
Production Departments |
|
||
|
|
Human Resources |
Occupancy Services |
Computing Center |
Engineering |
|
Assembly |
Finishing |
Total |
|
Stage one primary cost assignment: Total DVOH and DFOH Costs |
$220,000 |
$150,000 |
$180,000 |
$100,000 |
|
$170,000 |
$ 50,000 |
$870,000 |
|
Stage two service department cost allocations: |
|
|
|
|
|
|
|
|
|
Human Resources |
<220,000> |
|
|
|
|
$165,000 |
$ 55,000 |
|
|
Occupancy Services |
|
<150,000> |
|
|
|
105,000 |
45,000 |
|
|
Computing Center |
|
|
< 180,000> |
|
|
72,000 |
108,000 |
|
|
Engineering |
|
|
|
<100,000> |
|
80,000 |
20,000 |
|
|
Total overhead costs allocated to production departments TOH accounts |
$ -0- |
$ -0- |
$ -0- |
$ -0- |
|
$592,000 |
$278.000 |
$870,000 |
|
Stage three overhead cost application: |
|
|
|
Budgeted Mhr |
2,000 Mhr |
|
|
Budgeted DLhr |
|
10,000 DLhr |
|
Departmental Toll PORs |
296.00 $/Mhr |
27.80 $/DLhr |
|
|
payroll dollars as the allocation base. Since the major purpose of Human Resources is to service employees, the Human Resources costs are allocated to these production departments on the basis of their payroll amounts.
Because Assembly occupies 14,000 square feet of the building versus 6,000 square feet occupied by Finishing, it seems equitable to allocate 70 percent ($105,000) of the budgeted occupancy costs to Assembly. Thirty percent ($45,000) of budgeted occupancy costs is allocated to Finishing.
The Computing Center expects to process 40 reports for Assembly and 60 reports for Finishing. So, 40 percent of the Computing Center's budgeted costs of $180,000 is allocated to Assembly and 60 percent to Finishing.
Management has determined that there is a cause-and-effect relationship between Engineering costs and machine hours. Therefore, 80 percent ($80,000) of Engineering's budgeted costs ($100,000) is allocated to Assembly. The remaining $20,000, or 20 percent, is allocated to Finishing.
The Step Method
Some companies use the step method, which allows for limited recognition of services rendered by service departments to other service departments. This method is more complex than the direct method because a sequence of allocations must be chosen. The sequence often begins with the department that renders the most services to other service departments. The sequence continues in a step-by-step fashion and ends with the allocation of the costs of the service department that renders the lowest percentage of its services to other service departments.
Where reciprocal (inter-service department) relationships exist, first allocate the service department providing the most service to the other service departments will generally result in the best step allocation. The deficiency in the step method is that it recognizes only one-way inter-service department use. Once a service department's costs are allocated to other service and production departments, a subsequent service department's costs are not allocated back to the original service. To illustrate, using the Birchtree Manufacturing example, the following order of service department allocations has been determined:
1 Human Resources
2 Computing Center
3 Occupancy Services
4 Engineering
Using this order, the Human Resources service is allocated first. Its costs are allocated to the remaining service centers and to the production departments. The Computing Center's costs are allocated next. These costs now include the primary costs of the Computing Center (from stage one) plus an allocation of Human Resources costs (from stage two). Human Resources, having already been allocated, does not receive an allocation of Computing Center costs even though it uses computing services. This means that the “real” total cost of Human Resources is understated because it does not include any Computer Center costs. To minimize this costing error from not making any “backward” allocations of subsequent service center costs to previous service centers, the biggest service is allocated first, with smaller services allocated subsequently.3 The cost allocation worksheet for the step method is illustrated in Exhibit 9-4.
The base used to allocate budgeted Human Resources costs is payroll dollars. The payroll dollars associated with the other departments, along with the amounts of Human Resources costs allocated to each department, are as follows:
|
DEPARTMENT |
BUDGETED PAYROLL |
|
PAYROLL PROPORTION |
|
AMOUNT TO BE ALLOCATED |
|
AMOUNT ALLOCATED |
|
|
|
x |
= |
||||
|
Computing Center |
$ 50,000 |
|
50/200 |
|
$220,000 |
|
$ 55,000 |
|
Occupancy Services |
40,000 |
|
401200 |
|
220,000 |
|
44,000 |
|
Engineering |
30,000 |
|
30/200 |
|
220,000 |
|
33,000 |
|
Assembly |
60,000 |
|
60/200 |
|
220,000 |
|
66,000 |
|
Finishing |
20,000 |
|
20/200 |
|
220,000 |
|
22,000 |
|
|
$200,000 |
|
200/200 |
|
|
|
$220,000 |
The step method allocates the $220,000 of budgeted Human Resources costs to each department using its services, regardless of whether the user is another service department or a production department. Thus, 25 percent ($55,000) of Human Resources costs is allocated to the Computing Center because it represents 25 percent ($50,000 = $200,000 shown in the Payroll Proportion column above) of Birchtree's budgeted factory payroll costs for the departments that are to receive an allocation under the step method.
The second department to have its costs allocated is the Computing Center. A reasonable base is computer time or number of reports. Because the reports all require about the same amount of work and the number of reports is easier to measure than computer time, number of reports is used as the allocation base. The expected number of reports for each department and their proportion of the total for the departments receiving an allocation of Computing Center costs under the step method, together with the amounts of budgeted Computing Center costs allocated to its users, follow:
|
Exhibit 9-4 Cost Allocation Worksheet for the Step Method |
|||||||
|
|
Birchtree Manufacturing Allocation of Service Department Costs |
|
|
||||
|
|
|
Service Departments Production Departments |
|
||||
|
|
Human Resources |
Computing Center |
Occupancy Services |
Engineering |
Assembly
|
Finishing |
Total |
|
Stage one primary cost assignment: |
|
|
|
|
|
|
|
|
Total DVOH and DFOH costs |
$220,000 |
$180,000 |
$150,000 |
$100,000 |
$170,000 |
$ 50,000 |
$870,000 |
|
Stage two service department cost allocations: |
|
|
|
|
|
||
|
Human Resources |
<220,000> |
55,000 |
44,000 |
33,000 |
66,000 |
22,000 |
|
|
|
|
235,000 |
|
|
|
|
|
|
Computing Center |
|
<235,000> |
47,000 |
164,500 |
9,400 |
14,100 |
|
|
|
|
|
241,000 |
|
|
|
|
|
Occupancy Services |
|
|
<241,000> |
41,000 |
140,000 |
60,000 |
|
|
|
|
|
|
338,500 |
|
|
|
|
Engineering |
|
|
|
<338,500> |
270,800 |
67,700 |
|
|
Total overhead costs allocated to production dept. TOH accounts |
$ -0- |
$ -0- |
$ -0- |
$ -0- |
$656,200 |
$213,800 |
$870,000 |
|
Stage three overhead cost application: |
|
|
|
|
|
|
|
|
Budgeted Mhr |
|
|
|
|
/ 2,000 Mhr |
|
|
|
Budgeted DLhr |
|
|
|
|
|
/ 10,000 DLhr |
|
|
Departmental TOH PORs |
|
|
|
|
$328.10/Mhr |
$21.38/DLhr |
|
|
|
|||||||
|
Department |
Number Of Reports |
Proportion |
x |
Amount To Be Allocated |
= |
Amount Allocated |
|
Human Resources |
100 |
n/a |
|
n/a |
|
n/a |
|
Occupancy Services |
200 |
200/1,000 |
|
$235,000 |
|
$ 47,000 |
|
Engineering |
700 |
700/1,000 |
|
235,000 |
|
164,500 |
|
Assembly |
40 |
40/1,000 |
|
235,000 |
|
9,400 |
|
Finishing |
60 |
60/1,000 |
|
235,000 |
|
14,100 |
|
Totals |
1,100 |
1,000/1,000 |
|
|
|
$235,000 |
Notice that the Human Resources Department receives computer reports. These reports are not included in the allocation proportions, however, because no Computing Center costs are allocated “backward” to Human Resources when using the step method.
The Occupancy Services costs are allocated next because this department provides more services to more departments than Engineering, the remaining service department. Occupancy Services costs are generally allocated on the basis of floor space occupied by the departments, although in some situations, a cubic measure may be more appropriate, such as for heating cost in a plant where ceilings are of varying heights. The square footage occupied by each department and the proportions for the departments receiving an allocation of occupancy costs, as well as the amount of budgeted Occupancy Services costs allocated to each, follow:
|
DEPARTMENT |
Area In Square Feet |
Proportion X |
Amount To |
= Amount |
|
Be Allocated |
Allocated |
|||
|
Human Resources |
1,000 |
n/a |
n/a |
n/a |
|
Computing Center |
900 |
n/a |
n/a |
n/a |
|
Engineering |
4,100 |
4,100/24,100 |
$241,000 |
$ 41,000 |
|
Assembly |
14,000 |
14,000/24,100 |
241,000 |
140,000 |
|
Finishing |
6,000 |
6,000/24,100 |
241,000 |
60,000 |
|
Totals |
26,000 |
24,100/24,100 |
|
$241,000 |
The budgeted Occupancy Services costs are allocated over a base consisting only of the area occupied by departments that have not yet been allocated. Although Human Resources occupies 1,000 square feet and the Computing Center occupies 900 square feet, no costs are allocated back to these departments. Thus, their areas are not included in the base for allocating Occupancy Services costs, which is 24,100 square feet rather than 26,000 square feet.
Engineering is the last service department to be allocated. Consequently, its costs are allocated only to the production departments. Budgeted Engineering costs, which now include the costs allocated to this department from previous services, are allocated to the production departments as follows:
|
DEPARTMENT |
MACHINEHOURS |
PROPORTION x |
AMOUNT TO BE ALLOCATED = |
AMOUNT ALLOCATED |
|
Assembly |
2,000 |
2,000/2,500 |
$338,500 |
$270,800 |
|
Finishing |
500 |
500/2,500 |
338,500 |
67,700 |
|
Totals |
2,500 |
2,500/2,500 |
|
$338,500 |
Compare the budgeted overhead allocated to the two production departments with the direct method (Exhibit 9-3) and the step method (Exhibit 9-4). The step method, being more accurate, allocated more service departments' overhead to the Assembly Department than did the direct method. The direct method understated Assembly Department overhead costs. This means that the Finishing Department absorbed more service departments' overhead than it should have. Consequently, the direct method resulted in the Finishing Department cross-subsidizing the Assembly Department (i.e., the Finishing Department's overhead account includes service department costs that should be assigned to the Assembly Department).
The Reciprocal Method
Like the step method, the reciprocal method recognizes that services rendered by certain service departments are used, in part, by other service departments. This method, therefore, allocates services back-and-forth among all departments using the services. Instead of the one-way allocations performed under the step method, this method performs two-way (reciprocal) allocations. The reciprocal method's advantage over the step method is that it recognizes all interrelationships among departments and, therefore, produces more accurate service department cost allocations.
The first step in making reciprocal allocations is to determine the share of each service department's costs that is to be allocated to the other service departments and to the production departments. A spreadsheet program can be used to calculate these percentage shares. Exhibit 9-5, which will be used as a starting point for reciprocal cost allocations, shows each Birchtree Manufacturing department's proportionate usage of the other departments' services.
The percentages in Exhibit 9-5 are used to derive simultaneous equations for calculating the costs of the services rendered. When there are few departments and interrelationships, simultaneous equations can be solved by hand.
|
Exhibit 9-5 Bases and Percentage Allocations for Reciprocal Method |
||||||||
|
Birchtree Manufacturing Share Calculations for Cost Allocations |
||||||||
|
Department |
|
|
Cost Allocation Base |
|
|
|
||
|
Payroll Dollars |
Reports |
Square Feet |
Machine Hours |
|||||
|
Amount |
Percent |
Amount |
Percent |
Amount |
Percent |
Amount |
Percent |
|
|
Human Resources |
n/a |
n/a |
100 |
9.1 |
1,000 |
3.8 |
-0- |
0.0 |
|
Computing Center |
$ 50,000 |
25.0 |
n/a |
n/a |
900 |
3.5 |
-0- |
0.0 |
|
Occupancy Services |
40,000 |
20.0 |
200 |
18.2 |
n/a |
n/a |
-0- |
0.0 |
|
Engineering |
30,000 |
15.0 |
7011 |
63.6 |
4,100 |
15.8 |
n/a |
n/a |
|
Assembly |
60,000 |
30.0 |
40 |
3.6 |
14,000 |
53.8 |
2,000 |
80.0 |
|
Finishing |
20,000 |
10.0 |
60 |
5.5 |
6,000 |
23.1 |
500 |
20.0 |
|
Totals |
$200,000 |
100.0 |
1,100 |
100.0 |
26,000 |
100.0 |
2,500 |
100.0 |
If a large number of variables are present, the simultaneous equations will be too complex to solve without the aid of a computer.
With the method of simultaneous equations, the relationships among departments are expressed as a system of linear equations, with one equation for each department. Exhibit 9-6 summarizes the percentages of service department cost allocations from Exhibit 9-5. The percentages in the vertical columns, shown as negative amounts, represent credits to the overhead accounts indicated at the top of the columns. The charges (debits) to other service departments' overhead accounts and to the production departments' overhead accounts are the percentage of the service used multiplied by its cost from the reciprocal solution. The stage one TOH costs of each department are shown in the last column of Exhibit 9-6. The following symbols represent the total cost associated with the departments indicated:
|
SERVICE DEPARTMENT |
PRODUCTION DEPARTMENT |
|
x1 = Human Resources |
x5 = Assembly |
|
x2 = Computing Center x3 = Occupancy Services x4 = Engineering |
x6 = Finishing |
Then, x1, the cost associated with Human Resources, is expressed as:
x1 = 0.091x2 + 0.038x3 + 0x4 + 0x5 + 0x6 + $220,000
This expression indicates that the cost of Human Resources is its DVOH and DFOH cost of $220,000 plus stage two allocations from the Computing Center and Occupancy Services.
|
Exhibit 9-6 Summary of Services Rendered Recognizing Reciprocal Relationships |
||||||||
|
Birchtree Manufacturing Proportion of Cost to be Allocated to Other Departments |
||||||||
|
|
Department Rendering Service |
|
|
|||||
|
Department Receiving Service |
x1 Human Resources |
x2 Computing Center |
x3 Occupancy Services |
x4 Engineering |
x5 Assembly |
x6 Finishing |
|
Total D VOH and DFOH Costs |
|
Human Resources |
- |
-0.091 |
-0.038 |
0.00 |
0.00 |
0.00 |
|
$220,000 |
|
Computing Center |
-0.25 |
- |
-0.035 |
0.00 |
0.00 |
0.00 |
|
180,000 |
|
Occupancy Services |
-0 20 |
-0.182 |
- |
0.00 |
0.00 |
0.00 |
|
150, 000 |
|
Engineering |
-0.15 |
-0.636 |
-0.158 |
- |
0.00 |
0.00 |
|
100,000 |
|
Assembly |
-0.30 |
-0.036 |
-0.538 |
-0.80 |
- |
0.00 |
|
170,000 |
|
Finishing |
-0.10 |
-0.055 |
-0.231 |
-0.20 |
0.00 |
- |
|
50,000 |
|
Totals |
-1.00 |
-1.000 |
-1.000 |
-1.00 |
-1.00 |
0.00 |
|
$870,000 |
similarly, the cost of the Computing Center is expressed as:
x2 = 0.25x1 + 0.035x3 + 0x4 + 0x5 +0x6 + $180,000
This expression indicates that the Computing Center is to be charged with 25 percent of the cost of Human Resources and 3.5 percent of Occupancy Services plus its DVOH and DFOH costs of $180,000. Formatting all the equations:
|
x1 = |
(0.091)x2 |
+ (0.038)x3 |
+ (0.000)x4 |
+ (0.00)x5 |
+ (0.00)x6 |
+ $220,000 |
|
x2 = |
(0.250)x1 |
+ (0.035)x3 |
+ (0.000)x4 |
+ (0.00)x5 |
+ (0.00)x6 |
+ $180,000 |
|
x3 = |
(0.200)x1 |
+ (0.182)x2 |
+ (0.000)x4 |
+ (0.00)x5 |
+ (0.00)x6 |
+ $150,000 |
|
x4 = |
(0.150)x1 |
+ (0.636)x2 |
+ (0.158)x3 |
+ (0.00)x5 |
+ (0.00)x6 |
+ $100,000 |
|
x5 = |
(0.300)x1 |
+ (0.036)x2 |
+ (0.538)x3 |
+ (0.80)x4 |
+ (0.00)x6 |
+ $170,000 |
|
x6 = |
(0.100)x1 |
+ (0.055)x2 |
+ (0.231)x3 |
+ (0.20)x4 |
+ (0.00)x5 |
+ $ 50,000 |
The total cost variables x1 through x6 appear on the left-hand side of the equations, one variable for each equation. On the right-hand side of each equation are the cost variables for each of the remaining departments, multiplied by the appropriate proportions from Exhibits 9-5 and 9-6.
Using a spreadsheet program to solve this system of equations, the secondary cost allocations of service department costs to the producing departments' overhead accounts are shown in Exhibit 9-7a. Note that the Assembly Department's budgeted total overhead equals $656,682, while $213,318 is budgeted for the Finishing Department. The TOH PORs are shown in Exhibit 9-7b. The spreadsheet method is show in the appendix to this chapter.
Neither of the production departments renders services to any of the service departments. Thus, the production departments are not involved in the “vicious circle” of reallocations. The term vicious circle refers to the fact that where service departments are interrelated, it is impossible to know the total cost of department A until the allocation of department B is complete, but the allocation of department B cannot be made until it has received its share of department A's cost.
|
Exhibit 9-7 Reciprocal Method Cost Allocations |
|||
|
a. Reciprocal Allocations |
|
|
|
|
Service Departments |
Variable name |
Reciprocal Allocation amount |
Formulas |
|
Human resources |
x1 |
= $252,261 |
0.091 x CC + 0.038 x 0S + 220,000 |
|
Computing Services |
x2 |
= $251,684 |
0.25 x HR + 0.035 x 0S + 180,000 |
|
Occupancy Services |
x3 |
= $246,259 |
0.2 x HR + 0.182 x CC + 0.158 x 0S + 150,000 |
|
Engineering |
x4 |
= $336,819 |
0.15 x 0.636 x CC + 0.158 x 0S + 100,000 |
|
|
|
|
|
|
Service Departments |
|
|
|
|
Assembly |
x5 |
= $656,682 |
0.3 x HR + 0.036 x CC + 0.538 x 0S + 0.8 x E + 170,000 |
|
Finishing |
x6 |
= $213,318 |
0.1 x HR + 0.055 x CC + 0.231 x 0S + 0.2 x E + 50,000 |
|
Total Budgeted Overhead |
|
$870,000 |
|
|
|
|
|
|
|
b. TOH POR Calculations |
|
|
|
|
Assembly Department: |
TOH POR = |
($656,682 Budgeted TOH / 2,000 Mhr) = 328.34 $/Mhr |
|
|
|
|
|
|
|
Finishing Department |
TOH POR = |
($213,318 Budgeted TOH / 10,000 DLhr) = 21.33 $/DLhr |
|
Compare the total budgeted overhead to be included in each production department's TOH POR using the direct method (Exhibit 9-3), the step method (Exhibit 9-4), and the reciprocal method (Exhibit 9-7). Earlier, the comparison of the direct and step methods indicated that the direct method resulted in the Finishing Department cross-subsidizing the Assembly Department because too much service department costs were allocated to Finishing, while Assembly was undercosted. Now, comparing the step and reciprocal methods reveals that the step method apparently results in the same cross-subsidization costing problem. However, the magnitude of this problem has been greatly reduced. The difference between the step and reciprocal methods' allocations of total service department costs to the production departments' overhead accounts is insignificant.
RESPONSIBILITY ACCOUNTING AND SERVICE DEPARTMENT ALLOCATIONS
Seldom, if ever, will overhead costs applied during a period equal the actual overhead costs recorded in the same period. The reason for this disparity is that the actual level of activity is above or below the budgeted level, and/or actual overhead costs are different from estimated overhead costs. Consequently, in some periods actual overhead costs exceed applied overhead costs, and overhead is underapplied. In other periods, applied overhead costs exceed actual overhead, and overhead is overapplied. Several factors can produce under- or over-applied overhead:
• Actual and estimated variable overhead cost per unit difference. If the actual VOH rate is greater than the VOH POR, variable overhead costs will be underapplied. If the actual VOH rate is less than the VOH POR, variable overhead costs will be overapplied. The rate differences can be caused by spending more on VOH items than budgeted or by using more of the overhead allocation base (e.g., direct labor hours or machine hours) than the standard quantity allowed (SQA). In the discussion of the four-way overhead variance analysis method in Chapter 8, these differences were identified as VOH spending and efficiency variances.
• Actual and estimated total fixed overhead costs difference. A difference between total actual and total estimated FOH costs will cause under- or overapplied fixed overhead. Actual FOH costs may differ from estimated FOH costs for several reasons: rent may have increased, new equipment may have been purchased, taxes may have increased, and so forth. These differences are measured by calculating the FOH budget variance.
• Actual activity and expected capacity difference. Fixed overhead costs will be under-or overapplied if actual production volume differs from the production quota. Possible reasons for a difference between actual and budgeted output were presented in the last chapter. This difference is measured by the FOH volume variance.
The need for overhead cost variance analysis becomes even greater when service departments are present. For proper responsibility accounting and cost management, overhead cost variances need to be traced back to where they are caused. In other words, overhead cost variances for service departments, as well as for production departments, are needed.
Cost variance analysis is very difficult, if not impossible, for two reasons, when percentages are used to allocate total service department costs. First, VOH and FOH are combined into one TOH account, but four-way overhead variance analysis cannot be performed without separate VOH and FOH costs. Second, the percentages based on relative usage normally are recalculated when making actual overhead cost allocations throughout the year.
To illustrate, Birchtree Manufacturing's use of percentages based on the relative usage of services created two problems in evaluating performance. These problems resulted from two events during the year:
• The Computing Center hired three people not planned for originally. This increased its payroll from $50,000 budgeted to $150,000.
• The Human Resources Department spent $280,000 instead of the $220,000 budgeted.
In many traditional CASs, the percentages used to allocate a service department's costs are recalculated based on actual data. These recalculated percentages for the Human Resources Department are shown in Exhibit 9-8. Upon seeing the actual overhead cost allocations from the Human Resources Department to the other departments, Birchtree's management made the following performance evaluations:
• Occupancy Services, Engineering, Assembly, and Finishing personnel all received bonuses at year-end equal to 10 percent of the favorable cost variances reported in Exhibit 9-8.
• The Computing Center personnel did not receive any bonuses because more Human Resources costs were allocated to their overhead account than was expected when the TOH PORs were prepared.
What happened? First, assume that by keeping their payroll costs at budget, Occupancy Services, Engineering, Assembly, and Finishing used the same amount of Human Resources services as planned. Although they used exactly the amount of services budgeted, all of these departments were rewarded because the amount of overhead allocated to each was less than budgeted, solely due to Computing Services having a larger payroll than originally budgeted. This created the illusion that the departments saved Birchtree some money. Birchtree management rewarded them for something they did not do!
|
Exhibit 9-8 Actual Percentages for Birchtree's Human Resources Department's Actual Overhead Cost Allocations |
|||||||
|
|
Original Allocations (See Exhibits 9-4 and 9-5) |
Revised Allocations (Using actual costs) |
|
||||
|
|
Budgeted Payroll a |
Allocation Percentages b |
Budgeted Allocations c |
Actual Payroll d |
Actual Percentages e |
Actual Costs Allocated f |
Cost Variances g=c-f |
|
Computing Center |
$50,000 |
25% |
$ 55,000 |
$150,000 |
50,00% |
$140,000 |
<$85,000>U |
|
Occupancy Services |
40,000 |
20% |
44,000 |
40,000 |
13.33% |
37,333 |
6,667 F |
|
Engineering |
30,000 |
15% |
33,000 |
30,000 |
10,00% |
28,000 |
5,000 F |
|
Assembly |
60,000 |
30% |
66,000 |
60,000 |
20.00% |
56,000 |
10,000 F |
|
Finishing |
20,000 |
10% |
22,000 |
20,000 |
6.67% |
18,667 |
3,333 F |
|
Totals |
$200,000 |
100% |
$220,000 |
$300,000 |
100.00% |
$280,000 |
<$60,000>U |
Second, the Computing Services personnel were penalized for being allowed to hire three people. Computing Services may, or may not, have used more Human Resources services than it should have used. But, the CAS does not capture this information. As a result of recalculating the Human Resources allocation percentages based on actual payroll costs, the Computing Services Center is apparently cross-subsidizing the other departments. Both a motivational and an ethical dilemma have resulted.
The problem of a potentially incorrect performance evaluation was caused by recalculating the percentages used to allocate service department costs. Using percentages based on actual payroll costs may not produce a high-quality CAS. Birchtree management also experienced another problem stemming from the amount of Human Resources costs allocated. Originally, the budgeted costs $220,000 were allocated to the user departments. When many traditional CASs recalculate the percentages, they also allocate the actual costs of the services along with these new percentages.General Ledger System Comparisons: Overhead Accounts for Production Departments and Service Departments
In other words, since the Human Resources Department actually spent $280,000, the CAS allocated this amount to the other departments. The CAS did not capture the spending variance created by this service department, nor did the CAS assign the variance to the proper responsibility center. Instead, the CAS allocations buried this cost overrun in the users' accounts! Thus, Birchtree management, not knowing any better, rewarded the Human Resources Department personnel for not showing any cost variances.4
|
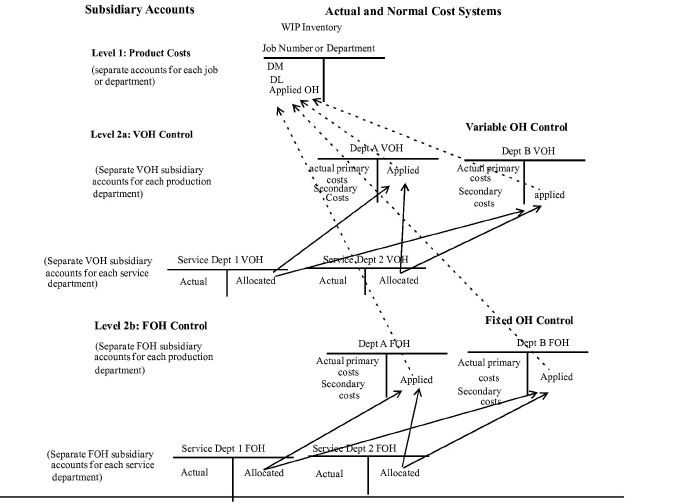
A high-quality CAS will separate VOH and FOH, creating separate accounts and overhead allocations for each department's VOH and FOH. The system used at Birchtree did not. Exhibit 9-9 illustrates the design of a WIP general ledger system that has individual VOH and FOB accounts for production and service departments. Compare this exhibit to Exhibit 8-8.
|
INSIGHTS & APPLICATIONS St. John's Hospital St. John's Hospital is a relatively small rural hospital located in central Iowa. Its three profit centers arc Services, Obstetrics, and General Services. The hospital calls these billing centers. It has three services: Cafeteria, Administration, and Laundry. The management accountant, Prasid Kalari, has designed a normal POCAS in which each patient is treated as a job. Even though a normal CAS is used, rather than a standard CAS, cost variances are prepared and reported annually. The CAS has separate VOH and FOH accounts for each billing center and service center. Variable service department costs are allocated using a budgeted rate. For example, variable costs of the Cafeteria (meals) are allocated using a budgeted rascal rate multiplied by the number of meals eaten in the other responsibility centers. Administration variable costs (files, insurance claims, and so forth) are allocated based on the files processed multiplied by a budgeted rate per file. Laundry variable costs are allocated using the number of loads of laundry processed for each revenue center multiplied by its budgeted rate per load.
|
The logic behind using a budgeted rate (instead of a percentage) is that these costs are variable. The stable relationship for expressing a variable cost is on a per unit (rate) basis. For example, it should cost so much per meal, or file processed, or load of laundry washed and dried. The fixed costs of each service are allocated based on percentages. These percentages are calculated from the maximum capacity usage of each service, rather than the actual or budgeted usage, as is done in many traditional CASs. Prasid's rationale is that fixed costs represent the costs of having a certain amount of capacity available. The size of each user of a service, such as the Cafeteria, determines how big that service should be and, therefore, its fixed costs. Allocating the fixed costs by using relative size percentages of the users, in effect, charges the users a flat fee for having the service available. Prasid Kalari prepared a flowchart for making budget allocations at the beginning of an accounting period (BOP) to set PORs and for making end-of-period (FOP) actual overhead cost allocations for performance evaluation. The flowchart is shown in Exhibit 9-10 When services are allocated using the step method, the Cafeteria is first, then Administration, and, finally, Laundry. The secondary cost allocation bases for these three services are meals served, files processed, and loads of laundry, respectively. The basis for each billing center's POR is patient-days for the stage three applying overhead to the patients' bills (i.e., to these individual jobs). |
A high-quality CAS also recognizes that VOH and FOH are caused by different activities, even for the same department. Thus, VOH and FOH should be allocated differently. The above Saint John's Hospital example has a high-quality CAS for overhead responsibility accounting.
Budget Allocations for VOH PORs
In developing the service departments' budgets, Prasid felt it was important to involve all those responsible for the costs and their control. Accordingly, each department head had to coordinate plans with the others, sharing information so that the budgeting process could be efficiently and effectively performed. For example, the heads of the three billing centers and the other two service departments provided the Cafeteria manager with the meals they expected to eat given their budgeted patient-days for the upcoming year. Similarly, the budgeted files and the budgeted loads of laundry also were determined, based on the budgeted patient days for the billing centers.
In allocating the fixed service center costs, Prasid obtained information about the size of the various departments from the head of hospital administration. With this information, the various department heads prepared their DVOH and DFOH budgets. Prasid then collected the budget information and input it into the Data Section of his spreadsheet program shown in Exhibit 9-11 (see p. 419). The Data Section for Budget Allocations has two parts, one for VOH and one for FOH. The first line of each part (“Budgeted DVOH” and “Budgeted DFOH”) represent the budgeted direct variable and fixed costs of each service department along with the budgeted DVOH and DFOH for each billing center.

|
|
* DVOH + allocations from previous departments. ** For remaining departments only. (Foot means to total a column of numbers.) |
The Cafeteria can be used to demonstrate how the VOH service department rates are calculated in the Solution Section for VOH Allocations. From line two in the Data Section, the Cafeteria manager is budgeting to serve 37,500 meals (1,000 to Administration, 500 to Laundry personnel, none to outpatients, 6,000 to OB patients, and 30,000 to general patients). She budgeted variable food preparation costs of $71,250 for this volume of meals (line one in the Data Section). Dividing this budgeted DVOH by the budgeted meals produces the Meal Rate shown in the Solution Section. The meals' variable costs should be $1.90 per meal. Using this budgeted meal rate, the cafeteria's variable meal costs can be allocated to the other departments based on the number of meals each has planned:
|
User Of Cafeteria Services |
Meal Rate x |
Budgeted Meals |
= VOH Allocation |
|
Administrative Services |
$1.901meal x |
1,000 |
$ 1,900 |
|
Laundry Services |
$1.90/meal x |
500 |
950 |
|
Outpatient |
$1.90/meal x |
-0- |
-0- |
|
Obstetrics |
$1.90/meal x |
6,000 |
11,400 |
|
General |
$1.90/meal x |
30,000 |
57,000 |
|
Variable cafeteria costs to be allocated |
$1.90/meal x |
37,500 |
$71,250 |
The File Rate and Laundry Rate are calculated in a similar way. The File Rate is 0.50 $/per file processed, and the Laundry Rate is 4.00 $/per load5. As with the meal allocations, these rates are multiplied by the budgeted number of files and loads of laundry, respectively, in each user department to receive an allocation under the step method. Using the budgeted rates for the services multiplied by the budgeted amount of services to be provided, all the variable service department costs are allocated into the VOH accounts of the three billing,departments. Once the total VOH for each billing department is known, the VOH PORs can be prepared. Each outpatient is billed $3.05 for VOH, each OB patient is billed $9.35 per day, and each patient in the General Wing of St. John's Hospital is billed $7.00 per day.
|
DATA SECTION: BUDGET ALLOCATIONS AT BEGINNING OF PERIOD (BOP) |
||||||
|
|
SERVICE DEPARTMENTS |
BILLING DEPARTMENTS |
||||
|
|
CAFETERIA |
ADMIN |
LAUNDRY |
OUTPATIENT |
OB |
GENERAL |
|
BUDGETED DVOH |
$71,250 |
$8,100 |
$38,300 |
$12,000 |
$15,000 |
$251,700 |
|
BUDGETED MEALS |
36,000 |
0 |
0 |
0 |
6,000 |
30,000 |
|
BUDGETED FILES |
|
18,500 |
0 |
3,000 |
900 |
14,600 |
|
BUDGETED LOADS |
|
|
10,000 |
1,200 |
300 |
8,500 |
|
BUDGETED PATIENT-DAYS |
|
|
|
6,000 |
3,000 |
50.000 |
|
BUDGETED DFOH |
$48,000 |
$33,040 |
$59,520 |
$26,958 |
$99,738 |
$344,744 |
|
CAPACITY MEALS |
48,500 |
0 |
0 |
0 |
8,500 |
40,000 |
|
CAPACITY FILES |
|
18,000 |
0 |
4,000 |
6,000 |
8,000 |
|
CAPACITY LOADS |
|
|
12,000 |
1,560 |
360 |
10,080 |
|
SOLUTION SECTION: BUDGET ALLOCATIONS AT BEGINNING OF PERIOD (BOP) |
|
|
|||||
|
VOH ALLOCATIONS: |
|
|
|
||||
|
BILLING DEPARTMENTS |
|||||||
|
CAFETERIA |
ADMIN |
LAUNDRY |
OUTPATIENT |
OB |
GENERAL |
||
|
BUDGETED DVOH |
|
$71,250 |
$8,100 |
$38,300 |
$12,000 |
$15,000 |
$251,700 |
|
MEAL RATE |
$1.90 |
|
|
|
|
|
|
|
MEAL ALLOCATION |
|
<71,250> |
1900 |
950 |
0 |
11,400 |
57,000 |
|
FILE RATE |
$0.50 |
|
|
|
|
|
|
|
FILE ALLOCATION |
|
|
<8,100> |
750 |
1,500 |
450 |
7,300 |
|
LAUNDRY RATE |
$4.00 |
|
|
|
|
|
|
|
LAUNDRY ALLOCATION |
|
|
|
<40,000> |
4,800 |
1,200 |
34,000 |
|
TOTAL VOH |
|
$0 |
$0 |
$0 |
$18,300 |
$28,050 |
$350,000 |
|
VOH POR/IPATIENT-DAY |
|
|
|
|
$3.05 |
$9.35 |
$7.00 |
|
FOH ALLOCATIONS: |
|
|
|
|
|
|
|
|
BUDGETED DFOH |
|
$48,000 |
$33,040 |
$59,520 |
$26,958 |
$99,738 |
$344,744 |
|
MEAL CAPACITIES |
|
100% |
2% |
1% |
0 % |
17% |
80% |
|
MEAL ALLOCATION |
|
<48,000> |
960 |
480 |
0 |
8,460 |
38,400 |
|
FILE CAPACITIES |
|
|
100% |
10 % |
20 |
30% |
40% |
|
FILE ALLOCATION |
|
|
<34,000> |
3400 |
6800 |
10,200 |
13,600 |
|
LAUNDRY CAPACITIES |
|
|
|
100% |
13% |
3% |
84% |
|
LAUNDRY ALLOCATION |
|
|
|
<63,400> |
8242 |
1,902 |
53,256 |
|
TOTAL FOH |
|
$0 |
$0 |
$0 |
$42,000 |
$120,000 |
$450,000 |
|
FOH POR/PATIENT-DAY |
|
|
|
|
$7.00 |
$40.00 |
$9.00 |
|
TOH BUDGETED |
|
$0 |
$0 |
$0 |
$60,300 |
$148,050 |
$800,000 |
|
TOH POR/PATIENT-DAY |
|
|
|
|
$10.05 |
$49.35 |
$16.00 |
|
|
|
||||||
Budget Allocations for FOH PORs
Fixed service department costs are allocated to producing departments (billing centers in the hospital) based on the relative size of each user. To demonstrate this, the number of meals that could be eaten by each user department if operating at full capacity is used to determine “relative size ratios” for each user department. For the cafeteria, these ratios are as follows:
|
User Of Cafeteria Services |
Capacity Meals |
Relative size Ratio |
Cafeteria FOH Allocation |
|
Administrative Services |
1,000 meals |
2% |
$ 960 |
|
Laundry Services |
500 |
1 % |
480 |
|
Outpatient Treatment |
-0- |
-0- |
-0- |
|
Obstetrics |
8,500 |
17% |
8,160 |
|
General |
40,000 |
80% |
38,400 |
|
Totals |
50,000 meals |
100% |
$48,000 |
With these relative size ratios, the cafeteria's budgeted fixed costs ($48,000) can be allocated to the various users of this service. Combining the VOH and FOH allocations, each user is contracting to receive a particular service for a mixed cost.6 The FOH allocations represent the fixed cost of having this service available for its users. The VOH allocations represent the incremental cost of using one more unit of that service. The allocated costs of the Cafeteria that should be used by the other departments in budgeting their VOH costs are as follows:
|
User Of Cafeteria Services |
Fixed Cost |
+ |
Variable Cost |
|
Administrative Services |
960 $/year |
+ |
$1.90/meal |
|
Laundry Services |
480 $/year |
+ |
$1.90/meal |
|
Outpatient Treatment |
n/a |
|
n/a |
|
Obstetrics |
8,160 $/year |
+ |
$1.90/meat |
|
General |
38,400 $/year |
+ |
$1.901meal |
In effect, each user is contracting for a specific amount of service at a contracted cost (expressed by the Cafeteria's cost equation for each user). These budgeted (contracted) amounts will be used in the actual overhead cost allocations and cost variances presented in the following sections.
Actual Variable Cost Allocations
Each user of a service contracts to buy that service for a specific price, such as $1.90 per meal for the Cafeteria. As shown in the Data Section for Actual Cost Allocations in Exhibit 9-12, the actual variable and fixed costs, along with the actual usage of each service, are input. The first two amounts under the “Cafeteria” column are the actual variable Cafeteria costs and the actual meals served. From these two amounts, the actual variable cost of a meal is $2.00 ($80,000 / 40,000 meals). However, the users only contracted to pay $1.90 per meal, and that is all they should have to pay. It is the Cafeteria manager's responsibility to control these costs. If more is spent in preparing meals than was budgeted, this “spending” variance should remain within the Cafeteria VOH account
|
Exhibit 9-12 St. John's Hospital Step Method Allocations: Year-End Actual Costs Allocations |
||||||
|
|
SERVICE DEPARTMENTS |
|
|
|
||
|
|
BILLING DEPARTMENTS |
|||||
|
|
CAFETERIA |
ADMIN |
LAUNDRY |
OUTPATIENT |
OB |
GENERAL |
|
ACTUAL DVOH |
$80,000 |
$6,210 |
$38,600 |
$11,050 |
$15,000 |
$177885 |
|
ACTUAL MEALS |
40,000 |
1000 |
400 |
0 |
8,600 |
30,000 |
|
ACTUAL FILES |
|
18,000 |
1,280 |
4,000 |
1,500 |
11,220 |
|
ACTUAL LOADS |
|
|
10,000 |
1,500 |
500 |
8,000 |
|
ACTUAL PATIENT-DAYS |
|
|
|
6,500 |
4,000 |
45,000 |
|
ACTUAL DFOH |
$50,000 |
$31,040 |
$59,250 |
$30,000 |
$143,000 |
$340,000 |
|
SOLUTION SECTION: ACTUAL COST ALLOCATIONS AT END OF PERIOD (EOP) |
|||||||
|
VOH ALLOCATIONS: |
|
|
|
||||
|
BILLING DEPARTMENTS |
|||||||
|
CAFETERIA |
ADMIN |
LAUNDRY |
OUTPATIENT |
OB |
GENERAL |
||
|
ACTUAL DVOH |
|
$80,000 |
$6,210 |
$38,600 |
$11,050 |
$15,000 |
$177,885 |
|
MEAL RATE |
$1.90 |
|
|
|
|
|
|
|
MEAL ALLOCATION |
|
<76,000> |
1,900 |
760 |
0 |
16,340 |
57,000 |
|
FILE RATE |
$0.50 |
|
|
|
|
|
|
|
FILE ALLOCATION |
|
|
<9,000> |
640 |
2,000 |
750 |
5,610 |
|
LAUNDRY RATE |
$4.00 |
|
|
|
|
|
|
|
LAUNDRY ALLOCATION |
|
|
|
<40,000> |
6000 |
2000 |
32,000 |
|
TOTAL VOH |
|
$4,000 |
<$890> |
$0 |
$19,050 |
$34,090 |
$272,495 |
|
LESS: PATIENT CHARGES |
|
|
|
|
<19,825> |
<37,400> |
<315,000> |
|
ENDING VOH BALANCE |
|
$4,000 |
<$890> |
$0 |
<$775> |
<$3,310> |
<$42,505> |
|
FOH ALLOCATIONS: |
|
|
|
|
|
|
|
|
ACTUAL DFOH |
|
$50,000 |
$31,040 |
$59,520 |
$30,000 |
$143,000 |
$340,000 |
|
MEAL CAPACITIES |
|
100% |
2% |
1% |
0% |
17% |
80% |
|
MEAL ALLOCATION |
|
<48,000> |
960 |
480 |
0 |
8,160 |
38,400 |
|
FILE CAPACITIES |
|
|
100% |
10% |
20% |
30% |
40% |
|
FILE ALLOCATION |
|
|
<34,000> |
3,400 |
6,800 |
10,200 |
13,600 |
|
LAUNDRY CAPACITIES |
|
|
|
100% |
13% |
3% |
84% |
|
LAUNDRY ALLOCATION |
|
|
|
<63,400> |
8,242 |
1,902 |
53,256 |
|
TOTAL FOH |
|
$2000 |
<$2000> |
$0 |
$45,042 |
$163,262 |
$445,256 |
|
LESS: PATIENT CHARGES |
|
|
|
|
<45,500> |
<160,000> |
<405,000> |
|
ENDING FOH BALANCE |
|
$2000 |
<$2000> |
$0 |
<$458> |
$3,262 |
$40,256 |
|
ENDING TOH BALANCE |
|
$6,000 |
<$2,890> |
$0 |
<$1,233> |
<$48> |
<$52,249> |
The number of meals eaten, however, is the responsibility of the user departments. Therefore, their allocated actual variable meal costs are calculated as the budgeted meal rate multiplied by the actual meals eaten.7 In this way, the users assume responsibility for the usage of services (i.e., the number of meals they actually ate), and the provider of the service assumes responsibility for the cost of providing that service.
To illustrate this for the cafeteria costs, there was a $0.10 per meal unfavorable variable cost spending variance ($1.90/meal standard rate versus the $2.00/meal actual rate) for each of the 40,000 actual meals served. This $4,000 unfavorable spending variance is the responsibility of the Cafeteria manager, and this allocation method keeps the spending variance within the Cafeteria's VOH account.8 The $4,000 ending (debit, underapplied) overhead balance in the Cafeteria's VOH account is shown on the “Ending VOH Balance” line of the Solution Section for VOH Allocations in Exhibit 9-12.9
What type of variances should make up the ending VOH account balances? There are two VOH cost variances, spending and usage (efficiency):
• Each department should have a spending variance only for its own direct VOH costs.
• Each department should have a usage variance if it used more or less of a service allocated to it. The usage of each service can generate its own usage variance. For example, as illustrated in the “Service Department Cost Variances” section below, the Outpatient VOH account balance of <$775> can be composed of up to four cost variances: a DVOH spending variance and usage variances for each of the three services it used (Cafeteria, Administration, and Laundry). While the Laundry Department's VOH account balance is zero, this total could be comprised of three different cost variances: a DVOH spending variance, a usage variance for meals eaten, and a usage variance for files processed.
Actual Fixed Cost Allocations
Actual fixed service department costs are not really allocated to the using departments. Instead, the budgeted FOH is allocated. During the budgeting process, the departments using services contracted to pay for these services as a mixed cost. Using a budgeted VOH rate, users pay for the actual meals eaten, files processed, or loads of laundry done. With respect to the fixed costs of having a service available, each user contracted to pay a fair share of the budgeted fixed cost. From the users' perspective, they should only have to pay the budgeted rate (multiplied by the actual amount of services used) and the budgeted fixed cost. Accordingly, they should only have to pay the budgeted fixed cost agreed to in the service's cost equation developed as part of the POR and budgeting process. In other words, only the budgeted fixed cost should be allocated to the users of a service. Any difference between the actual FOH and budgeted FOH should remain in the service's FOH account as an FOH budget (spending) variance.
To illustrate this for the Cafeteria's fixed costs, the ending balance in its FOH account is $2,000. From the FOH Allocations in the Solution Section in Exhibit 9-12, actual fixed cafeteria costs were $50,000 against a budget of $48,000. The $2,000 unfavorable FOH budget variance is the responsibility of the Cafeteria manager, and, as with a VOH spending variance, this amount remains in the Cafeteria's account. it is not allocated to the users and buried in the cost of their overhead. In Administration, $33,040 was budgeted for primary (direct) fixed costs. Actual DFOH was $31,040, yielding a $2,000 favorable FOH budget variance for Administration. This variance (overapplied overhead is a credit balance) remains in the Administration FOH account. For Laundry, $59,520 was budgeted and spent for DFOH, so that service center has no ending FOH account balance.
In summary, by allocating the same amounts at both the beginning of the year and the end of the year, any FOH spending variance remains in the service center FOH account responsible for it. Which cost variances comprise the ending FOH account balance?
• Under this allocation procedure, the ending FOH account balances contain only one cost variance for service departments, the FOH budget variance for the service's DFOH.
• The ending FOH account balances in producing departments can be made up of two FOH cost variances, the DFOH budget variance of the production department and an FOH volume variance if actual patient-days are different from the amount budgeted.
There is no FOH volume variance for the service departments because an FOH POR is not used to allocate service department FOH to other services and production departments. A service's FOH is allocated using the lump-sum amounts budgeted for each user. There is an FOH volume variance, though, in the production department FOH accounts because a rate (FOH POR) is used to apply FOH to individual products. FOH needs to be absorbed into each products' cost and sales price so that total sales revenues are sufficient to pay for the total FOH costs. The FOH POR is multiplied by the volume of its basis in allocating FOH to products. If more products are made than budgeted, more FOH will be allocated than budgeted (resulting in a favorable volume variance).
Service Department Cost Variances
In reconciling the ending overhead account balances and breaking down the balances into their underlying cost variances, Prasid Kalari prepared the analyses shown in Exhibits 9-13 and 9-14. Exhibit 9-13 contains the cost variances for the service departments that are discussed in the following paragraphs.
CAFETERIA COST VARIANCES. The Cafeteria's DVOH spending variance has already been illustrated, as has the DFOH budget variance. These two variances are calculated as follows:
DVOH spending variance = AQp x (SP - AP)
|
|
= 40,000 meals x ($1.90/meal - $2.00/meal) |
|
|
= <$4,000> unfavorable |
DFOH budget variance = Budgeted DFOH - Actual DFOH
|
|
= $48,000 - $50,000 |
|
|
= <$2,000> unfavorable |
A service department's overhead account balances are made up of its direct (primary) costs spending variances and usage variances for any services allocated to it. Since the Cafeteria is the first service department, no previous service costs are allocated to it. Its overhead account ending balances can only consist of the two variances above, totalling <$6,000>.10
ADMINISTRATION COST VARIANCES. Administration's VOH account balance can be made up of two cost variances, the DVOH spending variance and a Cafeteria usage variance. Its FOH balance consists of only one variance, the DFOH budget variance.
|
|
Quantities |
Costs per unit |
Totals |
|
Cafeteria |
|
|
|
|
Variable costs should have totaled |
|
$ 1.90 |
$ 76,000 |
|
Actual variable costs for 40,000 meals |
|
<$ 2.00> |
<$ 80,000> |
|
Overspent (Unfavorable Spending Variance): |
|
<$ 0.10> |
<$ 4,000> U |
|
Actual direct fixed costs should not have been different form budget. Overspent by: |
|
|
<$ 2,000> U |
|
Total net unfavorable spending variance |
|
|
<$ 6,000> U |
|
Administration |
|
|
|
|
Direct Variable Costs should have totaled: |
|
$ 0.405 |
$ 7,290 |
|
Actual Direct Variable Costs for 18,000 files |
|
<$ 0.345> |
<$ 6,210> |
|
Underspent (Favorable spending Variance) |
|
$ 0.060 |
$ 1,080 |
|
Standard Quantity Allowed (meals per file) |
900 |
|
|
|
Actual meals eaten |
<1,000> |
|
|
|
Unfavorable Meal Usage Variance |
<100> |
$ 1.90 |
<$ 190> U |
|
Net Favorable Variable Cost Variance |
|
|
$ 890 F |
|
Favorable Direct Fixed Costs Spending Variance: |
|
|
$ 2,000 F |
|
Total net Favorable Cost Variance |
|
|
$ 2,890 F |
|
|
|
|
|
|
Laundry Services |
|
|
|
|
Direct Variable Costs should have totaled: |
|
$ 3.83 |
$ 38,300 |
|
Actual Direct Variable Costs (10,000 loads): |
|
<$ 3.86> |
<$ 38,600> |
|
Unfavorable Direct VOH spending Variance |
|
<$ 0.03> |
<$ 300> U |
|
Standard Quantity Allowed (meals per load): |
500 |
|
|
|
Actual meals eaten: |
<400> |
|
|
|
Favorable Meal Usage Variance: |
100 |
$ 1.90 |
$ 190 F |
|
Standard Quantity Allowed (files per load): |
1,500 |
|
|
|
Actual files processed: |
<1,280> |
|
|
|
Favorable Files Usage Variance: |
220 |
$ 0.50 |
$ 110 F |
|
Net Variable Costs Variance: |
|
|
$ 0 |
|
Direct Fixed Costs Spending Variance: |
|
|
$ 0 |
|
Total Net Cost Variance: |
|
|
$ 0 |
|
|
|
|
|
DVOH spending variance = AQp x (SP - AP)
= 18,000 files x ($0.405/tile - $0.345/file)
= $1,080 favorable
The $0.50 budgeted file rate (Exhibit 9-12) consists of $0.405 per file for DVOH ($8,100 - 20,000 budgeted files) and $0.095 per file for variable meal costs ($1,900 - 20,000 files). The actual DVOH rate is $6,210 _ 18,000 actual files ($0.345). These calculations are shown in the Administration section of Exhibit 9-13.
Meal usage variance = SP x (SQA - AQu)
= $1.90/meal x (900 meals - 1,000 meals)
= $<190> unfavorable
The standard quantity of meals per file is 0.05 (1,000 budgeted meals / 20,000 budgeted files). This manager budgeted 1,000 meals to be eaten if 20,000 files are planned to be processed. Thus, 20 files should be processed for each meal eaten. Since 18,000 files were actually processed, only 900 meals (the SQA) should have been eaten.
DFOH budget variance = Budgeted DFOH - Actual DFOH
= $33,040 - $31,040
= $2,000 favorable
LAUNDRY SERVICES COST VARIANCES. As the third service department in the step method allocation order, Laundry Services' VOH account balance can consist of three variances: its DVOH spending variance and usage variances for each of the two services allocated to it. Its FOH balance consists of the DFOH budget variance.
DVOH spending variance = AQp x (SP - AP)
= 10,000 loads x ($3.83/load - $3.86/load)
= <$300> unfavorable
The budgeted DVOH rate is $3.83 ($38,300 budgeted DVOH - 10,000 budgeted loads). The actual DVOH laundry rate is $3.86 per load ($38,600 - 10,000 loads).
Meal usage variance = SP x (SQA - AQu)
= $1.90/meal x (500 meals - 400 meals)
= $190 favorable
The standard quantity of meals per load of laundry is 0.05 meals per load (500 budgeted meals - 10,000 budgeted loads). If 10,000 actual loads of laundry were done, 500 meals should have been eaten.
Files usage variance = SP x (SQA - AQu)
= $0.50/file x (1,500 files - 1,280 files)
= $110 favorable
The number of files that should have been processed for the loads of laundry actually done (SQA) is 1, 500 (SQ of 0.15 files per load multiplied by the 10,000 actual loads). The SQ for files is 1,500 budgeted files - 10,000 budgeted loads. There is no FOH ending balance for Laundry Services because its budgeted and actual DFOH are $59,520.
Production Department Cost Variances
Exhibit 9-14 reports the overhead cost variances for each of the billing departments. The VOH variances can include a direct VOH spending variance for each billing department and usage variances for each service allocated to it. The FOH variances include a direct FOH budget variance and a volume variance for each billing department. These variances are calculated below.
Out-patient Overhead Cost Variances
DVOH spending variance = AQp x (SP - AP)
= 6,500 patient-days x ($2.00/patient-day - $1.70/patient-day)
= $1,950 favorable
The budgeted DVOH of $12,000 (Exhibit 9-11) / 6,000 budgeted patient-days equals the $2.00 per patient-day budgeted rate. The actual rate is $11,050 / 6,500 actual patient-days ($1.70).
File usage variance = SP x (SQA - AQu)
= $0.50/file x (3,250 files - 4,000 files)
= <$375> unfavorable
For outpatient treatments, planning called for 3,000 files to be processed for 6,000 patient-days (Exhibit 9-11), yielding a standard quantity of 0.5 files per patient-day and an SQA of 3,250 files for the 6,500 actual patient-days.
Laundry usage variance = SP x (SQA - AQu)
= $4.00/load x (1,300 loads - 1,500 loads)
= <$800> unfavorable
From the budgeted information in the Data Section of Exhibit 9-11, the loads of laundry planned (1,200) for the budgeted patient-days (6,000) yields a standard quantity of 0.2 loads per patient-day. For the actual 6,500 patient-days incurred, then, 1,300 loads should have been done.
|
|
Quantities |
Costs per unit |
Totals |
|
Out-Patient |
|
|
|
|
Direct VOH costs should have totaled: |
|
$ 2.00 |
$ 13,000 |
|
Actual Direct VOH costs for 6,500 patients |
|
<$ 1.70> |
<$ 11,050> |
|
Favorable DVOH spending Variance: |
|
$ 0.30 |
$ 1,950 F |
|
Standard Quantity Allowed (files per patient-day) |
3,250 |
|
|
|
Actual files processed: |
<4,000> |
|
|
|
Unfavorable File Usage Variance |
<750> |
$ 0.50 |
<$ 375> U |
|
Standard Quantity Allowed (loads per patient-day): |
1,300 |
|
|
|
Actual loads done: |
<1,500> |
|
|
|
Unfavorable Laundry Usage Variance |
<200> |
$ 4.00 |
<$ 800> U |
|
Net Favorable Variable Costs Variance |
|
|
$ 775 F |
|
Unfavorable Direct FOH Spending Variance |
|
|
<$ 3,042> U |
|
Actual Patient-days: |
6,500 |
|
|
|
Budgeted patient-days |
:<6,000> |
|
|
|
Favorable FOH Volume Variance: |
500 |
$ 7.00 |
$ 3,500 F |
|
Net Favorable FOH Cost Variance: |
|
|
$ 458 F |
|
Total Net Favorable Cost Variance: |
|
|
$ 1,233 F |
|
Obstetrics |
|
|
|
|
Direct VOH costs should have totaled: |
|
$ 5.00 |
$ 20,000 |
|
Actual Direct VOH costs for 4,000 patients |
|
<$ 3.75> |
<$15,000> |
|
Favorable DVOH spending Variance: |
|
$ 1.25 |
$ 5,000 F |
|
Standard Quantity Allowed (meals per patient-day) |
8,000 |
|
|
|
Actual meals eaten: |
<8,600> |
|
|
|
Unfavorable Meal Usage Variance |
<600> |
$ 1.90 |
<$ 1,140> U |
|
Standard Quantity Allowed (files per patient-day) |
1,200 |
|
|
|
Actual files processed: |
<1,500> |
|
|
|
Unfavorable File Usage Variance |
<300> |
$ 0.50 |
<$ 150> U |
|
Standard Quantity Allowed (loads per patient-day): |
400 |
|
|
|
Actual loads done: |
<500> |
|
|
|
Unfavorable Laundry Usage Variance: |
<100> |
$ 4.00 |
<$ 400> U |
|
Net Variable Costs Variance |
|
|
$3,310 F |
|
Unfavorable Direct FOH Spending Variance |
|
|
<$ 43,262> U |
|
Actual Patient-days: |
4000 |
|
|
|
Budgeted patient-days |
<3000> |
|
|
|
Favorable FOH Volume Variance: |
1,000 |
$ 40.00 |
$ 40,000 F |
|
Net Unfavorable FOH Cost Variance: |
|
|
<$ 3,262> U |
|
Total Net Favorable Cost Variance |
|
|
$ 48 F |
|
General |
|
|
|
|
Direct VOH costs should have totaled: |
|
$ 5.043 |
$ 226,530 |
|
Actual Direct VOH costs for 45,000 patients |
|
<$ 3,953> |
<$ 177,885> |
|
Favorable DVOH Spending Variance: |
|
$ 1.081 |
$ 48,645 F |
|
Standard Quantity Allowed (meals per patient-day): |
27,000 |
|
|
|
Actual meals eaten: |
<30,000> |
|
|
|
Unfavorable Meal Usage Variance: |
<3,000> |
$ 1.90 |
<$ 5,700> U |
|
Standard Quantity Allowed (files per patient-day) |
13,140 |
|
|
|
Actual files processed: |
<11,220> |
|
|
|
Favorable File Usage Variance |
1,920 |
$ 0.50 |
$ 960 F |
|
Standard Quantity Allowed (loads per patient-day): |
7,650 |
|
|
|
Actual loads done: |
<8,000> |
|
|
|
Unfavorable Laundry Usage Variance: |
<350> |
$ 4.00 |
<$ 1,400> U |
|
Net Variable Costs Variance |
|
|
$ 42,505 F |
|
Unfavorable Direct FOH Spending Variance |
|
|
$ 4,744 F |
|
Actual Patient-days: |
45,000 |
|
|
|
Budgeted patient-days |
<50,000> |
|
|
|
Favorable FOH Volume Variance: |
<5,000> |
$ 9.00 |
<$ 45,000> U |
|
Net Unfavorable FOH Cost Variance: |
|
|
<$ 40,256> U |
|
Total Net Favorable Cost Variance |
|
|
$ 2,249 F |
DFOH budget variance = Budgeted DFOH - Actual DFOH = $26,958 - $30,000 = <$3,042> unfavorable
FOH volume variance = FOH POR x (Actual patient-days - Budgeted patient-days)
= $7.00/patient-day x (6,500 - 6,000)
= $3,500 favorable
The volume variance arises because FOH has to be absorbed into the cost of each patient-day. In other words, the FOH has to be billed to all the patients by breaking it down into a rate per patient-day. This is absorption costing. The FOH volume variance only arises with absorption costing. There are no volume variances for the service departments' FOH allocations because a rate is not needed to allocate service department FOH to the production departments' FOH accounts.
Why is an FOH POR needed for production departments in applying FOH to products (stage three allocations), but not needed for service-to-production department (stage two) allocations? The number of departments receiving a service's FOH allocation is known. Therefore, a lump-sum amount can be allocated to each. if the number of patient-days could be known with certainty, then a lump-sum amount of FOH could be applied to each department. But, because sales and production volumes are not known when budgeting, an FOH POR must he calculated based on the estimated volumes. When the estimated and actual volumes do not agree, an FOH volume variance results.
OBSTETRICS AND GENERAL OVERHEAD COST VARIANCES. The cost variances of the Obstetrics and General Billing departments are calculated in the same way as for the Outpatient Treatment center, and, therefore, will not be reproduced here.” The VOH account for Obstetrics contains four cost variances: the DVOH spending variance ($5,000 favorable) and a meal usage variance ($1,140 unfavorable), file usage variance ($150 unfavorable), and laundry usage variance ($400 unfavorable). The DFOH budget variance for Obstetrics is $43,262 unfavorable, and the FOH volume variance is $40,000 favorable.
The same variances exist in the VOH and FOH accounts for the General Wing of St. John's Hospital. These variances include a DVOH spending variance ($48,645 favorable), meal usage variance ($5,700 unfavorable), file usage variance ($960 favorable), laundry usage variance ($1,400 unfavorable), direct FOH budget variance ($4,744 favorable), and FOH volume variance ($45,000 unfavorable).
Standard Cost Accounting Systems for Service Department Allocations
Prasid Kalari developed a normal JOCAS for St. John's Hospital, but cost variances were calculated and reported annually. An SCAS could have been used. How would an SCAS differ from the normal JOCAS used by Kalari? In an SCAS, cost variances are journalized into separate subsidiary WIP accounts for each responsibility center. These “level three” accounts within WIP were first introduced in Chapter 8 (Exhibit 8-8). When service departments are present, each will have its own cost variance accounts just like the production departments' cost variance accounts.
In journalizing service department VOH cost variances, the stage two amounts allocated to production departments are calculated by using the budgeted rates multiplied by the standard quantity of the service allowed, rather than the actual quantity of the service used. Accordingly, instead of including the usage variances for services within the using department's VOH account balance, these can be journalized to that department's cost variance accounts if using an SCAS. When the actual amount of a service is used to allocate VOH, the usage variance remains within the user's VOH and FOH accounts as ending under- or over-applied overhead.
As long as cost variances are properly calculated and reported to the correct responsibility centers, whether or not they are journalized into special accounts (as with an SCAS) is not critical for effective cost management. The important attribute of a high-quality overhead accounting system is that the cost variances are reported to the proper responsibility centers. This reporting should be timely enough to allow corrective actions and operational control. It is unlikely that St. John's annual reporting will promote operational control actions if cost variances are only reported annually.
11It probably is a good idea to go back to Exhibits 9-12 and 9-14 and work through [tie cost variance calculations.
SUMMARY OF LEARNING OBJECTIVES
The major goals of this chapter were to enable you to achieve four learning objectives:
Learning objective 1. Discuss the need for multiple overhead accounts within WIP.
Overhead represents the indirect costs of making a product or providing a service. These costs, which are becoming a more significant portion of the total manufacturing costs as enterprises automate processes, need to be accounted for in a way that promotes accurate product costing and cost management. Traditionally, CASs were designed primarily for financial reporting. All overhead items were (and still are in many manufacturers) journalized into one TOH account, and one TOH POR was created to apply these costs to production.
To understand and control overhead, and to measure the costs of making a product more accurately, multiple overhead accounts are needed. Each overhead account should have a POR that applies that overhead based on the activities that cause it.
Separate overhead accounts can be created for VOH and FOH and for each production and service department. This allows overhead costs and their cost variances to be directly traced to responsibility centers. In addition to facilitating control over these costs, separate PORs can more accurately apply VOH and FOH based on their different causes.
Accumulating primary costs in departmental overhead accounts is the first stage in overhead accounting. The second stage involves secondary overhead cost allocations from service departments to other service and production departments using those services. Variable and fixed service costs should be allocated using a basis that represents their usage. Once all overhead costs have been allocated into production department VOH and. FOH accounts, then (stage three) these costs can be applied to products as they pass through the production departments.
Learning objective 2. Describe how the general ledger system for WIP can be designed to provide more accurate product cost information and cost management information.
WIP consists of two “levels” of subsidiary accounts in a normal PCAS or JOCAS. These are the product cost accounts (jobs or production departments) and overhead accounts. Product costs are level one accounts. Overhead accounts are level two accounts. SCASs add a third level of subsidiary accounts, as discussed in Learning Objective 4.
The overhead accounts consist of two control accounts, one for VOH and one for FOH. Within the VOH and FOH control accounts, there are separate accounts for each production and service department. Using multiple overhead accounts enables these costs to be accumulated according to the departments that are responsible for their management and control.
Using proper allocation techniques (summarized in the next learning objective), a more accurate product cost can result. By analyzing the ending balances in each over-head account, the CAS can also provide cost variance information to promote cost management.
Learning objective 3. Explain how to allocate service department costs to production departments, and describe the different methods that can be used.
Four methods can be used for making secondary (stage two) overhead cost allocations between service department accounts and production department overhead accounts:
• The direct method allocates each service department independently to production departments. This method is the simplest of the four, but it provides the least accurate allocations when reciprocal usage between service departments exists.
• The step method improves upon the direct method by making one-way allocations of certain services to other service departments. Once a service has been allocated no other services can be allocated “back” to it. This method reduces the cross-subsidization costing problem that occurs with the direct method, but does not eliminate it. Eliminating the problem requires simultaneous allocations between service departments.
The reciprocal method, using simultaneous equations, allocates service department costs back-and-forth between services. Accordingly, it is considered to provide the most accurate product cost. The allocations can be performed with a fairly simple spreadsheet program, although the circular error problem may require the use of matrix algebra or linear programming as the number of services increases.
The reciprocal method allocates service costs based on the percentages of services used by other departments. For better cost management information, separate allocations should be made for VOH and FOH. The variable service costs should be allocated with a budgeted rate (summarized under the next objective). The fixed service costs should be allocated using percentages based on the relative size of each user in terms of the service rendered. These relative size ratios are calculated using the maximum amount of the service that could be requested by each user if it is operating at full production capacity.
Learning objective 4. Design an SCAS that includes cost variances for both production and service departments.
An SCAS adds a third level of subsidiary accounts to WIP. These are for departmental cost variances. Both service departments and production departments should have cost variance accounts.
To calculate overhead cost variances properly, service department variable costs should be allocated using a FOR. By using a POR, the DVOH spending variance can be isolated within the responsibility center's VOH account. Fixed overhead should be allocated using relative size ratios. This allows the DFOH budget variance to be isolated within the departmental overhead account responsible for controlling the cost of that service.
Within a normal CAS, service department variable costs are allocated using the actual quantity of the service instead of the SQA. This moves the services' usage variances to the VOH accounts of the departments using those services. The ending balances in the VOH accounts of each service and production department will then include that department's DVOH spending variance, as well as usage variances for each service used by it. The ending over- and underapplied overhead balances in each service and production department's account are analyzed in terms of the overhead cost variances that make up those ending balances.
With an SCAS, the variances are journalized into the variance accounts for each department. Thus, VOH and FOH cost variances are moved out of the service and production department VOH and FOH accounts. With an SCAS, then, there are no ending over- or underapplied overhead account balances.
Appendix: Spreadsheet Reciprocal Method
Using the example in the book, Excel easily computes all the items we need for a reciprocal solution. There are 4 steps in the process:
1 Derive the cost equations for each department
2 Prepare the Matrix representing the equations
3 Invert the Martix of cost relationships
4 Multiply the inverted Matrix by the vector of department costs
From Table 9.6 we can prepare the matrix of cost percentages seen in Exhibit 9-15.
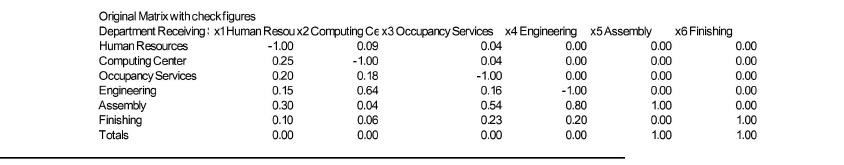
Note that the diagonal with the 1s shows negative numbers [-1] for all service department row-by-column intersections. This indicates that 100% of costs are being transferred out of the service departments. The diagonal shows positive numbers [1] for the row-by-column intersections for production departments. This indicates that 100% of costs are being transferred into production departments.
The next step is to invert the matrix. In Excel you move your cursor below the original matrix and highlight an empty area the same size as the original matrix. This creates the output area. For this problem you would create a 6-by-6 output area since you do not include the titles or check figures at the bottom. Next, type =minverse( then move our cursor up to the original matrix and highlight it. Then press cntl-shift-enter at the same time. The following matrix will appear: 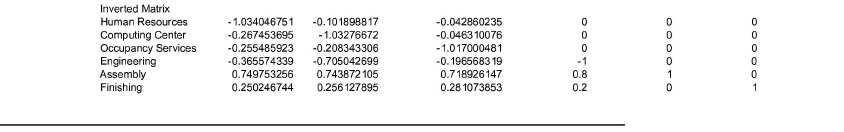
Next, enter the following vector of costs: 
The last step is to write equations to multiply the costs imes the inverted matrix. This is a good test of your equation-writing skills. If you use absolute and relative referencing properly you can write 1 equation and paste it into all 36 cells to get the following answer [The last column is a sum of the first 6 columns]: 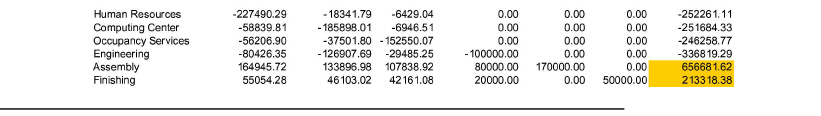
The last column represents the total costs transferred out or into all departments. Negative numbers indicate a transfer out and positive numbers indicate a transfer in. With these numbers you can reconstruct Exhibit 9-7. In general you only need the shaded numbers for OH cost allocation. These are the numbers that will be used to compute the PORs. Notice that the amount transferred out [$1,087,023] is greater than the amount transferred in. This is correct because this method computes the amount transferred out by including all costs transferred in. Explaining this to a non-numerate colleague is difficult and may be a reason to not show them the complete results.
|
IMPORTANT TERMS
Direct method A cost allocation technique that allocates service department costs directly to production departments without making any inter-service department allocations. It is the simplest, but least accurate, of the secondary (stage two) cost allocation methods.
Primary cost assignment In stage one, overhead costs are initially assigned to the service and production departments' VOH and FOH accounts.
Production departments (operating departments, cells, or workcenters) The areas where the central purposes of the organization are carried out; that is, where work is performed directly on products manufactured or services are performed for customers.
Reciprocal method A cost allocation technique that considers all interrelationships of the departments and reflects these relationships in simultaneous equations. This is considered to provide the most accurate allocations of the three methods.
Secondary cost allocation Stage two involves allocating service department costs to other service and production departments. Once all service department costs are allocated to production department overhead accounts, they are included in the departmental PORs.
Service departments Areas or segments of the organization that do not engage directly in production activities, but are used to provide assistance and support for production departments.
Step method A cost allocation technique that allows for limited recognition of services rendered by service departments to other service departments. It provides more accurate PORs and product costs than the direct method, but it is not as accurate as the reciprocal method.
DEMONSTRATION PROBLEMS
DEMONSTRATION PROBLEM 1 Allocation of budgeted service department costs by the direct method.
Use the information from St. John's Hospital in Exhibit 9-11 to calculate VOH and FOH PORs for each of its three billing departments. Allocate the variable service department costs using a budgeted rate for each service based on budgeted cost of the service and budgeted demand. The FOH allocations should be based on relative size ratios. Discuss the differences that result from the direct method and the step method.
SOLUTION TO DEMONSTRATION PROBLEM 1
The same spreadsheet program used for the step method in Exhibit 9-11 can be used for the direct method. The difference between the two methods is that with.the direct method, no service department costs are allocated to other service departments.
This is reflected in the Data Section by inputting zero meals and zero files for Administration and Laundry Services. As can he seen in the VOH and FOH Solution Sections, no service department costs are allocated to other services. Instead they are directly allocated to the billing departments.
|
Data Section: Budget Allocations At Beginning Of Period (Bop) |
||||||
|
|
Service Departments |
Billing Departments |
||||
|
|
Cafeteria |
Admin |
Laundry |
Outpatient |
Ob |
General |
|
Budgeted Dvoh |
$71,250 |
$8,100 |
$38,300 |
$12,000 |
$15,000 |
$251,700 |
|
Budgeted Meals |
36,000 |
0 |
0 |
0 |
6,000 |
30,000 |
|
Budgeted Files |
|
18,500 |
0 |
3,000 |
900 |
14,600 |
|
Budgeted Loads |
|
|
10,000 |
1,200 |
300 |
8,500 |
|
Budgeted Patient-days |
|
|
|
6,000 |
3,000 |
50.000 |
|
Budgeted Dfoh |
$48,000 |
$33,040 |
$59,520 |
$26,958 |
$99,738 |
$344,744 |
|
Capacity Meals |
48,500 |
0 |
0 |
0 |
8,500 |
40,000 |
|
Capacity Files |
|
18,000 |
0 |
4,000 |
6,000 |
8,000 |
|
Capacity Loads |
|
|
12,000 |
1,560 |
360 |
10,080 |
|
Solution Section: Budget Allocations At Beginning Of Period (Bop) |
|||||||
|
VOH Allocations: |
|
|
|
||||
|
Billing Departments |
|||||||
|
Cafeteria |
Admin |
Laundry |
Outpatient |
Ob |
General |
||
|
Budgeted DVOH |
|
$71,250 |
$8,100 |
$38,300 |
$12,000 |
$15,000 |
$251,700 |
|
Meal Rate |
$1.98 |
|
|
|
|
|
|
|
Meal Allocation |
|
<71,250> |
0 |
0 |
0 |
11,875 |
59,375 |
|
File Rate |
$0.44 |
|
|
|
|
|
|
|
File Allocation |
|
|
<8,100> |
0 |
1,314 |
394 |
6,392 |
|
Laundry Rate |
$3.83 |
|
|
|
|
|
|
|
Laundry Allocation |
|
|
|
<38,300> |
4,596 |
1,149 |
32,555 |
|
Total VOH |
|
$0 |
$0 |
$0 |
$17,910 |
$28,418 |
$350,022 |
|
VOH POR/patient-day |
|
|
|
|
$2.98 |
$9.47 |
$7.00 |
|
Foh Allocations: |
|
|
|
|
|
|
|
|
Budgeted DFOH |
|
$48,000 |
$33,040 |
$59,520 |
$26,958 |
$99,738 |
$344,744 |
|
Meal Capacities |
|
100% |
0% |
0% |
0 % |
18% |
82 |
|
Meal Allocation |
|
<48,000> |
0 |
0 |
0 |
8,412 |
39,588 |
|
File Capacities |
|
|
100% |
0 % |
22% |
33% |
44% |
|
File Allocation |
|
|
<33,040> |
0 |
7,342 |
11,013 |
14,684 |
|
Laundry Capacities |
|
|
|
100% |
13% |
3% |
84% |
|
Laundry Allocation |
|
|
|
<59,520> |
7,738 |
1,786 |
49,997 |
|
Total FOH |
|
$0 |
$0 |
$0 |
$42,038 |
$120,949 |
$449,013 |
|
FOH POR/patient-day |
|
|
|
|
$7.01 |
$40.32 |
$8.98 |
|
TOH Budgeted |
|
$0 |
$0 |
$0 |
$59,947 |
$149,367 |
$799,035 |
|
TOH POR/patient-day |
|
|
|
|
$9.99 |
$49.79 |
$15.98 |
|
|
|
||||||
Because no Cafeteria or Administrative Services costs were allocated to other service departments, the meal rate increased. It now represents a rate based just on the meals eaten in the billing departments. The file and laundry rates decreased from the step method rates, for the same reason (no inter-service allocations). No previous service department costs are included in the direct method rates for these (subsequent) services. The FOH allocations also changed from the step method amounts for the same reason.
The ultimate effect on the VOH, FOH, and TOH PORS appears negligible in this example. But, this may not always be the case. If these allocations are done manually, then the direct method, which is easier, may provide accurate enough PORs and product costs. Alternatively, if a spreadsheet program is used, it takes no more time to input the raw data necessary for the step method. Since it produces more accurate cost allocations and PORs, the step method seems the logical choice.
A word of caution is in order. The spreadsheet program is formatted to display all allocations rounded to the nearest whole dollar. The rate cells are formatted to display dollars and cents. For example, the meal rate is $1.979167. When doing these calculations manually, using $1.98 will produce slightly different amounts. Additionally, this formatting choice appears to create some minor addition errors. For example, the outpatient VOH and FOH really sum to $59,947 (rounded). But, $17,910 + $42,038 = $59,948. The modern management accountant understands that this is not an addition error in the program, and is not bothered by this. It is simply a rounding problem created by the formatting option used and is of no real consequence.
DEMONSTRATION PROBLEM 2 Allocation of budgeted service department costs by the step method.
Using the following new raw data for St. John's Hospital, calculate VOH and FOH PORs for each of its three billing departments. Allocate the variable service department costs using a budgeted rate for each service based on the budgeted cost of the service and budgeted demand. The FOH allocations should be based on relative size ratios.
SOLUTION TO DEMONSTRATION PROBLEM 2
|
Data Section: Budget Allocations At Beginning Of Period (BOP) |
||||||
|
|
Service Departments |
|
|
|
||
|
|
Billing Departments |
|||||
|
|
Cafeteria |
Admin |
Laundry |
Outpatient |
Ob |
General |
|
Budgeted DVOH |
$75,000 |
$8,000 |
$5,000 |
$15,280 |
$5,600 |
$35,120 |
|
Budgeted Meals |
30,000 |
900 |
400 |
0 |
8,000 |
20,700 |
|
Budgeted Files |
|
25,625 |
1,500 |
3,800 |
8,000 |
12,325 |
|
Budgeted Loads |
|
|
11,000 |
2,000 |
2,000 |
7,000 |
|
Budgeted Patient-days |
|
|
|
6,000 |
3,000 |
48,000 |
|
Budgeted Dfoh |
$60,000 |
$17,500 |
$20,000 |
$39,766 |
$99,696 |
$315,038 |
|
Capacity Meals |
50,000 |
1,000 |
500 |
0 |
8,500 |
40,000 |
|
Capacity Files |
|
35,000 |
3,500 |
7,000 |
10,500 |
14,000 |
|
Capacity Loads |
|
|
12,000 |
2,400 |
2,400 |
7,200 |
|
Solution Section: Budget Allocations At Beginning Of Period (Bop) |
|||||||
|
VOH Allocations: |
|
|
|
||||
|
Billing Departments |
|||||||
|
Cafeteria |
Admin |
Laundry |
Outpatient |
Os |
General |
||
|
Budgeted DVOH |
|
$75,000 |
$8,000 |
$5,000 |
$15,280 |
$5,600 |
$35,120 |
|
Meal Rate |
$2.50 |
|
|
|
|
|
|
|
Meal Allocation |
|
<75,000> |
2,250 |
1,000 |
0 |
20,000 |
51,750 |
|
File Rate |
$0.40 |
|
|
|
|
|
|
|
File Allocation |
|
|
<10,250> |
600 |
1,520 |
3,200 |
4,930 |
|
Laundry Rate |
$0.60 |
|
|
|
|
|
|
|
Laundry Allocation |
|
|
|
<6,600> |
1,200 |
1,200 |
4,200 |
|
Total VOH |
|
$0 |
$0 |
$0 |
$18,000 |
$30,000 |
$96,000 |
|
VOH POR/patient-day |
|
|
|
|
$3.00 |
$10.00 |
$2.00 |
|
Foh Allocations: |
|
|
|
|
|
|
|
|
Budgeted DFOH |
|
$60,000 |
$17,500 |
$20,000 |
$39,766 |
$99,696 |
$315,038 |
|
Meal Capacities |
|
100% |
2% |
1% |
0% |
17% |
80% |
|
Meal Allocation |
|
<60,000> |
1,200 |
600 |
0 |
10,200 |
48,000 |
|
File Capacities |
|
|
100% |
10% |
20% |
30% |
40% |
|
File Allocation |
|
|
<18,700> |
1,870 |
3,740 |
5,610 ' |
7,480 |
|
Laundry Capacities |
|
|
|
100% |
20% |
20% |
60% |
|
Laundry Allocation |
|
|
|
<22,470> |
4,494 |
4,494 |
13,482 |
|
Total Foh |
|
$0 |
$0 |
$0 |
$48,000 |
$120,000 |
$384,000 |
|
FOH POR/patient-day |
|
|
|
|
$8.00 |
$40.00 |
$8.00 |
|
TOH Budgeted |
|
$0 |
$0 |
$0 |
$66,000 |
$150,000 |
$480,000 |
|
TOH POR/patient-day |
|
|
|
|
$11.00 |
$50.00 |
$10.00 |
|
|
|||||||
DEMONSTRATION PROBLEM 3 Allocation of actual service department costs by the step method.
Using the following new raw data for St. John's Hospital, allocate actual service department costs to each of its three billing departments. Allocate the actual variable service department costs using a budgeted rate for each service (based on the budgeted cost of the service and budgeted demand from Demonstration Problem 2) and actual demand. The FOH allocations should be based on relative size ratios.
St. John's Hospital Step Method Allocations Year-End Actual Costs Allocations
|
|
Data Section: Actual Cost Allocations At End Of Period (Eop) |
|||||
|
Service Departments |
|
|
|
|||
|
Billing Departments |
||||||
|
|
Cafeteria |
Admin |
Laundry |
Outpatient |
Ob |
General |
|
Actual Dvoh |
$80,000 |
$5,200 |
$5,000 |
$15,000 |
$10,000 |
$25,000 |
|
Actual Meals |
39,250 |
800 |
450 |
0 |
8,000 |
30,000 |
|
Actual Files |
|
18,000 |
1,280 |
4,000 |
1,500 |
11,220 |
|
Actual Loads |
|
|
10,000 |
1,500 |
500 |
8,000 |
|
Actual Patient-days |
|
|
|
6,500 |
4,000 |
45,000 |
|
Actual Dfoh |
$60,000 |
$17,000 |
$22,000 |
$41,766 |
$95,000 |
$340,000 |
SOLUTION TO DEMONSTRATION PROBLEM 3
|
Solution Section: Actual Cost Allocations At End Of Period (Eop) |
|||||||
|
Voh Allocations |
|
|
|
||||
|
Billing Departments |
|||||||
|
Cafeteria |
Admin |
Laundry |
Outpatient |
Ob |
General |
||
|
Actual Dvoh |
|
$80,000 |
$5,200 |
$5,000 |
$15,000 |
$10,000 |
$25,000 |
|
Meal Rate |
$2.50 |
|
|
|
|
|
|
|
Meal Allocation |
|
<98,125> |
2,000 |
1,125 |
0 |
20,000 |
75,000 |
|
File Rate |
$0.40 |
|
|
|
|
|
|
|
File Allocation |
|
|
<7,200> |
512 |
1,600 |
600 |
4,488 |
|
Laundry Rate |
$0.60 |
|
|
|
|
|
|
|
Laundry Allocation |
|
|
|
<6,000> |
900 |
300 |
4,800 |
|
Total Voh |
|
<$18,125> |
$0 |
$637 |
$17,500 |
$30,900 |
$109,288 |
|
Less: Patient Charges |
|
|
|
|
<19,500> |
<40,000> |
<90,000> |
|
Ending Voh Balance |
|
<$18,I25> |
$0 |
$637 |
<$2,000> |
<$9,100> |
$19,288 |
|
Foh Allocations: |
|
|
|
|
|
|
|
|
Actual Dfoh |
|
$60,000 |
$17,000 |
$22,000 |
$41,766 |
$95,000 |
$340,000 |
|
Meal Capacities |
|
1.00% |
2% |
1% |
0% |
17% |
80% |
|
Meal Allocation |
|
<60,000> |
1,200 |
600 |
0 |
10,200 |
48,000 |
|
File Capacities |
|
|
100% |
10% |
20% |
30% |
40% |
|
File Allocation |
|
|
<18,700> |
1,870 |
3,740 |
5,610 |
7,480 |
|
Laundry Capacities |
|
|
|
100% |
20% |
20% |
60% |
|
Laundry Allocation |
|
|
|
<22,470> |
4,494 |
4,494 |
13,482 |
|
Total Foh |
|
$0 |
<$500> |
$2,000 |
$50,000 |
$115,304 |
$408,962 |
|
Less: Patient Charges |
|
|
|
|
<52,000> |
<160,000> |
<360,000> |
|
Ending Foh Balance |
|
$0 |
<$500> |
$2,000 |
<$2,000> |
<$44,696> |
$48,962 |
|
Ending Toh Balance |
|
<$18,125> |
<$500> |
$2,637 |
<$4,000> |
<$53,796> |
$68,250 |
REVIEW QUESTIONS
9.1 What is the overall goal of all CASs?
9.2 Why it is impossible in most situations to design a CAS that provides the true cost of a product or service?
9.3 Is overhead becoming a more or less significant component of the cost of products or services? Why?
9.4 Why do many traditional manufacturing firms only have one TOH account?
9.5 What is the difference between a service department and a production department? Give several examples of both.
9.6 Explain why service department costs are allocated to production departments.
9.7 List five different ways to break down the TOH POR.
9.8 Give four reasons for designing multiple PORs within a CAS.
9.9 Why are departmental predetermined overhead rates usually preferable to a plant-wide blanket rate?
9.10 Can the use of one TOH POR create product cost cross-subsidies?
9.11 Do separate VOH and FOH PORs provide better product costs? Can they provide better cost management information?
9.12 What is the purpose of primary cost allocation? What is the purpose of secondary cost allocation?
9.13 Distinguish between the three stages in overhead cost allocation.
9.14 List three criteria for choosing an overhead allocation basis.
9.15 Develop possible allocation bases for the costs of the service departments identified in Review Question 9.5.
9.16 Describe the direct service department cost allocation method, and list its advantages and disadvantages.
9.17 Describe the step method, and list. its advantages and disadvantages.
9.18 Describe the reciprocal method, and list its advantages and disadvantages.
9.19 Why is a spreadsheet program useful in performing reciprocal service department allocations?
9.20 What are “vicious circles of allocations” and how can one know whether they exist within a spreadsheet program?
9.21 What factors can cause under- or overapplied overhead?
9.22 How can cost variance analysis of overhead costs aid cost management when service departments are present?
9.23 Discuss two reasons why cost variance analysis is difficult when percentages are used to allocate service department total costs.
9.24 What types of level two WIP accounts should he designed into a high-quality CAS?
9.25 Why is group decision making and coordination important in budgeting VOH PORs?
9.26 How can some costs be direct costs of a department but indirect costs of a product?
9.27 A high-quality CAS develops budgeted rates for variable service department costs. Why?
9.28 How is a budgeted variable rate for a service department developed?
9.29 Why are relative size ratios used to allocate fixed service department costs?
9.30 How is a relative size ratio calculated?
9.31 Can cost equations represent contracts between the providers of services and the users of services?
9.32 How are budgeted rates used to allocate actual service department variable costs?
9.33 Describe how the allocation of variable service department costs can isolate spending and usage variances in the proper responsibility centers.
9.34 Which variances appear in the ending VOH account balances of service and producing departments?
9.35 Why are actual fixed service department costs not allocated to the departments using that service?
9.36 How can fixed service department costs be allocated so that their spending variances are properly assigned to responsibility centers?
9.37 Which variances comprise the ending FOH balances of service and production department FOH accounts?
9.38 Why are FOH PORs needed for production departments but not for service departments?
9.39 What design changes would be made for an SCAS (versus a normal CAS)?
9.40 How many cost variance accounts should be included in a high-quality SCAS?
CHAPTER-SPECIFIC PROBLEMS
These problems require responses based directly on concepts and techniques presented in the text.
9.41 Multiple-choice questions concerning service department allocations.
1. Allocation of service department costs to production departments is necessary to:
a. Predict costs.
b. Coordinate production activity.
c. Determine predetermined overhead rates.
d. All of the above.
2. The overhead cost allocation method that usually starts with the service department rendering services to the greatest number of other service departments and progresses in descending order to the service department rendering service to the smallest number of other service departments is the:
a. Step method.
b. Direct method.
c. Reciprocal method.
d. Partial method.
3. The overhead cost allocation method that allocates service department costs without consideration of services rendered to other service departments is the:
a. Direct method.
b. Reciprocal method.
c. Step method.
d. POR method.
4. The most accurate method for allocating service department costs is the:
a. Step method.
b. Direct method.
c. Reciprocal method.
d. None of the above.
5. The method that recognizes service provided by one service department to another but does not recognize reciprocal interdepartmental service is the:
a. Direct method.
b. Reciprocal method.
c. Simultaneous equation method.
d. Step method.
6. The janitorial department provides cleaning services to all departments of a large store. Management wishes to allocate the janitorial costs to the various sales departments that benefit from this service. What would be the most reasonable allocation base for janitorial services?
a. Sales of each department.
b. Number of employees in each department.
c. Square footage of each department.
d. Number of inventory items.
7. The function of a cost allocation base is to:
a. Estimate service department costs.
b. Allocate costs.
c. Develop a cost object.
d. Divide conversion costs.
8. Why are predetermined overhead rates used?
a. To budget overhead costs.
b. To smooth seasonal variability of overhead costs.
c. Allow timely product and service costing,
d. Both (b) and (c).
9. It is proper to allocate variable and fixed elements of overhead costs by individual predetermined overhead rates for:
a. Service departments to production departments.
b. Production departments to the final output units of products and services.
c. Both (a) and (b),
d. None of the above.
9.42 Departmental predetermined overhead rates. [AICPA adapted] Tillman Corporation has two production departments, M and A. Budgeted manufacturing costs for the year were as follows:
|
|
Department M |
Department A |
|
Direct materials |
$700,000 |
$100,000 |
|
Direct labor |
200,000 |
800,000 |
|
Manufacturing overhead |
600,000 |
400,000 |
The actual material and labor costs charged to job 432 during the year were as follows:
|
Direct materials |
|
$25,000 |
|
Direct labor: Department M |
$ 8,000 |
|
|
Department A |
12,000 |
$20,000 |
Tillman applies manufacturing overhead to production orders on the basis of direct labor cost using departmental rates predetermined at the beginning of the year based on the annual budget.
Required: Determine the total annual manufacturing costs associated with job 432.
9.43 Allocation of service department costs by the direct and step methods. [AICPA adapted] Thomas Manufacturing Company has two producing departments, Fabrication and Assembly, and three service departments, General Factory Administration, Factory Maintenance, and Factory Cafeteria. A summary of costs and other data for each department prior to allocation of service department costs for the year ended June 30, 20x2, follows:
|
|
Producing Departments |
|
|
|
Fabrication |
Assembly |
|
Direct labor costs |
$1,950,000 |
$2,050,000 |
|
Direct materials costs |
3,130,000 |
950,000 |
|
Factory overhead costs |
1,650,000 |
1,850,000 |
|
Direct labor hours |
562,500 |
437,500 |
|
Number of employees |
280 |
200 |
|
Square footage occupied |
88,000 |
72,000 |
|
|
Service Departments |
||
|
|
General Factory Administration |
Factory Maintenance |
Factory Cafeteria |
|
Direct labor costs |
$90,000 |
$82,100 |
$87,000 |
|
Direct materials costs |
- |
65,000 |
91,000 |
|
Factory overhead costs |
70,000 |
56,100 |
62,000 |
|
Direct labor hours |
31,000 |
27,000 |
42,000 |
|
Number of employees |
12 |
8 |
20 |
|
Square footage occupied |
1,750 |
2,000 |
4,800 |
The costs of General Factory Administration, Factory Maintenance, and Factory Cafeteria are allocated on the basis of direct labor hours, square footage occupied, and number of employees, respectively. Round all final calculations to the nearest dollar.
Required:
a. Assuming that Thomas Manufacturing Company elects to distribute service department costs directly to the producing departments without inter-service department cost allocation, compute the amount of Factory Maintenance costs that would be allocated to production departments.
b. Assuming the same policy of allocating service department costs to producing departments only, compute the amount of General Factory Administration costs that would be allocated to production departments.
c. Assuming that Thomas Manufacturing Company elects to distribute service department costs to other service departments (starting with the service department with the greatest total costs) as well as to the producing departments and that once a service department's costs have been allocated, no subsequent service department costs are recirculated back to it, compute the total costs for the production departments after the allocation of service department costs.
9.44 Allocation of service department costs by the step and reciprocal methods. Departments A, B, and C provide services to each other and to production departments Y and Z in the following manner:
|
|
|
Service Departments |
Production Departments |
|||
|
TOTAL COST |
|
A |
B |
C |
Y |
Z |
|
$100,000 |
A |
|
15% |
5% |
55% |
25% |
|
75,000 |
B |
10% |
|
9% |
18% |
63% |
|
60,000 |
C |
- |
|
|
30% |
70% |
|
$235,000 |
|
|
|
|
|
|
Required: Make the proper cost allocations using the step method.
9.45 Reciprocal allocations. You have been provided with the following equations, which represent total costs for each department (D, through D5) at Crystal-Glo Corporation:
|
D1 = |
|
(0.00)D2 |
+ 0.00)D3 |
+ (0.00)D4 |
+ (0.00)D5 |
+ $22,000 |
|
D2 = |
(0.25)D1 |
|
+ (0.04)D3 |
+ (0.00)D4 |
+ (0.00)D5 |
+ $18,000 |
|
D3 = |
(0.20)D1 |
+ (0.40)D2 |
|
+ (0.00)D4 |
+ (0.00)D5 |
+ $15,000 |
|
D4 = |
(0.15)D1 |
+ (030)D2 |
+ (0.36)D3 |
|
+ (0.00)D5 |
+ $14,400 |
|
D5 = |
(0.40)D1 |
+ (0.30)D2 |
+ (0.60)D3 |
+ (0.00)D4 |
|
+ $65,000 |
Required: Use the reciprocal method to allocate costs between the five departments. Primary costs are given in dollars.
9.46 Allocation of service department costs using the direct step, and reciprocal methods. [AICPA adapted] Hartwell Company distributes service department overhead costs directly to producing departments without allocation to the other service departments. Information for the month of January follows:
|
|
Maintenance |
Utilities |
|
Overhead costs incurred |
$18,700 |
$9,000 |
|
Service provided to: |
|
|
|
Maintenance Department |
|
10% |
|
Utilities Department |
20% |
|
|
Producing Department A |
40% |
30% |
|
Producing Department B |
40% |
60% |
Required:
a. Under the direct method, what should be the amount of Utilities Department costs allocated to Producing Department B for January?
b. Under the step method, how much of Hartwell's Utilities Department cost is allocated between Departments A and B?
c. Under the reciprocal method, what would be the formula to determine the total maintenance costs?
d. Under the reciprocal method, what would be the formula to determine the total utilities costs?
9.47 Allocation of service department costs using the direct method. A hospital has a $100,000 expected utility bill this year. The Janitorial, Accounting, and Orderlies Departments are service functions to the Operating, Hospital Rooms, and Laboratories Departments. Floor space is assigned to each department as follows:
|
Department |
Square Footage |
|
Janitorial |
1,000 |
|
Accounting |
2,000 |
|
Orderlies |
7,000 |
|
Operating |
4,000 |
|
Hospital Rooms |
30,000 |
|
Laboratories |
6,000 |
|
|
50,000 |
Required: How much of the $100,000 will eventually become the Hospital Rooms Department total costs, assuming a direct allocation based on square footage? [CIA adapted]
9.48 Service department allocations with separate VOH and FOH PORs. Illinois Electric produces electricity from the Chicago River. The electricity is carried over electric lines to four branch stations. Using the information below and the step method, calculate VOH and FOH PORs based on DLhr for each branch station.
|
DATA SECTION: BUDGETED VARIABLE AND FIXED OVERHEAD COSTS |
|||||
|
|
|
|
|
|
|
|
|
|
Branches |
|||
|
|
Electric Costs |
Rockford |
Peoria |
Hammond |
Kankakee |
|
Budgeted Direct Voh |
$6,000 |
$25,000 |
$30,000 |
$20,000 |
$ 15.000 |
|
Budgeted Usage (Kwh) |
30,000 |
8,000 |
9,000 |
7,000 |
6,000 |
|
Budgeted Dlhrs |
|
266,000 |
3,180 |
107,000 |
8,100 |
|
|
|
|
|
|
|
|
Budgeted Direct Foh |
$9,000 |
$130,000 |
$145,000 |
$90,000 |
$150,000 |
|
Capacity Usage (Kwh) |
50,000 |
10,000 |
20,000 |
12,000 |
8,000 |
9.49 Service department allocations with separate VOH and FOH PORs. During July,
the Maintenance Department of WonderWorks, Inc., budgeted variable costs of $9,000 and fixed costs of $4,500. The Maintenance Department serves three production departments: Grinding, Polishing, and Assembly. Maintenance direct labor hours are used to allocate its overhead to the production departments. The following information is available:
|
|
Grinding |
Polishing |
Assembly |
|
Budgeted DLhr |
300 |
200 |
400 |
|
Capacity DLhr |
500 |
600 |
400 |
|
Primary VOH |
$3,000 |
$4,000 |
$5,000 |
|
Primary FOH |
$6,000 |
$7,000 |
$8,000 |
|
Budgeted machine hours |
1,000 |
800 |
2,000 |
Required: Calculate the VOH and FOH PORs for each production department using machine hours as the PORs' allocation basis.
9.50 Single and separate allocations of budgeted service department costs. During April, the Accounts Receivable Department budgeted $20,000 in variable costs and $50,000 in fixed costs. Credit sales of the four retail branches are used to allocate these costs. Budgeted credit sales information includes the following:
|
|
Uptown |
Downtown |
Eastside |
Westside |
|
Budgeted for April |
$20,000 |
$100,000 |
$40,000 |
$40,000 |
|
Maximum potential sales |
75,000 |
120,000 |
60,000 |
45,000 |
Required:
a. Determine the budgeted costs to be allocated to each store assuming total Accounts Receivable costs are allocated based on one rate.
b. Determine the budgeted costs to be allocated to each store using a separate variable cost rate and relative size ratios for fixed costs.
THINK-TANK PROBLEMS
Although these problems are based on chapter material, reading extra material, reviewing previous chapters, and using creativity may be required to develop workable solutions.
9.51 Ethical considerations in overhead allocation. In Chapter 1, four ethical standards for management accounting were identified. What are the implications of each in designing an overhead allocation system?
9.52 High-quality information about overhead. Consider each characteristic of high-quality information presented in Chapter 1. What implications does each have for the design of a high-quality CAS for reporting overhead?
9.53 Service departments and JITs. Design a WIP general ledger system for a JIT. The CAS should be high quality. Consider the value of service department allocations to JIT cells and the need for service department cost variance information. If you do not believe allocations should be made to JIT cells or believe that cost variance information is not needed, then what information should be provided by the CAS, to whom, and how?
9.54 Backflush systems and service departments. Review backflush systems in Chapter 8. If services exist, can a high-quality backflush system be designed to account for them?
9.55 Spreadsheet programs for budgeted service department allocations. Construct a spreadsheet program that will perform step method allocations for calculating VOH and FOH PORs. Variable service department costs should be allocated based on the budgeted rates developed_ Fixed costs should be allocated using relative size ratios. Test your program using the information from Demonstration Problem 2.
9.56 Spreadsheet programs for actual service department cost allocations. Construct a spreadsheet program that will perform step method allocations for actual VOH and FOH costs. Test the program using the information front Demonstration Problems 2 and 3.
9.57 Spreadsheet programs for direct method allocations. Using the information from Demonstration Problems 2 and 3, construct a spreadsheet program that will perform direct method allocations for budgeted and actual service department costs. Variable and fixed costs should be allocated separately as was done in Demonstration Problem 1.
9.58 Comprehensive allocation of costs. Barnes Company has two service departments and three production departments, each producing a separate product. For a number of years, Barnes has allocated service department costs to the production departments on the basis of the annual sales revenue dollars. In a recent audit report, the internal auditor stated that the distribution of service department costs on the basis of annual sales dollars would lead to serious inequities. The auditor suggested that maintenance and engineering service hours would be a better service cost allocation basis. For illustrative purposes, the following information was appended to the audit report:
|
|
Service Departments |
Production Departments |
|||
|
|
Maintenance |
Engineering |
Product A |
Product B |
Product C |
|
Maintenance hours used |
- |
400 |
800 |
200 |
200 |
|
Engineering hours used |
400 |
- |
800 |
400 |
400 |
|
Department direct costs |
$12,000 |
$54,000 |
$80,000 |
$90,000 |
$50,000 |
Required:
a. Using the direct method, how much maintenance cost is allocated to the Engineering Department?
b. Using the direct method, how much maintenance cost is allocated to Department C?
c. Using the direct method, how much engineering cost is allocated to Department A?
d. Using the step method and allocating maintenance first, how much maintenance cost is allocated to the Engineering Department?
e. Using the step method and allocating maintenance first, how much maintenance cost is allocated to Department B?
f. Using the step method and allocating maintenance first, how much engineering cost is allocated to Department B?
g. Using the step method and allocating maintenance first, how much engineering cost is allocated to Department C?
h. Using the step method, what is the total amount of service department costs allocated to Department A?
[CIA adapted]
9.59 Comprehensive allocation of costs. [CMA adapted]The managers of Rochester Manufacturing are discussing ways to allocate the cost of service departments such as Quality Control and Maintenance to the production departments. To aid them in this discussion, the controller has provided the following information:
|
|
Quality Control |
Maintenance |
Machining |
Assembly |
Total |
|
Budgeted overhead costs before allocation |
$350,000 |
$200,000 |
$400,000 |
$300,000 |
$1,250,000 |
|
Budgeted machine hours |
- |
- |
50,000 |
- |
50,000 |
|
Budgeted direct labor hours |
- |
- |
- |
25,000 |
25,000 |
|
Budgeted hours of service: Quality Control |
|
7,000 |
21,000 |
7,000 |
35,000 |
|
Maintenance |
10,000 |
- |
18,000 |
12,000 |
40,000 |
Required:
a. If Rochester Manufacturing uses the direct method of allocating service department costs, what would be the total service costs allocated to the Assembly Department?
b. Using the direct method, what would be the total amount of overhead allocated to each machine hour?
c. Using the step method and beginning with Quality Control, what is the amount of maintenance costs allocated to the Assembly Department?
d. Using the reciprocal method, what is the total amount of Quality Control costs (rounded to the nearest dollar) allocated to other departments?
9.60 Development of predetermined overhead rates. [CMA adapted] Marfrank Corporation is a manufacturing company with six functional departments-Finance, Marketing, Personnel, Production, Research and Development (R&D), and Information Systems-each administered by a vice president. The Information Systems Department (ISD) was established in 20x3 when Marfrank decided to acquire a new mainframe computer and develop a new information system.
While systems development and implementation is an ongoing process at Marfrank, many of the basic systems needed by each of the functional departments were operational at the end of 20x4. Thus, calendar year 20x5 is considered the first year when the ISD costs can be estimated with a high degree of accuracy. Marfrank's president wants the other five functional departments to be aware of the magnitude of the ISD costs by reflecting the allocation of ISD costs in the reports and statements prepared at the end of the first quarter of 20x5. The allocation of ISD costs to each of the departments was based on their actual use of ISD services.
Jon Werner, vice president of ISD, suggested that the actual costs of ISD be allocated on the basis of pages of actual computer output. He suggested this basis because all of the departments use reports in evaluating their operations and making decisions. The use of this basis resulted in the following allocation:
|
Department |
Percentage |
Allocated Cost |
|
Finance |
50% |
$112,500 |
|
Marketing |
30 |
67,500 |
|
Personnel |
9 |
20,250 |
|
Production |
6 |
13,500 |
|
R&D |
5 |
11,250 |
|
Totals |
100% |
$225,000 |
After the quarterly reports were distributed, the Finance and Marketing Departments objected to this allocation method. Both departments recognized that they were responsible for most of the output in terms of reports, but they believed that these output costs might be the smallest of ISD costs and requested that a more equitable allocation basis be developed.
After meeting with Werner, Elaine Jergens, Marfrank's controller, concluded that 1SD provided three distinct services-systems development, computer processing represented by central processing unit (CPU) time, and report generation. She recommended that a predetermined rate he developed for each of these services from budgeted annual activity and costs. The ISD costs would then be assigned to the other functional departments using the predetermined rate times the actual activity used. Any difference between actual costs incurred and costs allocated to the other departments would be absorbed by ISD.
Jergens and Werner concluded that systems development could he charged on the basis of hours devoted to systems development and programming, computer processing based on CPU time used for operations (exclusive of database development and maintenance), and report generation based on pages of output. The only cost that should not he included in any of the predetermined rates would be purchased software; these packages were usually acquired for a specific department's use. Thus, Jergens concluded that purchased software would be charged at cost to the department for which it was purchased. In order to revise the first quarter allocation, Jergens gathered the information on ISD costs and services shown on the next page:
|
|
Information Systems Department Costs |
||||
|
|
Estimated Annual costs |
Actual first quarter Costs |
Percentage Devoted To |
||
|
Systems Development |
Computer Processing |
Report generation |
|||
|
Wages and benefits Admin. |
$100,000 |
$ 25,000 |
60% |
20% |
20% |
|
Computer operators |
55,000 |
13,000 |
|
20 |
80 |
|
Analysts/programmers |
165,000 |
43,500 |
100 |
|
|
|
Maintenance Hardware |
24,000 |
6,000 |
|
75 |
25 |
|
Software |
20,000 |
5,000 |
|
100 |
|
|
Output supplies |
50,000 |
11,500 |
|
|
100 |
|
Purchased software |
45,000 |
16,000* |
|
- |
- |
|
Utilities |
28,000 |
6,250 |
|
100 |
|
|
Depreciation |
|
|
|
|
|
|
Mainframe computer |
325,000 |
81,250 |
|
100 |
|
|
Printing equipment |
60,000 |
15,000 |
|
|
100 |
|
Building improvements |
10,000 |
2,500 |
|
100 |
|
|
Total department costs |
$882,000 |
$225,000 |
|
|
|
|
*Note: All software purchased during the first quarter of 20x5 was for the benefit of the Production Department. |
|||||
|
|
Information Systems Department Services |
||
|
|
Systems Development |
Computer Operations (Cpu) |
Report Generation |
|
Annual capacity |
4,500 hours |
360 CPU hours |
5,000,000 pages |
|
Actual usage during first quarter, 20x5 |
|
|
|
|
Finance |
100 hours |
8 CPU hours |
600,000 pages |
|
Marketing |
250 hours |
12 CPU hours |
360,000 pages |
|
Personnel |
200 hours |
12 CPU hours |
108,000 pages |
|
Production |
400 hours |
32 CPU hours |
72,000 pages |
|
R&D |
50 hours |
16 CPU hours |
60,00 pages |
|
Total usage |
1,000 hours |
80 CPU hours |
1,200,000 pages |
Required:
a.
1.. Develop predetermined rates for each of the service categories of ISD systems development, computer processing, and report generation.
2.. Using the predetermined rates developed in Requirement (a)1, determine the amount each of the other five functional departments would be charged - for services provided by ISD during the first quarter of 20x5.
b. With the method proposed by Elaine Jergens for charging the ISD costs to the other five functional departments, there may be a difference between ISD's actual costs incurred and the costs assigned to the five user departments.
1.Explain the nature of this difference.
2.Discuss whether Jergens's proposal will improve cost control in ISD.
3.Explain whether Jergens's proposed method of charging user departments for ISD costs will improve planning and control in the user departments.