Chapter 10 : The Activity-based Costing System
LEARNING OBJECTIVES
After studying this chapter, you should be able to:
1 Define activity-based costing systems
2 Contrast traditional volume-based costing systems
3 Explain how to develop activity-based costing systems
4 Discuss how activity-based costing systems are used in service organizations
INTRODUCTION
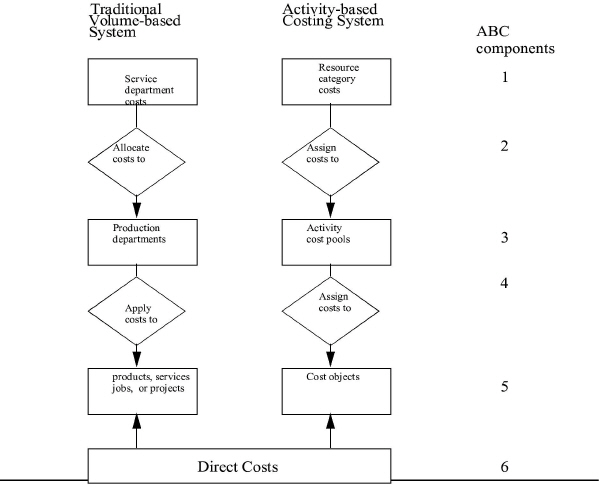
In general terms, the traditional volume-based costing system is shown on the left in Exhibit 10-1
|
, and the activity-based costing system is shown on the right. Both costing systems use a conventional two-stage process for assigning overhead costs to products, services, jobs, projects, or other cost objects.
This chapter focusses on the original ABC model, which was the most accurate. In the years since the original development of ABC, it has become clear that one flaw in ABC is that it can become more and more accurate, and complex every year without becoming more useful. Why? Because accuracy is NOT a “normal” good. So, in the last ten years or so, there has been a great deal of effort spent to “control” the tendency of ABC systems to become bloated and loose usefulness. One drawback of the recent developments is that they reduce accuracy as part of their “control”. So, for the bulk of this chapter we will focus on accuracy as our reason for studying ABC.
Under the traditional volume-based costing system, the second-stage cost driver is usually a predetermined overhead rate (POR) or multiple PORs with direct labor hours, direct labor dollars, machine hours, or materials dollars as the base (or denominator). The more units of a particular product that are produced, the more overhead costs are applied to the units. No matter what base is used, they all apply overhead costs in strict proportion to production volume.
The idea behind activity-based costing is that cost objects, which can be products, services, jobs, units, batches, customers, or anything the management accountant is trying to cost, consume activities. In turn, activities consume resources. Activity drivers measure the activities consumed, and resource drivers measure the resources consumed.
Activity-based costing systems try to determine what is really driving costs and charge a cost object for only the overhead it actually consumes. If, for example, 1,000 units of product A and 100 units of product B are produced, the traditional volume-based costing system will apply 10 times the overhead costs to product A relative to product B. But product A may not have used 10 times the overhead costs. Product B, being a more complex product with many special features, may have actually consumed most of the overhead costs because it required more support, such as setups, engineering changes, material purchasing, storing, handling, and so forth.
The accuracy of costing systems has become a matter of serious concern in some firms. Managers believe that their costing systems are grossly underestimating the cost of low-volume products and overestimating the cost of high-volume products. Production managers believe that certain products are not “earning their keep” because they are difficult to produce and thus place severe demands on resources and activities. But, with traditional volume-based costing systems, these difficult-to-produce products are reported as the most profitable. Managers in some construction firms, as well as in other firms that bid on customized jobs, are also concerned by the failure of their costing systems in developing winning bids. Examples of companies that have implemented activity-based costing systems are Caterpillar, General Dynamics, General Motors, Hewlett-Packard, Martin Marietta, and Siemens.
The concept of activity-based costing is simple and intuitively attractive to managers and workers who do not have an accounting background. It provides designers of costing systems new ways to cost products and services, modify behavior, and focus management attention on matters of strategic importance.1
DEFINING ACTIVITY-BASED COSTING
LEARNING OBJECTIVE 1
Define activity-based costing systems.
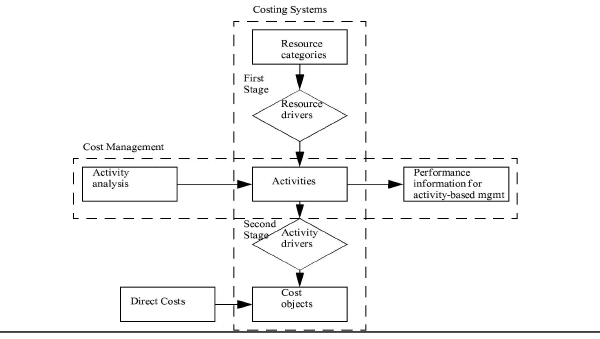
Activity-based costing (ABC) is the collection of financial and nonfinancial data about an enterprise's activities for two primary purposes:
• Costing the enterprise's cost objects
• Providing information for effective cost management through activity-based management
Exhibit 10-2
|
shows how ABC works to achieve these two purposes.
Activity analysis is the process of defining and describing activities and their corresponding cost drivers (i.e., resource drivers and activity drivers). Defining activities and cost drivers is the key to building an activity-based costing system. In turn, the ABC system is linked to activity-based management. Activity-based management (ABM) uses ABC information to support cost management via continuous improvement or to serve as a guide in completely reengineering activities (i.e., redesigning and rebuilding activities that are operating inefficiently and ineffectively) of the enterprise. Activities and cost drivers are the building blocks of all business processes and operations, so understanding them and their performance is essential to implementing sound cost management practices. Activity-based management is covered in Chapter 11.
Defining the Components of Activity-Based Costing Systems
An activity-based costing system includes six components:
• Resource categories
• First-stage resource drivers
• Activities and activity cost pools
• Second-stage activity drivers
• Cost objects
• Direct cost inputs
RESOURCE CATEGORIES. Resource categories represent the sources of costs that support activities. For example, “repairing automobile transmissions” is an activity in a repair shop. Specific mechanics, helpers, tools, utilities, and building space are resources that support this activity.
Typical resources in a manufacturing enterprise include the following:
• Procurement and various material handling and storage resources
• Office space and furniture and fixtures
• Equipment including production machines, transportation equipment, and information technology
• Utilities
• Salaries and benefits
• Buildings
• Accounting
• Engineering
• Insurance, licenses, and taxes
Normally, resources are expressed as cost elements within a chart of accounts or as a list of budgetary items in a budget. When a resource is dedicated to a single activity, assigning costs to the activity to form an activity cost pool is relatively simple. When a resource supports several activities, however, the resource consumption must be assigned among appropriate activities using a first-stage resource driver.
FIRST-STAGE RESOURCE DRIVERS. Activities drive the cost of resources. Therefore, first stage resource drivers are used to assign resource costs to activities, thereby forming activity cost pools that contain their proper share of resource costs.
The resource driver establishes a relationship between resource costs and activity cost pools based on some measure of usage. For example, headcount measures the usage of salary costs, square feet measure the usage of office occupancy costs, and hours (e.g., CPU hours) measure the usage of computer costs. Assignments of these costs represent a clear cause-and-effect relationship.
ACTIVITIES AND ACTIVITY COST POOLS. An activity is what an organization does to convert inputs to outputs. It is an aggregation of highly related tasks that perform work in an organization.
Activities are “natural” identifiers, because they are easily understood by such diverse groups as engineers, production and logistics people, marketers, accountants, and top management. Thus, by corresponding to familiar terms and processes, activities provide an effective medium for communication between accounting and operating personnel.
Activities are costed first. The result of assigning resource costs to an activity is an activity cost pool. Often, the terms “activity” and “activity cost pool” are used interchangeably. In any event, the costs assigned to activity cost pools are in turn assigned to cost objects using an activity driver.
Activity-based costing systems assume that the costs of activities are variable, even though this assumption does not exactly hold true in practice. Cost inputs to activities are usually acquired or eliminated in large “chunks.” For example, a whole machine is purchased, not 10 percent of a machine. As a result, the costs of these inputs do not vary smoothly according to the activities consumed. The reported product or service costs are therefore linear approximations to what are typically a series of step functions.
SECOND-STAGE ACTIVITY DRIVERS. The costs in activity cost pools are assigned to the cost objects by means of activity drivers. The second-stage activity drivers arc measures of the consumption of the activity cost pools by cost objects. Like the first-stage resource driver, the second-stage activity driver must capture a cause-and-effect relationship. In this case, the relationship is between the activity cost pools and the cost objects.
COST OBJECTS. Cost objects are the point to which activity costs are assigned. A cost object can be almost anything the designer wants it to be. The following are typical cost objects:
• Products
• Services
• Units
• Batches
• Contracts a Cases
• Jobs
• Projects
• Customers
• Customer groups
• Distribution channels
• Sales territories
Ultimately, activities are performed in order to manufacture products, render services (e.g., contracts, cases, jobs, projects), or support customers.
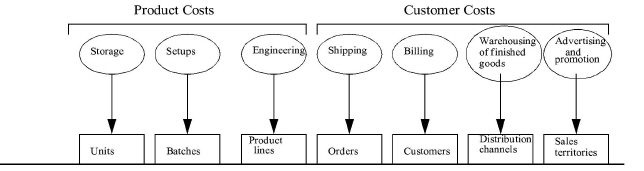
In some ABC systems, costs are assigned to different types of cost objects at different levels. For example, a batch is a higher-level cost object than a single unit of a product, where x number of units make up a batch of the particular product. A sales territory is a higher-level cost object than a customer. The number of levels of cost assignment varies from one enterprise to the next. Exhibit 10-3
|
, however, generally describes most manufacturing enterprises.
Product-driven activity costs are typically assigned at three levels through the use of activity drivers: the unit-level, batch-level, and product-level. Costs such as direct materials, direct labor, and storage costs are assigned on the basis of a unit of product. Costs of setups are usually assigned in terms of a batch of units of a particular product line. For example, tools and dies are set up to produce a batch of 1,000 units of product A. The product, such as product A, represents a specific product line. When an engineering change is made, it is therefore applicable to the product line.
It makes sense to keep activities of different levels separate because the costs of activities at different levels vary in response to different factors. For example, the cost of the batch-level activity setup varies with the number of batches. By contrast, the cost of a product-level activity such as engineering changes varies with the number of different product lines. Product A, for example, may require many more engineering changes than product B.
The number of levels of cost objects related to customer activities will vary among companies. Typically, there are four levels, such as order-level, customer-level, distribution channel-level, and sates territory-level. In some instances, several cost objects may occur at the same level. For example, a company may have several distribution channels, such as wholesalers, retailers, jobbers, and cooperatives, each of which would be treated as a cost object at the same level.
DIRECT COST INPUTS. Direct cost inputs are cost elements that are easily traced to cost objects. For example, a bill of materials and materials requisitions are used to trace direct materials costs to a specific cost object; that is, to a unit of product.
In some situations, especially where direct labor monitors automated processes, maintains equipment, and is salary-based, the only direct cost element is direct materials. At the other extreme, there are instances where three direct cost elements are used as direct cost inputs:
• Direct materials
• Direct labor
• Direct technology (or equipment)
Therefore, costs can be assigned to cost objects in four ways:
1. All costs are assigned to activity cost pools, and the activity costs are assigned to cost objects via appropriate activity drivers. This approach is applicable to some service organizations. The costing formula is:
Cost object = Costs assigned from activity cost pools
2. All costs except direct materials costs are assigned to activity cost pools, and the activity costs are assigned to cost objects via appropriate activity drivers. This approach is applicable to manufacturing enterprises in which “direct” labor has become “indirect” and technology costs cannot be traced directly to cost objects. The costing formula is:
Cost object = Direct materials + Costs assigned from activity cost pools
In enterprises that are automated, “direct” labor is usually engaged in setups, loading machines, maintenance, troubleshooting, and supervisory activities rather than actually performing work on the product. Moreover, workers frequently work on several products at the same time, making it impossible to trace labor hours intelligently to products.2
3. All costs except direct materials and direct labor costs are assigned to activity cost pools, and the activity costs are assigned to cost objects via appropriate activity drivers. This approach is applicable in any organization in which direct materials and direct labor costs are easily traced to cost objects. The costing formula is:
Cost object = Direct materials + Direct labor + Costs assigned from activity cost pools
This costing approach uses the three cost elements covered in previous chapters:
• Direct materials
• Direct labor
• Overhead
Although many organizations that use this approach have substantial technology costs, such costs are not easily traced to cost objects. These technology costs are therefore assigned to activity cost pools via resource drivers; then, the activity costs are assigned to cost objects via activity drivers.
4. All costs except direct materials, direct labor, and direct technology (or equipment) are assigned to activity cost pools, and the activity costs are assigned to cost objects via appropriate activity drivers. This approach is applicable to any organization in which direct materials, direct labor, and direct technology costs are easily traced to cost objects. Construction companies and manufacturing enterprises using separate manufacturing cells for specific products can use this approach. The costing formula is:
Cost object = Direct materials + Direct labor + Direct technology + Costs assigned from activity cost pools
Since technology costs are both a significant determinant of the cost of cost objects and a key factor in corporate decision making, accounting for this cost element treats technology as a direct cost element on the same level as direct materials and direct labor. If machinery, equipment, and various pieces of technology that one would find in a highly automated plant or typical construction company can be traced directly to the product, service, job, or project cost object, then “direct technology” should be treated as a separate direct cost element.
A rule of thumb in developing an ABC system is to first identify all costs that can be traced directly to cost objects. Then, all other costs are assigned to activity pools.
A Simple Example of How Activity-Based Costing Works
Exhibit 10-4
|
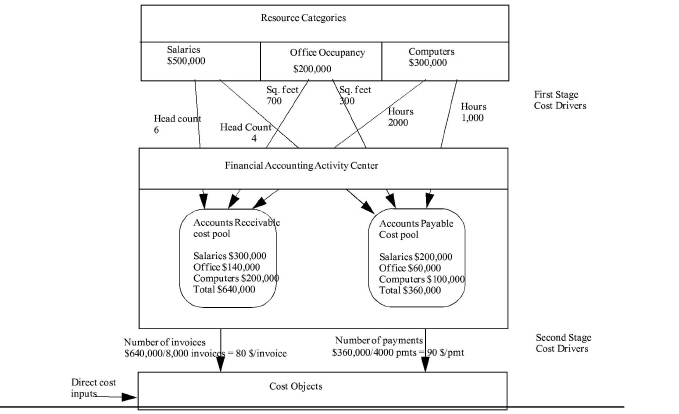
illustrates a simple ABC system that is used to assign financial accounting costs for accounts receivable and accounts payable activity costs to cost objects.
The resource categories in this example include three budgeted items:
• Salaries at $500,000
• Office occupancy at $200,000
• Computers at $300,000
These resource costs are assigned to the two activity cost pools using the following resource drivers:
• Headcount assigns salaries to each activity cost pool on the basis of the number of people who work there.
• Office occupancy costs are assigned to each activity cost pool based on the number of square feet occupied by each activity (i.e., accounts receivable and accounts payable).
• The number of computer hours (e.g., CPU hours) consumed by each activity is used to assign computer costs to each activity cost pool.
The accounts receivable cost pool and the accounts payable cost pool are aggregated into the financial accounting activity center, because they are highly related to it. Other activity cost pools, such as a payroll cost pool, financial reporting cost pool, and so forth, might also be added.
An activity center represents an aggregation of related, function-specific activities. The sum of costs in the activity cost pools aggregated in an activity center equals the total costs associated with that activity center. In the example, the total costs assigned to the financial accounting activity center are $1,000,000.
Activity centers are only indirectly involved in the assignment of costs to cost objects. Nevertheless, activity centers do play an important role in the design of most ABC systems. For example, an activity center may correspond to a responsibility center where a particular manager is responsible for all the activity cost pools aggregated in that activity center. In other words, an activity center is a manageable set of related activity cost pools. In some instances, an activity center may be a traditional department, such as the financial accounting department. In small companies, the activity cost pools may stand alone and not be aggregated in activity centers.
The second-stage activity drivers are used to assign the accounts receivable cost pool and the accounts payable cost pool to cost objects. The number of invoices processed drives the accounts receivable cost pool and is therefore a reasonable device to assign these costs to cost objects. Likewise, the number of payments serves as an appropriate activity driver to assign the accounts payable cost pool to cost objects.
The direct cost inputs are other costs that can be directly traced to cost objects. Such direct cost elements include the following:
• Direct materials
• Direct labor
• Direct technology (or direct equipment)
The example in Exhibit 10-4 did not have any of these direct cost elements. All costs related to the financial accounting activity were included in the accounts receivable cost pool and the accounts payable cost pool.
Additional Factors to Consider When Selecting Cost Drivers
Cost drivers can be:
• Transaction-based
• Time-based
• Dollar-based
• Percentage-based
As a rule of thumb, the appropriate cost driver (i.e., resource driver and activity driver) is one that represents the primary output of the activity. In other words, a direct cause-and-effect relationship exists between changes in the cost driver and costs of the activity. In many instances, a cost driver that captures the number of activity transactions rather than the duration or dollar amount of activity transactions is preferable because it:
• Is readily available
• is easy to understand, measure, and apply
• Induces beneficial behavior
Substituting cost drivers that capture the number of transactions generated by an activity rather than the duration of the activity is an important technique for reducing measurement cost. The data required for these transaction-based cost drivers are readily available, because a transaction is generated every time the activity is performed. For example, a materials requisition is required every time materials move from RMI to the factory floor.3
Transaction-based cost drivers are not always appropriate, however. For example, if the inspection activity takes varying amounts of time, using “number of inspections” or “number of inspection reports” as an activity driver instead of “actual inspection hours” probably will distort product or service costs. A product or service that requires much inspection time is likely to be undercosted, whereas a product or service that requires little inspection time will be overcosted. How well a given activity driver captures the actual consumption of activity costs by a particular product or service is measured by the correlation between the quantities traced to the product or service and the actual quantities the product or service consumed.4
The effect that the use of a particular cost driver has on people's behavior must also be considered in selecting cost drivers. As a general rule, people will behave in accordance with how they are being evaluated, as shown in the case on the next page. If the cost driver is used for performance evaluations, then its behavioral effects should be taken into account.
Behavioral effects can be either beneficial or harmful, depending on whether the cost driver motivates people to behave in a way that will help the enterprise achieve its goals or in a way that is undesirable or dysfunctional. For example, a company that wants to reduce the number of unique parts that it processes in order to simplify activities, such as vendor selection, purchasing, inspection, maintenance of the bill of materials, storage, and accounting, may decide to apply the costs of these activities using “number of part numbers” as the cost driver. Then, by evaluating and rewarding product designers according to their ability to design low-cost products, they will be motivated to design products with fewer part numbers.5
Care must be exercised, however, when using cost drivers to modify behavior. A particular cost driver may induce too much “beneficial” behavior. For example, if reducing the part numbers causes designers to reduce the functionality and quality demanded by the marketplace, the induced behavior will be harmful.6
COMPARING TRADITIONAL VOLUME-BASED COSTING SYSTEMS TO ACTIVITY-BASED COSTING SYSTEM
Learning Objective 2
Contrast traditional volume-based costing systems with activity-based costing systems.
Traditionally, overhead costs have been applied according to four volume-related bases:
• Direct labor hours (DLhr)
• Direct labor dollars
• Machine hours (Mhr)
• Materials dollars
|
INSIGHTS S & APPLICATIONS Correcting Harmful Behavior at Purrintin Pet Food Company Management at Purrintin Pet Food Company was considering building a new 400,000 square-foot warehouse because its existing warehouses were full. The company’s storage and distribution costs were allocated based on product value. The use of this costing procedure meant that a 4-cubic-foot bag of dog food was allocated $3.89 in warehousing costs, while a single case of gourmet cat food was allocated $12.
|
This seemingly inexpensive storage cost for the bulky bags of dog food led the manager of dog food to keep excessive inventories of dog food on hand all the time.
By simply changing the assignment of storage and distribution costs by “amount of cubic feet” and “weight of units handled” cost drivers, both behavior and operating policies changed. The dog food product manager learned to manage inventory and no longer ordered in large batches, so the inventory of dog food shrank and the need for a new warehouse evaporated. As this case shows, arbitrarily spreading storage-and distribution costs over products distorts the underlying economics of storage and distribution and can lead to poor decision making and to dysfunctional behavior. On the other hand, reporting costs in accordance with what is causing the costs can lead to good decision making and to beneficial behavior, such as decreasing inventory and reducing storage and distribution costs.a |
|
aAdapted [ruin Michael C. O'Guin and Steven A. Rebischke, “Customer-Driven Costs Using Activity-Based Costing,” in Handbook of Cost Management, ed. Barry J. Brinker (Boston: Warren Gorham Lamont, 1992), p. B5-10. With permission. |
These bases provide a reasonably accurate product cost where overhead is consumed in relation to production volume. For example, employee benefits are related to direct labor, and energy costs are related to machine hours.7
The Impact of Diversity and Complexity on Costs
The designer of the costing system, in using these volume-related bases, assumes that all applied costs have the same behavior; that is, the costs increase in direct relationship to the volume of units produced. But many costs do not behave in a volume-related manner. They are driven by diversity and complexity, not by volume. For example, a simple concrete paving project drives costs by volume. The more concrete poured, the greater the costs. But a uniquely designed building with ornate patterns will primarily drive costs by diversity and complexity. Although both the paving project and the one-of-a-kind building project will use concrete, equating the material handling costs of the paving project with those of the building project will be substantially misleading and will generate distorted costs.
The paving project requires limited resources. It needs common forms and equipment but minimal support facilities. In contrast, the building project requires frequent setups, customized forms, and elaborate schemes for moving material.
Assumptions about Overhead Cost Behavior
Many people assume that a large and growing proportion of overhead costs is .fixed. In a large number of enterprises, the opposite is true. The so-called fixed costs are, in fact, the most variable and most rapidly increasing costs.8
Overhead costs vary due to a number of factors. If the enterprise introduces more products, if it needs to expedite more orders, if it has to inspect more
|
INSIGHTS & APPLICATIONS Cost Accounting Simplicity and Diversity Simplicity Company makes one product, turning out 300,000 units per year. Diversity Company produces a number of different products in different batch sizes. For example, product A is produced in 10-unit batches, whereas product B is produced in 1,000-unitbatches.Will Simplicity and Diversity have the same level of overhead costs? If not, which will have the higher overhead costs? Simplicity does not need a lot of things that Diversity will require, such as setups, material handling, purchasing, engineering, and indirect labor. Simplicity has one setup; Diversity has hundreds. Simplicity's material handling is minimal and simple; Diversity's is extensive and complex. Simplicity has one raw material furnished by one vendor. Therefore, Simplicity doesn't need a purchasing department. Diversity has hundreds of different raw material items. Consequently, one of Diversity's biggest overhead costs is purchasing. Simplicity's product was designed years ago and is easy to make. Consequently, Simplicity doesn't employ engineers and has very little indirect labor. Diversity has a varied product mix of complex products, most of which are difficult to make. The products have an average life cycle of three years. |
Diversity is, consequently, under pressure to develop innovative products on an ongoing basis. Thus, Diversity employs a large engineering and supervisory staff. To perform cost accounting at Simplicity, total costs are divided by the number of units produced. The total costs increase by a few percentage points each year due to inflation. The number of units produced each year averages 300,000, plus or minus 5,000 units.How should cost accounting be conducted at Diversity? Direct materials and direct labor can be traced to each product with a reasonable level of accuracy if sufficient data processing is performed. But what about overhead? Should a volume-based POR be used, or would activity-based cost drivers that apply overhead to products on the basis of each product's consumption of overhead be more accurate? If products A and B (as well as all the other products) are charged with overhead according to a volume based POR, product B will absorb much more over-head costs than product A because it is a high-volume product with batch sizes of 1,000 compared to batch sizes of 10 for product A. Product A, however, actually requires more setups, material handling, purchasing, engineering, and supervision than does product B because it is much more complex than product B. Product B is also standard, whereas product. A offers special customized features that require additional support costs.If an activity-based costing system is used instead of a volume-based costing system, then the amount of resources being consumed by product A would be assigned to it. Product B would also be costed with a higher degree of accuracy. |
components and use more parts, and so forth, it will need larger overhead support to perform these additional activities.
Because many overhead costs are driven by the introduction of new products and the diversity and complexity of production, not by the volume of production, nonproduction volume-related cost drivers are required, such as the number of each of:
• Purchase orders
• Receipts
• Inspections
• Payments
• Setups
• Material movements
• Engineering change orders
• Materials requisitions
ABC authorities, such as Robin Cooper and Robert S. Kaplan, have observed that the most variable and most rapidly increasing costs are often those traditionally classified as fixed, such as equipment and building depreciation, procurement, insurance, supervision and indirect labor, and utilities. This phenomenon occurs in companies that are introducing new products, which in turn will need additional activities such as material handling, setups, inspection, and various other support activities.9
|
INSIGHTS & APPLICATIONS Product Strategy at Zohr Electronics Management at Zohr Electronics changed its product mix by introducing low-volume specialty products in its line. Initially, these products did not consume procurement, receiving, engineering, quality control, setup, storage, and other activities. But shortly, as new products were added, the demands for these activities increased substantially.The introduction of these low-volume specialty products was due in large part to information reported by the division's volume-based product costing system, |
which used a division wide overhead rate based on direct labor hours. This costing system showed that low-volume specialty products cost less to produce than high-volume standard products. The costing system, therefore, reported that low-volume specialty products were among the most profitable products sold by the division. When Zohr installed a new activity-based costing system, the cost to produce low-volume specialty products was higher than the cost to produce high-volume standard products. Using this information, management made the following decisions: 1. Dropped certain products Increased the price of some low-volume products 2. Decreased the price of some high-volume products 3. Changed the design of certain complex products to simplify and decrease the demand for an array of activities |
How One Product May Be Cross-Subsidizing Another Product
To trace costs to products, the amount of each activity consumed by a product must be determined. For example, a complex product that requires an average of 30 materials requisitions consumes a much greater proportion of the stock-room. activity than a simple product, which requires one materials requisition. If processing one materials requisition costs $40, then $1,200 in stockroom activity costs should be charged to the complex product, and $40 should be charged to the simple product.
If product A consumes 70 percent of the purchasing activity and product B consumes 10 percent, then products A and B should be charged with 70 percent and 10 percent of the purchasing costs, respectively. To charge products A and B the same amount of purchasing costs obviously distorts product costs. In such a situation, product B is cross-subsidizing product A. Management may decide to drop product B because it will show a lower profit than it would show if it were assigned the proper amount of purchasing costs. The proper decision may be to eliminate product A instead or to eliminate neither.
Under a traditional volume-based costing system, significant product cost distortions, cross-subsidization, and incorrect management decisions may exist. In general, under a traditional volume-based costing system, low-volume products are undercosted and high-volume products are overcosted. As a result, the risk of making poor decisions increases in proportion to the level of distortion in reported costs.
How the Costing System Influences Decision Making
Exhibit 10-5a
|
a. Overhead cost applied based on direct labour cost |
|
b. Overhead applied based on activities required |
||||
|
Cost element |
Product AX |
Product BX |
|
Cost element |
Product AX |
Product BX |
|
Direct Materials |
$23.00 |
$38.00 |
|
Direct Materials |
$23.00 |
$38.00 |
|
Direct Labour |
$ 7.00 |
$ 7.00 |
|
Direct Labour |
$ 7.00 |
$ 7.00 |
|
Total overhead at 500% of direct labour |
$35.00 |
$35.00 |
|
Setup driver |
$10.00 |
$20.00 |
|
|
|
|
|
Material Handling Driver |
$14.00 |
$26.00 |
|
SAMC |
$65.00 |
$80.00 |
|
SAMC |
$54.00 |
$91.00 |
|
Current selling price |
$68.00 |
$80.00 |
|
Current selling price |
$68.00 |
$80.00 |
|
Gross profit (loss) per unit |
$ 3.00 |
$10.00 |
|
Gross profit (loss) per unit |
$14.00 |
($ 1.00) |
shows how an inappropriate overhead application method can distort management's view of the profitability of its product mix. Wysiwyg Computer Products Inc. produces two different computer circuit boards in a highly automated manufacturing facility. Direct labor costs have typically been in the order of only 5 percent of total product cost. Nevertheless, the company's management accountants continue to use a POR based on direct labor.
Management has become concerned over declining sales in its high-volume circuit board Ax. Several competitors have undercut Wysiwyg's price on this product, yet the company's cost data show that it is making only a small profit on sales of circuit board Ax. The low-volume circuit board Bx appears to be quite profitable, however. Since the company is clearly having difficulty competing on its high-volume product, management has even suggested that circuit board Ax be discontinued in favor of the more profitable circuit board Bx.
Ada Contrary, a recent graduate of Very Big University's School of Accountancy, has just joined the company. Her curiosity is sparked when she hears a rumor of a major product line being discontinued, and she decides to investigate.
To her surprise, she finds that although direct labor costs are a very small portion of total product costs, Wysiwyg still uses a direct labor overhead application method in costing its products. She knows that an ABC system would be far more appropriate in this highly automated plant and would certainly provide management with a different profitability picture.
Ada does some more research and develops Exhibit 10-5b to present to management. The exhibit shows how the more realistic overhead application provided by the activity-based method can lead to very different pricing and product mix decisions.
Observing the manufacturing process, Ada finds that overhead costs are driven by machine setups and material handling. She elects to use these as the cost drivers in applying overhead between products Ax and Bx. As the exhibit illustrates, the low-volume nature of product Bx requires more frequent machine setups, hence the greater overhead applied to that product based on the setup driver. The process has been streamlined for the high-volume product Ax, so it requires fewer setups, and less overhead is applied based on the setup driver.
Product Ax makes fewer demands on material handling as well, whereas producing product Bx requires many materials requisitions and trips to the storeroom. Therefore, the material handling driver assigns more overhead to product Bx than to product Ax.
Note that the same amount of total overhead cost ($70) is applied between one unit of circuit board Ax and one unit of circuit board Bx, regardless a< the overhead application method. Under the direct labor overhead application method, however, too much overhead was applied to Ax and too little was applied to Bx, giving a false impression of the total costs of producing these products.
Management may now decide to reduce circuit board Ax's selling price to enable it to compete better. The low-volume circuit board Bx is not profitable given the current selling price, so management may decide to raise the price or discontinue the product altogether. By changing the overhead application method used by the company's management accountants, Ms. Contrary saved Wysiwyg from a bad decision and earned herself a substantial salary increase!
In What Kind of Environments Is ABC Appropriate?
If the products in a plant possess similar characteristics, either a volume-based POR or an activity-based cost driver will produce reasonably accurate product costs. In those rare instances where a company produces only one product in a one-department operation, a formal cost accounting system is not even needed. Costs can be assigned to the product simply by dividing total costs by output during the period.
By connecting costs with their causes, ABC enables managers to know, with reasonable accuracy, the consequences of their decisions. The major criticism of ABC in earlier years was the cost of processing data. But as computer costs continue to fall, the most diverse and complex companies can implement and operate an ABC system efficiently on a microcomputer. Moreover, several ABC software packages are available at reasonable cost.
It can be concluded that ABC is especially appropriate in companies where the following are true:
• Competition is high.
• Product mix is diverse in batch sizes, physical sizes, degree of complexity, and raw material characteristics.
• Product life cycles are short, such as three years or less.
• Collection and manipulation of data are performed by an integrated computer-based information system (ICBIS).
As a rule of thumb, companies will find ABC more valuable for developing product or service costs as their products and services become more numerous and diverse and the source of their costs shifts from direct to indirect categories. However, even if product diversity is not a problem, ABC can prove valuable for purposes of cost management. Even companies with homogeneous products, or even a single product, can put ABC to good use. The discipline of identifying activities and computing their costs can reveal opportunities either for cutting the cost of performing the activities or for eliminating nonvalue-added activities.
The three strategic goals of ABC systems are summarized as:
1 Appropriate pricing decisions based on good cost information
2 Appropriate product mix decisions based on good profitability information
3 Good cost management by focusing on activities and cost drivers
ACTIVITY-BASED COSTING SYSTEM DEVELOPMENT LIFE CYCLE
Learning
Objective 3
Explain how to develop activity-based costing systems
This section outlines a methodology for developing an activity-based costing system. The methodology is referred to as ABC systems development life cycle, which is a structured series of phases followed by the systems project team in developing an ABC system:
Phase one. Plan the system.
Phase two. Analyze and define resource categories.
Phase three. Analyze and define activities.
Phase four. Determine first-stage resource drivers and establish activity cost pools.
Phase five. Determine second-stage activity drivers and assign costs to cost objects.
These phases are shown in the ABC systems development life cycle depicted in Exhibit 10-6
|
. It is referred to as a “life cycle” because the ABC system is dynamic and is subject to continuous improvement and refinement. The ABC systems development life cycle can be used to develop a pilot (or prototype) ABC system or a full-blown enterprise wide system that supplants the present costing system. The ABC systems development life cycle is used in the next sections to develop an ABC system for the Panametric Corporation.
Phase One: Plan the System
Work on developing an ABC system should not start until there is common understanding and agreement throughout the organization. People should understand both how an ABC system works and that it has two primary purposes:
• Costing of cost objects
• Providing information for daily operational management, continuous improvement, and, in some instances, business re-engineering (Note: Business or activity reengineering is the subject of Chapter 11.)
The following discussion helps provide the common understanding and agreement needed to embark on ABC systems development.
The systems planning phase establishes a broad strategic framework and clear vision of the enterprise and an understanding of how the ABC system will serve the enterprise. An excellent starting point is to hold a number of joint application development sessions that involve a large number of participants throughout the organization.
By fostering active involvement, some of the mistrust and bickering that might otherwise occur between various managers and workers and management accountants is reduced if not eliminated. Ideally, the ABC system will become the workers' and managers' system. They must feel that the ABC system is an integral part of their operational control system. Indeed, when these people feel they own the system, they are motivated to work with it and strive for its success.
Another reason for involving workers and managers in systems development at Panametric is to enable management accountants to understand in detail what activities are performed and what is required to get the job done. On the other side, workers and managers need to understand what it takes to develop the ABC system and what its purposes are.
In many situations, after an ABC system is installed, users need considerable training to learn how to work with the system. With a participative approach, training requires less time and effort because the people gain more knowledge about the system while it is being planned and developed. In some situations, certain workers and managers will become members of the systems project team. They will become superusers who are highly skilled in how the system works. These superusers can effectively train other users.
Another key outcome of joint application development is an enterprisewide model, such as that presented in Chapter 3. This model, which describes all the major entities of the enterprise and their relationships, serves as a blueprint of how the organization works, its environment, and its interdependencies.
Normally, the ABC systems development life cycle is performed by a multidisciplinary systems project team that draws its members from different areas throughout the organization. The systems project team at Panametric includes the following:
• Management accountant
• Engineering representative
• Production representative
• Marketing representative
• Logistics representative
• Financial accounting representative
Thus, the management accountant, who generally serves as the systems project leader, can draw on the talent and skills of a diverse work force.
The project team members must work together as partners toward a common end, creating an optimally performing enterprise. Top management support is essential to develop, implement, and operate an ABC system successfully. Serious commitment at the highest level of the enterprise is the key to making the transition to an ABC system work. This is especially true when the ABC system leads to reengineering the business and the way in which people work together. Executives at Panametric strongly support the development of an ABC system, because they believe it will provide reasonably accurate cost information and help them improve operations.
Phase Two: Analyze and Define Resource Categories
In analyzing and defining resource categories, the systems project team may choose to combine certain ledger accounts and budgetary items that are associated with the same or similar resource categories. On the other hand, the team may choose to split certain ledger accounts or budgetary items that are consumed differently by different activities.
The systems project team at Panarnetric Corporation has divided budgeted items into two resource categories:
• Service resources
• Production resources
The budgeted costs of these resources are presented in Exhibit 10-7
|
Budget |
|
|
|
|
Service and Production Resources |
|
|
|
|
For the year 20x5 |
|
|
|
|
Service Resources |
|
|
|
|
Salaries |
|
$800,000 |
|
|
Benefits |
|
100,000 |
|
|
Insurance |
|
20,000 |
|
|
Utilities |
|
140,000 |
|
|
Depreciation |
|
440,000 |
$1,500,000 |
|
|
|
|
|
|
Production Resources |
|
|
|
|
Supervision |
|
$970,000 |
|
|
Benefits |
|
90,000 |
|
|
Insurance |
|
60,000 |
|
|
Utilities |
|
200,000 |
|
|
Depreciation |
|
2,000,000 |
3,320,000 |
|
Total Budgeted Resources |
|
|
$4,820,000 |
.
Phase Three: Analyze and Define Activities
During activity analysis and definition, both service and production activities of an enterprise are identified in order to establish a basis for determining their cost and performance. This process decomposes an organization into elemental activities that are understandable and easy to manage. It is a process of “dividing to conquer.”
Activity analysis describes what an enterprise does; that is, how time, effort, and resources are spent and the inputs and outputs of activities. Activities are not necessarily traditional organizational segments, such as departments. In some instances, activities may cross department boundaries. In other instances, a department may contain several activities.
Key management personnel and technical experts are consulted through interviews. Job descriptions are useful, because they are typically written in terms of tasks that make up activities. The interviewing process is usually iterative. Often, the same person has to be interviewed several times to attain the necessary information.
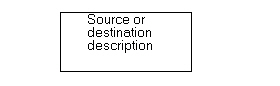
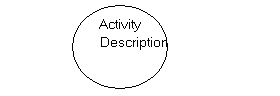
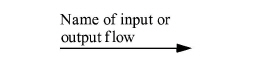
THE ACTIVITY FLOW DIAGRAM. An activity flow diagram describes the activities that are performed in an organization and shows their interdependencies. The symbols used to prepare activity flow diagrams are presented in Exhibit 10-8
|
Meaning |
Symbol |
|
Source or Destination |
|
|
Activity that transforms inputs to outputs |
|
|
Input and output flows |
|
.
The rectangle represents a source or destination of the initial or final inputs or outputs of the system under analysis. Sources or destinations can be persons, companies, departments, or other systems. They define the boundaries of the system being modeled. Labels of the sources and destinations should be descriptive, such as Vendor, Customer, Finished Goods, and Shop Floor.
To avoid crossing the input and output flow lines, sources and destinations may be duplicated. Normally, sources and destinations should be located on the perimeters of the activity flow diagram. This placement is consistent with their definition as systems boundaries.
Activities, which convert inputs to outputs, are represented by circles. By convention, the name (description) of an activity consists of a verb and an object or object clause, such as Purchasing (or Purchase) Materials, Update Accounts Receivable, or Check Credit.
All activities must have both inputs and outputs. An activity that shows inputs but no outputs is called a “black hole,” because the input enters the activity and disappears or nothing takes place. An activity with output but no input is creating something from nothing, which is a “miracle.” An activity can have more than one input or output.
Input and output flow is indicated by a line and an arrow. It represents the input and output among sources, destinations, and activities. All input and output flows either initiate an activity or result from an activity. For example, a supervisor on the shop floor (source) issues a materials requisition to the purchase materials activity, which is input that initiates a purchase order output from the purchase materials activity that is sent to a vendor (destination). Each input and output flow line should have a noun or noun clause next to it (usually above the line or to its right or left) describing the input or output that is being transferred. Inputs and outputs can be paper documents, electronic data, materials, and various measurements (e.g., machine hours).
|
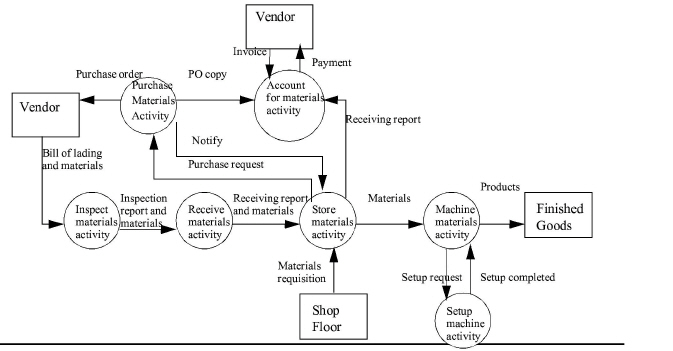
APPLYING THE ACTIVITY FLOW DIAGRAM. Exhibit 10-9 presents an activity flow diagram that models the purchasing, inspecting, receiving, accounting, machining, and setting up activities at Panametric Corporation. The model clearly shows both what activities are being performed and their interdependencies. In many instances, one activity will trigger the performance of another activity.
The initial input to the system is a materials requisition from the shop floor (a source) to the store materials activity. If the materials requested are on hand, they are immediately transferred to the machine materials activity. If they are not on hand, a purchase request is sent to the purchase materials activity, which prepares a purchase order and sends it to the appropriate vendor (a destination). A copy of the purchase order is sent to the accounting activity. The vendor (a source) sends the ordered materials to the inspect materials activity along with a bill of lading. The materials are inspected for quality and specifications. An inspection report and the materials are transmitted to the receive materials activity, which counts the materials, prepares a receiving report, and transmits the report and materials to the store materials activity. If accepted by the store-room personnel (i.e., the store materials activity personnel may reject the materials because of discrepancies), the needed materials are immediately moved to the machine materials activity for processing. Also, a receiving report for the materials is sent to the account for materials activity, which serves as an authorization to pay the vendor's invoice, assuming that no discrepancies exist. From time to lime, depending on the product being machined, the machine materials activity requires a setup machine activity. When this need occurs, the machine materials activity prepares a setup request for the setup machine activity, which in turn performs the setup. Upon completion of the machine materials activity, the completed products are transferred to finished goods (a destination). The machine materials activity is responsible for all materials and product movement within Panametric.
|
,
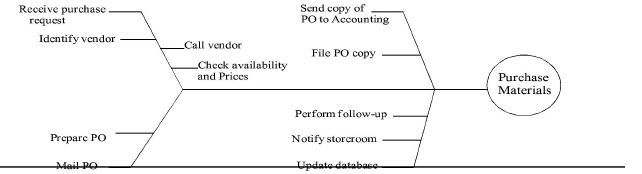
AGGREGATING AND DECOMPOSING ACTIVITIES. Activities arc composed of tasks, which are pieces of work assigned to people or machines. A task may be computational, procedural, or physical. Homogeneous tasks make up a function-specific activity. A fishbone diagram, (also called a cause-and-effect diagram), illustrated in Exhibit 10-10 can be used as a tool for defining activities, such as the purchase materials activity.
The systems project team groups all related tasks that pertain to and make the activity operational. In Exhibit 10-10, the tasks on the task side of the fishbone diagram represent all the pieces of work necessary to make the purchase materials activity operational. Unrelated tasks, for example, would be verifying quantity and prices and making a payment to a vendor. These tasks are related to the account for materials activity.
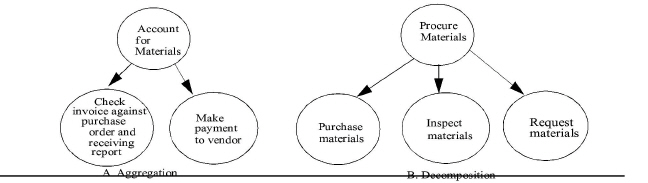
The process of combining tasks into a homogeneous group to form a function-specific activity is referred to as aggregation. The process of breaking down groups of dissimilar tasks into several function-specific activities is called decomposition. In either case, the proper definition of activities requires looking into activities to determine the detailed internal workings of the tasks that make up the activities. Exhibit 10-11
|
illustrates the aggregation and decomposition processes. Panel (a) shows the aggregation of two previously defined activities into one well-defined, function-specific activity. Checking the invoice against the purchase order and receiving report, and making a payment to a vendor, are actually highly related tasks that make up the account for materials activity.
In panel (b), the previously-defined procure materials activity contains three function-specific activities: purchase materials, inspect materials, and receive materials. All of these activities contain tasks that are related to their specific activities.
Here are some rules of thumb that help in performing aggregation and decomposition:
• Usually, there should be from two to ten well-defined, function-specific activities per traditional organizational unit or department. In some instances, one small department may equal one activity. In other instances, an activity may transcend more than one department. If more than ten activities are defined for a typical department (e.g., accounting, procurement, painting, finishing, and milling), then the activities should be reviewed for aggregation. On the other hand, if one activity is defined for one medium- or large-size department, the activity should be reviewed for decomposition.
• Activities that are the responsibilities of different people should not be aggregated.
• Generally, an activity should contain no more than five to fifteen well-defined, highly-related tasks.
• If an activity contains only one task, it has probably been subjected to excessive decomposition.
• If an activity contains unrelated tasks, it needs to be decomposed.
• If there is only one input and one output, the activity has been decomposed enough.
• If there are multiple inputs and outputs, the activity may be a candidate for decomposition. However, a well-defined, function-specific activity may contain two or three inputs and two or three outputs and may not require decomposition.
In addition to interviewing, the systems project team spends a great deal of time observing activities as they are performed. Statistics dealing with time, distance, quantity, and frequency are gathered. For example, an activity dealing with movement of a component may generate the following statistics:
Time: 15 minutes to move materials from storeroom to machining
Distance: 1,500 feet
Quantity: One batch of four pallets
Frequency: Performed 30 times per day, on average
Such statistics can then be used to assist in determining activity costs being consumed.
Phase Four: Determine First-Stage Resource Drivers and Establish Activity Cost Pools
The first-stage resource drivers assign resource costs (defined in phase two) to various activities (defined in phase three) forming activity cost pools, as shown
|
Activity |
First-Stage Resource Driver |
Amount Assigned to Activity Cost Pools |
|
Store materials |
(100,000 CubicFeet x $6) |
$ 600,000 |
|
Purchase materials |
($900,000 x 10/30) |
300,000 |
|
Receive materials |
($900,000 x 9/30) |
270,000 |
|
Inspect materials |
($900,000 x 5/30) |
150,000 |
|
Account for materials |
($900,000 x 6/30) |
180,000 |
|
Machine materials |
($3,320,000 x .90) |
2,988,000 |
|
Setup machine |
($3,320,000 x .10) |
332,000 |
|
Total budgeted costs assigned to activity cost pools |
$4,820,000 |
|
|
|
|
|
in Exhibit 10-12. The first-stage resource driver used to assign a portion of service costs to the store materials activity is “number of cubic feet,” which is 100,000 cubic feet charged at $6 per cubic foot. Total service costs are $1,500,000 less the $600,000 (100,000 CF x $6) charged to the store materials activity. The remaining $900,000 in service costs are assigned to the purchase materials, receive materials, inspect materials, and account for materials activities using “headcount” as the resource driver. The headcount equals 30, with 10 in purchasing, 9 in receiving, 5 in inspecting, and 6 in accounting. Thus, each activity is assigned its fair share of the $900,000 service resource costs.
The $3,320,000 production resource costs are assigned to the machine materials and setup machine activities. Based on a great deal of analysis, the systems project team at Panametric determines that 90 percent of the $3,320,000 ($2,988,000) should be assigned to machine materials and 10 percent ($332,000) to setup machine.
Phase Five: Determine Second-Stage Activity Drivers and Assign Costs to Cost Objects
Once the costs of resources consumed by activities have been assigned to the activity cost pools, second-stage activity drivers can be determined and applied. These activity drivers are usually the outputs designated on the activity flow diagram. For example, the primary output of the purchase materials activity is purchase orders. Therefore, the number of purchase orders is the second-stage cost driver for the purchase materials activity cost pool. The costs from this activity cost pool are assigned to products on the basis of how many purchase orders they cause to be processed. For example, a complex product containing hundreds of parts will usually cause more purchase orders to be processed than a simple product containing two or three parts. Thus, the complex product should be charged with the bulk of purchasing costs.
Notice that the purchase materials activity has one input and three outputs, as shown in the activity flow diagram in Exhibit 10-9. The purchase request input is a trigger to activate the purchase materials activity. The three outputs are the purchase orders sent to vendors, the copies of the purchase orders sent to the account for materials activity, and a notification sent to the store materials activity. The cost of the purchase materials activity can be expressed as a cost per purchase request, purchase order, or copy of purchase order. Generally, the best measure, and therefore the best activity driver, is the primary output of the activity. In the case of the purchase materials activity, the best activity driver is the purchase order output, because the primary reason for performing this activity is to generate purchase orders.
Here are some rules of thumb for determining activity drivers:
• If an activity has more than one output, the activity should be analyzed further to see if it should be decomposed into more than one activity, each with its own individual output measure. If the activity is indeed function-specific and cannot logically be further decomposed, then the primary output should be used as explained earlier.
• If two or more activities have the same primary output measure, they should be aggregated into one activity.
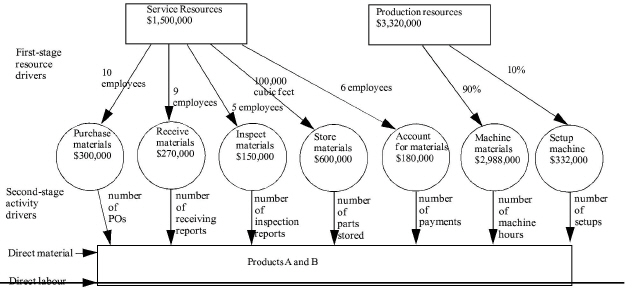
The result of phase live at Panametric is the completed ABC system design shown in Exhibit 10-13
|
. All of the second-stage activity drivers are designated for each activity cost pool. The direct cost elements, direct materials and direct labor, are also shown. The system is ready to cost products A and B, the two cost objects for Panametric Corporation's ABC system.
In some instances, the systems project team may wish to group several activity cost pools into one activity center as shown in Exhibit 10-14
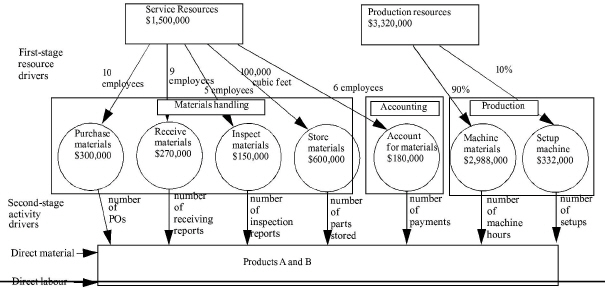
|
. For example, the activity cost pools of purchase materials, receive materials, inspect materials, and store materials may be included in an activity center called “materials handling.” The accounting activity center and account for materials activity cost pool are the same. The machine materials activity cost pool and setup machine activity cost pool may be included in an activity center called “production.''
Developing a large number of activity centers leads to a detailed representation of the organization and how it performs its work. But creating separate activity centers for a simple organization or for activity cost pools that are similar or stand on their own may add needless complexity to the ABC system without providing any additional insights into how resources are consumed. Thus, the systems project team should choose activity centers that have a clear meaning according to manageable segments of the organization. Doing so increases the likelihood that managers will use and correctly interpret ABC cost information as they manage activities in the organization.
How activity cost pools are organized within activity centers is irrelevant as far as calculations are concerned and thus cannot affect unit product or service costs. The total cost of activity cost pools will be the same whether they are grouped within activity centers or not.
The advantage of a two-stage cost assignment process over a single-stage procedure is that different measures of resource consumption can be used at each stage. For example, the service resources are assigned to the store materials activity based on the number of cubic feet, the first-stage resource driver. Knowing how many resources the activity itself is consuming is beneficial to management in trying to control activity-level costs. The activity driver used to assign store materials costs to products is the number of materials requisitions. This cost driver is a good measure of how different products consume the store materials activity costs. At this level, management can focus on the products, services, or customers to determine their profitability.
Costing Cost Objects
The systems project team creates an activity cost pool for each activity and selects an activity driver for each activity cost pool. The activity driver is used to apply the costs of the activity cost pool to each product or service (or other cost object) according to the amount of activity costs consumed. The costs consumed arc assigned to the cost object through a bill of activities, which lists activities and associated costs required by the cost object.
The bill of activities for products A and B manufactured by Panametric Corporation is shown in Exhibit 10-15
|
Exhibit 10 -15 Bill of Activities for Product-Driven Activities |
||||||
|
Bill of Activities, Products A and B For the Period Ended December 31, 20x4 |
||||||
|
|
Product A (50,000 units) |
Product B (100,000 units) |
||||
|
Activity Second-Stage Cost Pool Activity Driver Rate |
Activity Driver Quantity |
Activity Cost |
Unit Cost |
Activity Driver Quantity |
Activity Cost |
Unit Cost |
|
Purchase materials $60 per purchase order |
$ 60 x 4,000 |
$ 240,000 |
$ 4.80 |
$ 60 x 1,000 |
$ 60,000 |
$ 0.60 |
|
Receive materials $90 per receipt |
$ 90 x 2,500 |
225,000 |
4.50 |
$ 90 x 500 |
45,000 |
0.45 |
|
Inspect materials $50 per inspection |
$ 50 x 2,500 |
125,000 |
2.50 |
$ 50 x 500 |
25,000 |
0.25 |
|
Store materials $20 per part stored |
$ 20 x 20,000 |
400,000 |
8.00 |
$ 20 x 10,000 |
200,000 |
2.00 |
|
Account for materials $72 per payment |
$ 72 x 1,500 |
108,000 |
2.16 |
$ 72 x 1,000 |
72,000 |
0.72 |
|
Machine materials $996 per machine hour |
$ 996 x 1,000 |
996,000 |
19.92 |
$ 996 x 2,000 |
1,992,000 |
19.92 |
|
Setup machine $3,320 per setup |
$ 3,320 x 90 |
298,800 |
5.98 |
$ 3,320 x 10 |
33,200 |
0.33 |
|
Total activity costs assigned to products |
|
$ 2,392,800 |
|
|
$ 2,427,200 |
|
|
Activity costs per unit |
|
|
$ 47.86 |
|
|
$ 24.27 |
|
Direct materials costs per unit |
|
|
60.00 |
|
|
50.00 |
|
Direct labor costs per unit |
|
|
24.00 |
|
|
24.00 |
|
Total costs per unit |
|
|
$ 131.86 |
|
|
$ 98.27 |
|
|
||||||
. Production for the period is 50,000 units of product A and 100,000 units of product B. The activity costs consumed by each product are determined by multiplying the activity driver rate times the activity driver quantity generated. For example, product A caused 4,000 purchase orders to be generated during the period. It costs $60 to produce one purchase order. Therefore, product A is charged with $240,000 ($60 x 4,000 purchase orders) of the costs of the purchase materials activity. The cost per unit is $4.80 ($240,000 - 50,000 units). Product B caused only 1,000 purchase orders to be produced, so it is charged with only $60,000 ($60 x 1,000 purchase orders) of the costs of the purchase materials activity. The cost per unit is $0.60 ($60,000 100,000 units). The total activity costs assigned to product A and product B are $2,392,800 and $2,427,200, respectively. The activity costs per unit for product A and product B are $47.86 ($2,392,800 - 50,000 units) and $24.27 ($2,427,200 = 100,000 units), respectively. Direct materials and direct labor costs per unit are also included in the bill of activities. This way, the total costs per unit for each product are disclosed for management's attention.
The cost per unit for direct materials is determined from the bill of materials displayed in Exhibit 10-16
|
|
. The actual amount of direct materials used comes from materials requisitions.
At the top of the exhibit is the bill of materials for product A, which is made up of two of part A.1, four of part A.2, and one of part A.3, for a total cost of $60 per unit. Part A.1 is composed of three of component 1.1 and two of component 1.2, for a total cost of $15 per unit. Part A.2 is a stand-alone part. Part A.3 requires one each of components 3.1, 3.2, and 3.3, for a total cost of $10 per unit- At the bottom of the exhibit is the bill of materials for product B, which requires one of part B.1 and one of part B-2, for a total cost of $50 per unit.
As the exhibit shows, product A is more complicated than product B. Because of this added complexity, product A drives the activity cost pools with greater intensity and frequency than does product B.
Direct labor costs represent the second direct cost element that is traced directly to the products. These costs are applied to the products based on data collected on time tickets. The cost per unit for direct labor is $24 ($12 x 2 hours) for both products.
An interesting and revealing exercise is to use the data of the Panametric Corporation to calculate the cost per unit of products A and B under four different costing systems:
• Activity-based costing system just presented
• Activity-based costing system using three direct cost elements: direct materials, direct labor, and direct technology
• Traditional volume-based costing system using a plantwide predetermined overhead rate (POR) based on direct labor hours
• Traditional volume-based costing system using two predetermined overhead rates (PORs) based on materials dollars and machine hours
The results are presented in Exhibit 10-17.
|
Exhibit 10 -17 Calculation of Unit Costs Using Four Different Costing Systems |
|||
|
Activity-based costing: |
Product A |
Product B |
|
|
Direct materials |
$ 60.00 |
$ 50.00 |
|
|
Direct labor ($12 x 2 DLhr) |
24.00 |
24.00 |
|
|
Activity costs |
47.86 |
24.27 |
|
|
Total cost per unit |
$ 131.86 |
$ 98.27 |
|
|
Activity-based costing with direct technology as a cost element: |
|
|
|
|
Direct materials |
$ 60.00 |
$ 50.00 |
|
|
Direct labor |
24.00 |
24.00 |
|
|
Direct technology |
19.92 |
19.92 |
|
|
Activity costs |
27.94 |
4.35 |
|
|
Total cost per unit |
$ 131.86 |
$ 98.27 |
|
|
Machine (Direct technology): A: $2,988,000 x 1/s = $996,000 / 50,000 units - $19.92 per unit B: $2,988,000 x 1/s = $1,992,000 / 100,000 units = $19.92 per unit |
|
||
|
|
|
|
|
|
Activities without the machine materials activity: |
||
|
|
Product A |
Product B |
|
Purchase materials |
$ 240,000 |
$ 60,000 |
|
Receive materials |
225,000 |
45,000 |
|
Inspect materials |
125,000 |
25,000 |
|
Store materials |
400,000 |
200,000 |
|
Account for materials |
108,000 |
72,000 |
|
Setup machine |
298,800 |
33,200 |
|
Total activity costs |
$1,396,800 |
$435,200 |
|
A: $1,396,800 - 50,000 units = $27.94 per unit B: $435,200 - 100,000 units = $4.35 per unit |
||
|
Traditional volume-based costing system using a plantwide predetermined overhead rate on Direct Labour Hours: |
||||
|
|
Product A |
Product B |
||
|
Direct materials Direct labor ($12 x 2 DLhr) A: Overhead ($80.33 x 20,000 DLhr) - 50,000 units B; Overhead ($80.33 x 40,000 DLhr) - 100,000 units |
$ 60.00 24.00 32.13 |
$ 50.00 24.00
32.13 |
||
|
$106.13 |
||||
|
Calculation of plantwide predetermined overhead rate based on direct labor hours: |
|
|||
|
A: Direct labor hours budgeted B: Direct labor hours budgeted |
20,000 40,000 |
|
|
|
|
Total direct labor hours budgeted |
60,000 |
|||
|
Total resources: Service resources Production resources |
$1,500,000 3,320,000 |
|
|
|
|
Total resources budgeted |
$4,820,000 |
|||
|
$4,820,000 - 60,000 DLhr = $80.33 per DLhr |
|
|
||
|
Traditional volume-based costing system using two predetermined overhead rates based on direct materials dollars and machine hours: |
|
|||
|
|
|
|
Product A |
Product B |
|
Direct materials |
|
$ 60.00 |
$ 50.00 |
|
|
Direct labor ($12 x 2 DLhr) |
|
24.00 |
24.00 |
|
|
A: |
OH based on materials dollars ($562,500 / 50,000 units) |
11.25 |
|
|
|
B: |
OH based on materials dollars ($937,500 / 100,000 units) |
|
9.38 |
|
|
A: |
OH based on machine hours ($1,106,667 / 50,000 units) |
22.13 |
|
|
|
B: |
OH based on machine hours ($2,213,333 / 100,000 units) |
|
22.13 |
|
|
|
Total cost per unit |
|
$117.38 |
$105.51 |
|
Predetermined overhead rate based on direct materials dollars: Service resources: |
||
|
A: ($60 x 50,000 units) = $3,000,000 (3/8ths) |
|
|
|
B: ($50 x 100,000 units) = 5,000,000 (5/8ths) |
|
|
|
Total direct materials $8,000,000 (8/8ths) |
|
|
|
|
|
|
|
A: $1,500,000 x 3/8 = $562,500 / 50,000 units = $11.25 per unit B: $1,500,000 x 5/8 = $937,500 / 100,000 units = $9.38 per unit |
|
|
|
|
||
|
|
|
|
|
Predetermined overhead rate based on machine hours: |
|
|
|
Production resources: |
|
|
|
A: Machine hours budgeted |
1,000 |
(1/3) |
|
B: Machine hours budgeted |
2,000 |
(2/3) |
|
Total machine hours budgeted |
3,000 |
(3/3) |
|
|
|
|
|
A: $3,320,000 x 1/3 = $1,106,667 / 50,000 units = $22.13 per unit B: $3,320,000 x 2/3 = $2,213,333 = 100,000 units = $22.13 per unit Note: All numbers are rounded to the nearest penny. |
||
|
|
|
|
The total costs for producing both products are $16,420,000 no matter which costing system is used. The total unit costs, however, present a radically different picture. Under both activity-based costing systems, the total unit costs are the same. However, when direct technology (machine) costs are treated as a direct cost element, one can clearly see that product A is driving most of the activity costs ($27.94 per unit for product A versus $4.35 per unit for product B). But when volume-based costing systems are used, the overhead costs per unit for both products are equal ($32.13 for each) when the POR is based on DLhr or near equal ($33.38 for product A and $31.51 for product B) when PORs are based on materials dollars and machine hours.
Market-Driven Activity-Based Costing Systems
A market-driven ABC system can be developed along with a product-driven ABC system. Whereas product-driven ABC system costs are assigned to cost objects, such as units, batches of units, and product lines, market-driven ABC system costs are assigned to such cost objects as customers, customer groups, distribution channels, and sales territories. Just as products have varying degrees of complexity and diversity and make different demands on resources and activities, so too do customers, customer groups, distribution channels, and sales territories.
Two different enterprises that produce the same products can incur different market-driven costs, depending on their target customers, distribution strategies, sales territories, and advertising campaigns. The product-driven costs for the two enterprises may be the same, but the market-driven costs will probably be substantially different.
Market-driven activities represent a sizable portion (anywhere from 20 to more than 50 percent) of an enterprise's total costs. Assigning such costs to their sources helps management identify relative profitability of customers, customer groups, distribution channels, and sales territories. These activities may be providing a competitive advantage or disadvantage depending on how resources are deployed to meet the needs of the market.
Exhibit 10-18
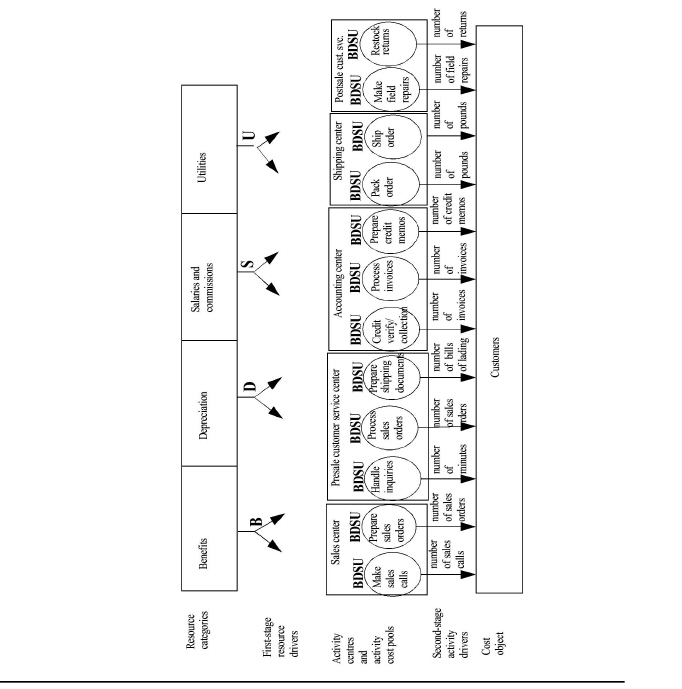
|
shows a general ABC model to cost customers. The resource categories include benefits, depreciation of buildings and a variety of equipment, salaries and commissions, and utilities. These resource costs are assigned to activity cost pools by using such resource drivers as headcount, square feet and cubic feet, hours of equipment usage, and kilowatt hours. Activity cost pools are aggregated into activity centers. Each activity center is managed by a separate person. The second-stage activity drivers assign the costs from the activity cost pools to the customers.
A bill of activities for customer A is presented in Exhibit 10-19.
|
Exhibit 10 -19 Bill of Activities for Market-Driven (Customer) Activities |
||
|
|
Bill of Activities Customer A For the Period Ended December 31, 20x4 |
|
|
Sales |
$200,000 |
|
|
Cost of goods sold [Determined from product-driven ABC system.] |
< 140,000> |
|
|
Gross profit |
$ 60,000 |
|
|
Less market-driven activity costs: |
|
|
|
Activity Cost Pool |
Activity Driver Rate |
Activity Driver Quantity |
Activity Cost |
|
Make sales calls |
$40 per sales call |
10 sales calls |
$ 400 |
|
Prepare sales orders |
$30 per sales order |
50 sales orders |
1,500 |
|
Handle inquiries |
$10 per minute |
100 minutes |
1,000 |
|
Process sales orders |
$80 per sales order |
50 sales orders |
4,000 |
|
Process shipping documents |
$40 per shipping document |
12 shipping documents |
480 |
|
Process credit |
$60 per notice |
2 notices |
120 |
|
Process invoices |
$70 per invoice |
50 invoices |
3,500 |
|
Prepare credit memos |
$70 per credit memo |
6 credit memos |
420 |
|
Pack orders |
$2 per pound |
1,000 pounds |
2,000 |
|
Ship orders |
$ 3 per pound |
1,000 pounds |
3,000 |
|
Make field repairs |
$300 per field repair |
3 field repairs |
900 |
|
Restock returns |
$100 per return |
6 returns |
600 |
|
Total market-driven activity costs |
<17,920> |
|
Profit contributed by Customer A |
$ 42,080 |
|
|
|
The cost data are assumed for illustrative purposes. A similar bill of activities format can be used for any level of cost object chosen, such as customer groups, distribution channels, or sales territories. In many organizations, it is difficult to assign costs to individual customers. Therefore, customers are usually aggregated into groups, such as distributors and retailers. Each group possesses different characteristics. Distributors normally buy many units per order and require few shipping destinations. Retailers, on the other hand, purchase few units per order and have many shipping destinations; therefore, they normally create more order processing and shipping transactions. Also, retailers require special packaging and advertising programs.
The same activity drivers used to cost specific customers can also be used to cost customer groups. Other activity drivers that can be added include the following:
• Units per order
• Number of shipping destinations
• Number of special packaging requests
Distribution channel-level activity costs are those incurred to service a particular distribution channel. Although customer groups, such as distributors, retailers, and buying groups, are often also designated as distribution channels, the two are differentiated here. Customer groups are costed on the basis of activities used to meet the demands of customers, as already illustrated. Distribution channels make demands on activities, such as warehousing, distribution centers, trucking, and other transportation modes. In other words, distribution channels involve logistics costs, discussed later in Chapter 13.
Sales territory-level costs are not easily assigned to individual customers, customer groups, or distribution channels. These costs are incurred to develop and maintain a presence in the marketplace. Activities related to the sales territory cost object are advertise and promote, handle product liability claims, handle recalls, set up trade shows, and perform market research.
USING ACTIVITY-BASED COSTING SYSTEMS IN SERVICE ORGANIZATIONS
Although differences between manufacturing and service enterprises tend to blur because of manufacturers' increasing emphasis on providing services, service enterprises do have several differentiating characteristics, the primary ones being:
• Little to no inventory
• Output that is often intangible and difficult to define
Despite these differences, service firms are developing costing systems that are very similar to the ABC systems used by manufacturers.
Using ABC Systems in Hospitals
The ABC system for a hospital presented in Exhibit 10-20
|
Exhibit 10 -20 ABC System Used in a Hospital |
||||
|
Resource Categories |
Resource Drivers |
Activity Cost Pools |
Activity Drivers |
Cost of Service |
|
Nurses |
Costs related to nursing and acuteness level |
Nursing care |
Cost per day for each acuteness level |
Nursing service for specified acuteness level |
|
Nursing supervision |
Costs related to hotel and dietary functions |
Occupancy and feeding |
Cost per day |
Occupancy per day |
|
Supplies |
|
|
|
|
|
Facilities |
|
|
|
|
|
Dietary |
|
|
|
|
|
Other overhead |
|
|
|
|
|
|
|
|
|
Total cost per day |
recognizes that patients in the same unit need and receive different amounts of nursing care. The diversity in nursing service provided and the amount of money involved are significant. The objective of the ABC system is to measure more accurately how much nursing care each patient requires and to ensure that the patient is charged accordingly.
Each unit's head nurse rates each patient and arrives at a level of “acuteness” on a ten-point scale. Level 10 patients, such as those in cardiac care, need ten times as much nursing care as a level 1 patient. A nursing service charge per day is computed for each level of nursing care activity, and the patient at a particular acuteness level is charged this rate. As a result, each patient's charges reflect more accurately the actual service received. The nursing care activity is driven by acuteness levels. The occupancy and feeding activity is considered a daily cost that is the same for all acuteness levels.10
Using ABC Systems in Railroad Operations
In any given hour, a large freight railroad company operates over one hundred trains, covers thousands of miles, and moves thousands of freight cars. Thousands of shipments are processed every day, each different from the others. To cost this traffic, the railroad company can use a form of ABC, as shown in Exhibit 10-21. If the freight railroad company were to use a costing system with one all-encompassing activity, that activity would be “moving freight,” and the link to service output would be cost per ton mile. But because ton miles of freight arc not alike, the railroad company has to relate characteristics of freight shipments to activities and the cost of these activities..
|
Exhibit 10 -21 ABC System Used in a Railroad Company |
|
|||
|
Resource Categories |
Resource Drivers |
Activity Cost Pools |
Activity Drivers |
Cost of Service |
|
Maintenance of railroads, yards, and structures |
Assignment of resource costs to activity cost pools according to usage |
Moving freight trains |
Cost per gross ton mile |
Gross ton miles per shipment x activity driver |
|
Maintenance of equipment and depreciation |
|
Switching freight trains |
Cost per yard/train switching minute |
Yard/train switching minutes per shipment x activity driver |
|
Transportation support facilities and labor |
|
Handling and depreciation of freight cars |
Cost per freight mile |
Freight car miles per shipment x activity driver |
|
|
|
Handling freight in and out of freight cars |
Cost per ton of freight |
Tons of freight per shipment x activity driver |
|
|
|
|
|
Total costs of a specific shipment |
|
|
|
|
|
|
None of the railroad's functional support costs (i.e., costs of the functional divisions of the railroad) relates directly to a shipment. Therefore, the systems project team defines a series of activities and their costs that could be linked to characteristics of shipments. Then they select activity drivers to assign these costs to specific service outputs. For example, each shipment will be on a freight car that will be handled one or more times in one or more switching yards, which represents an activity. The route and train specifications determine how many switching minutes will he needed. The cost of that switching activity carries its fair share of several functional support costs, such as maintenance of track in the yards, maintenance and depreciation of switching equipment, and labor costs in the yards.
The ABC system enables the railroad to derive the actual cost of each shipment by gathering data each day from many locations on movements of trains and shipments. Also, by using the same activity cost information, the railroad can estimate the cost of future shipments, which helps the marketing department identify profitable business.11 The ABC system necessary to cost railroad services is illustrated in Exhibit 10-22
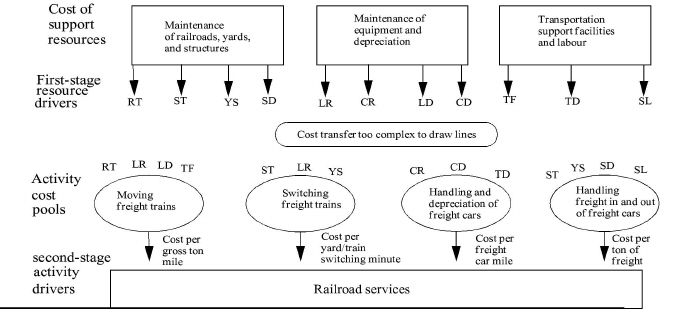
|
. This ABC system is developed using two-stage cost drivers, similar to the ABC system for product costing in the Panametric Corporation example.
Current ABC systems and “control” of excessive complication
There have been a number of important concepts developed, in large part, to keep ABC systems in control. They have also added some analytical clarity. The most important of these concepts was breaking up activities into classes based on the level of the organization that was involved. This is usually called the ABC Cost Hierarchy, and the classes are: Unit, Batch, Product Line, Customer, Facility. Although this system sometimes is difficult to apply it can add to our cost understanding in addition to reducing the number of items that ABC has to deal with.
Of special interest is that it seems to have redefined the concept of “Variable Costs” to leave us with a much more sophisticated way to describe them. Another way to look at ABC is that some activities are paid for at the same rate we use them. It is these activities that are truly “variable”. Not all of them are associated with production of products, however, so the ABC version of variable costing does not boil down to a single number like the traditional version. In fact, you need a chart like Exhibit 10-23 to understand the effect. Basically, anything on the diagonal is fairly easy to explain or forecast since spending will be closely associated with activities. Anything not on the diagonal is difficult to forecast. Unfortunately, almost everything is off the diagonal. This is further evidence that understanding and managing costs is extremely difficult and is important to study.
|
Exhibit 10 -23 Costs Variable by Activity |
||||||
|
|
|
Acquisition, or Spending |
||||
|
|
|
Unit |
Batch |
Product |
Customer |
Facility |
|
Physical activity |
Unit |
|
|
|
|
|
|
Batch |
|
|
|
|
|
|
|
Product |
|
|
|
|
|
|
|
Customer |
|
|
|
|
|
|
|
Facility |
|
|
|
|
|
|
SUMMARY OF LEARNING OBJECTIVES
The major goals of this chapter were to enable you to achieve four learning objectives:
Learning objective 1. Define activity-based costing systems.
Activity-based costing systems measure the cost and performance of resources, activities, and cost objects. Resource category costs arc assigned to activities using resource drivers, thereby forming activity cost pools. Costs from activity cost pools are assigned to cost objects using activity drivers. The key attribute of cost drivers is a cause-and-effect relationship between resources, activities, and cost objects. The relationship is based on the notion that cost objects consume activities and activities consume resources. Both manufacturing and service organizations use ABC systems for cost reporting for a variety of cost objects and for cost management, as shown in Exhibit 10-23
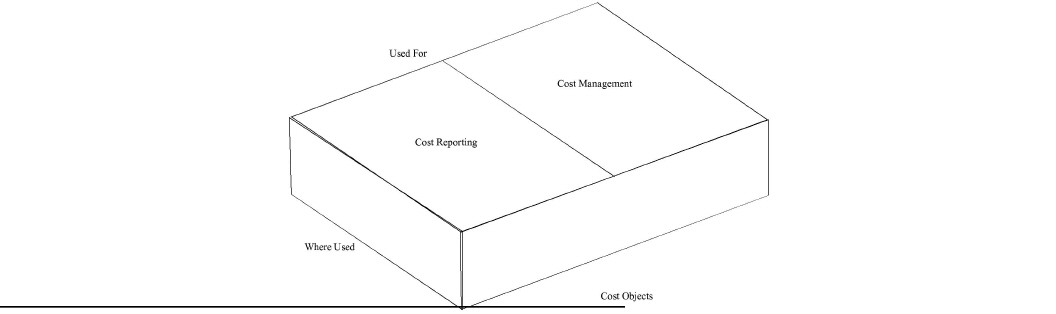
|
. The linkage between cost reporting and cost management indicates that ABC systems are used not just as costing systems but as management tools for the pursuit of excellence.
By understanding where the demands for activities come from, management can focus on eliminating both the demand for the activity and possibly even the activity itself if it does not add value to the enterprise. Cost drivers identify the causes of costs. Thus, management has a tool to address the root causes of costs rather than treating symptoms.
Learning objective 2. Contrast traditional volume-based costing systems with activity-based costing systems.
Traditional volume-based costing systems focus on units of particular products and apply overhead costs on the basis of direct labor hours, direct labor dollars, machine hours, and materials dollars consumed in making the product. By contrast, ABC systems focus on the activities performed to produce or service cost objects. Costs are assigned to cost objects based on each cost object's consumption of activities.
Learning objective 3. Explain how to develop activity-based costing systems.
A multidisciplinary systems project team is chosen to develop the ABC system, which may be a pilot or a full-blown, enterprisewide system. The systems project team follows an engineered, structured methodology called the ABC systems development life cycle, which involves the following phases:
1. Plan the system.
2. Analyze and define resource categories.
3. Analyze and define activities.
4. Determine first-stage resource drivers and establish activity cost pools.
5. Determine second-stage activity drivers and assign costs to cost objects.
The activity flow diagram and the fishbone (cause-and-effect) diagram are two tools used in defining tasks, activities, and activity drivers. The bill of activities provides an excellent method for cost reporting.
Learning objective 4. Discuss how activity-based costing systems are used in service organizations.
Service enterprises have two characteristics that differentiate them from manufacturing enterprises:
• Little to no inventory
• Output that is often intangible and difficult to define
Just as manufacturing enterprises can use ABC systems to help them cost products and practice cost management, so too can service organizations. Like manufacturing firms, service organizations include activities that can be analyzed. Also, cost drivers can be selected and used to apply costs to various services in the same manner as they are used to apply costs to products.
IMPORTANT TERMS
ABC systems development life cycle An engineered, structured methodology used by multidisciplinary systems project teams to develop ABC systems.
Activity A process made up of highly-related tasks that converts inputs to outputs. Activities consume resources to produce outputs.
Activity analysis The process of defining and describing activities and their corresponding cost drivers.
Activity-based costing (ABC) A costing methodology that collects financial and operational data about an enterprise's activities for costing cost objects and providing a tool for cost management.
Activity-based management (ABM) A management approach that uses ABC information to perform continuous improvement, reduce or eliminate nonvalue-added activities, and make strategic decisions.
Activity center A manageable set of activities or activity cost pools.
Activity cost pool An activity that has been assigned its portion of resource costs. Costs from activity cost pools arc assigned to cost objects using activity drivers.
Activity drivers Devices that measure the frequency and intensity of the consumption of activity costs by cost objects. They are used to assign activity costs to cost objects.
Activity flow diagram A modeling tool that describes activities, their interdependencies, and inputs and outputs.
Aggregation The process of combining tasks into homogeneous groups to form a function-specific activity.
Bill of activities A compilation of activities and associated costs required by a cost object. if applicable, direct cost inputs are also included. The bill of activities is a cost report used by management.
Cost objects Anything to which activity costs are assigned.
Decomposition The process of breaking down groups of dissimilar tasks into several function-specific activities.
Direct cost inputs Cost elements, such as direct materials, direct labor, and direct technology, that are easily traceable to cost objects.
Fishbone (cause-and-effect) diagram A modeling tool that defines the tasks that comprise an activity.
Resource categories Areas that represent the sources of costs that support activities-These are the factors of production that are consumed by activities to produce activity outputs.
Resource drivers Devices that measure the quantity of resources consumed by activities- They are used to assign portions of resource category costs to activities.
Tasks The basic work elements of an activity. An aggregation of a set of highly-related tasks makes up a function-specific activity.
DEMONSTRATION PROBLEMS
DEMONSTRATION PROBLEM 1 Activity-based costing versus volume-based costing.
At Milestone Company, product A is a mature product that requires little engineering work. Product B, however, is a relatively new product with some unresolved engineering problems. Following are data related to both products:
|
|
PRODUCT A |
PRODUCT 3 |
|
Production volume |
1,000 |
1,000 |
|
Number of engineering changes |
2 |
12 |
|
Cost per engineering change |
$1,000 |
$1,000 |
|
Direct labor hours per unit |
3 |
2 |
Required:
a. Using direct labor hours (DLhr) as a base for applying overhead costs, calculate overhead cost per unit and total overhead costs.
b. Using an activity-based costing approach, calculate overhead cost per unit and total overhead costs.
SOLUTION TO DEMONSTRATION PROBLEM 1 a.
|
|
Product A |
PRODUCT B |
|
Overhead applied using DLhr overhead cost per unit:* A: $2.80 x 3 DLhr |
$8.40 |
|
|
B: $2.80 x 2 DLhr |
|
$5.60 |
|
Total overhead cost: A: $8.40 x 1,000 units |
$8,400.00 |
|
|
B: $5.60 x 1,000 units |
|
$5,600.00 |
|
* Predetermined overhead rate based on direct labor hours: |
|
|
|
|
|
|
|
Total overhead costs: |
|
|
|
$1,000 per engineering change x 14 engineering changes |
$14,000 |
|
|
Total direct labor hours: |
|
|
|
1,000 units x 3 DLhr = 3,000 1,000 units x 2 DLhr = 2,000 |
/ 5,000 DLhr |
|
|
Predetermined overhead rate |
$2.80 per DLhr |
|
|
|
|
|
|
|
PRODUCT A |
PRODUCT B |
|
Overhead applied using ABC overhead cost per unit: |
|
|
|
A: ($1,000 x 2 engineering changes) / 1,000 units |
$2.00 |
|
|
B: ($1,000 x 12 engineering changes) / 1,000 units |
|
$12.00 |
|
Total overhead cost: |
|
|
|
A: $2.00 x 1,000 units |
$2,000.00 |
|
|
B: $12.00 x 1,000 units |
|
$12,000.00 |
DEMONSTRATION PROBLEM 2 Pilot ABC system for determining customer profitability.
Monarch Equipment Company sells earthmoving equipment to construction companies in the southeastern part of the country. Monarch's manager has been reading about activity-based costing and believes it can be used to help determine customer profitability of Monarch.
The manager wants to start with a pilot ABC system that will include two activities:
• Process sales orders
• Perform field repairs (these are repairs that are under warranty by Monarch)
Analyses reveal that the process sales orders activity includes the tasks of enter sales order, verify credit, calculate freight, schedule delivery, and generate invoice. Further analyses indicate that the perform field repairs activity includes dispatch repair team, travel to destination, perform repairs, and return to home base.
Four resource categories, their budgeted costs, and resource drivers arc as follows:
|
RESOURCE CATAGORY |
Budgeted Costs |
RESOURCE DRIVER |
|
Building depreciation |
$400,000 |
Square feet |
|
Equipment depreciation |
600,000 |
Percentage of usage |
|
Utilities |
180,000 |
Cubic feet |
|
Salaries and benefits |
800,000 |
Direct assignment |
These budgeted costs are for Monarch's entire operation not, just the process sales orders and perform field repairs activities.
Monarch's main building occupies 20,000 square feet, of which 1,000 square feet are devoted to the process sales order activity and 4,000 square feet are allocated to the perform field repairs activity. Five percent of equipment depreciation is charged to the process sales order activity, and 20 percent is charged to the perform field repairs activity. The process sales order activity is charged with $1,600 in utilities based on 8,000 cubic feet at $0.20 per cubic foot. The perform field repairs activity is assigned $6,400 based on 32,000 cubic feet at $0.20 per cubic foot. The process sales orders activity is charged $108,400 in salaries and benefits based on direct assignment. The perform field repairs activity is charged $203,600 based on direct assignment. The process sales orders activity has budgeted 4,000 sales orders; the perform field repairs activity has budgeted 2,000 hours.
Required:
a. Using a fishbone (cause-and-effect) diagram, describe the two activities in terms of their tasks.
b. Develop an ABC design model.
c. Prepare a bill of activities for customer C who made 14 sales orders and consumed 100 hours in field repairs. Customer C purchased $400,000 worth of equipment with cost of goods sold of $260,000.
SOLUTION TO DEMONSTRATION PROBLEM 2
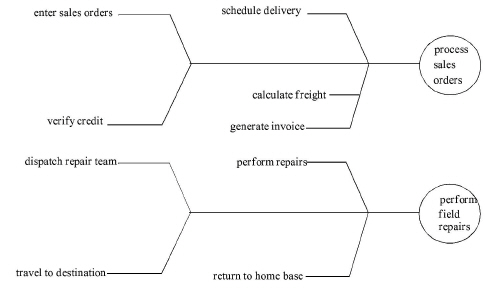
|
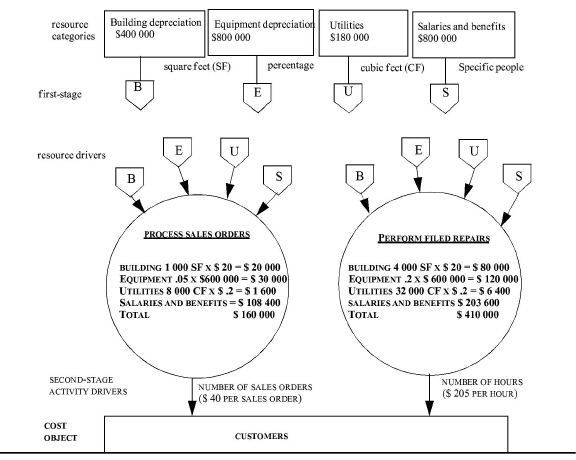
|
|
|
Bill of Activities CUSTOMER C For the period ending december 31, 20x4 |
|
|||
|
Sales |
|
|
$400,000 |
||
|
Cost of goods sold* |
|
|
<260,000> |
||
|
Gross profitLess activity costs: |
|
|
$140,000 |
||
|
* Since Monarch is a distributor, the cost of goods sold is determined by the invoice price charged to monarch by the original component manufacturers. |
|||||
|
Activity Cost Pool |
Activity Driver Rate |
Activity driver Quantity |
Activity Cost |
|
|
Process sales orders |
$40 per sales order |
14 sales orders |
$ 560 |
|
|
Perform field repairs |
$205 per hour |
100 hours |
20,500 |
|
|
Total activity costs |
|
|
|
< 21,060> |
|
Profit generated by Customer C |
|
|
|
$118,940 |
REVIEW QUESTIONS
10.1 In general terms, differentiate the ABC system from the traditional volume-based costing system.
10.2 What are the two main purposes of the ABC system?
10.3 List and briefly describe the components of an ABC system.
10.4 What is the result of assigning resource costs to an activity?
10.5 Explain what is meant by “different levels of cost objects.”
10.6 Why, in some organizations, are costs assigned to different types of cost objects at different levels?
10.7 Cost objects may be assigned costs only from activity cost pools. At the other extreme, cost objects may be assigned direct materials, direct labor, and direct technology costs, as well as costs from activity cost pools. What arc the other two ways costs are assigned to cost objects?
10.8 Give an example of an enterprise that would use direct technology as a direct cost clement.
10.9 Explain why costs of activities are assumed to be variable.
10.10 Why are activity cost pools aggregated in activity centers in some situations?
10.11 What are the four types of cost drivers?
10.12 Why is a transaction-based cost driver preferable in some instances?
10.13 Give an example of a situation where a time-based cost driver is appropriate.
10.14 Give an example of how a cost driver will induce beneficial behavior. Give an example of how a cost driver will induce harmful behavior.
10.15 Give an example of a situation where a volume-based costing system will distort costs.
10.16 Explain how one product may be cross-subsidizing another product.
10.17 In what kind of environments is activity-based costing appropriate?
10.18 What are the three strategic goals of ABC systems?
10.19 List and briefly describe the phases of the ABC systems development life cycle.
10.20 What is the purpose of holding several joint application development sessions?
10.21 Why is it important to involve workers and managers in ABC systems development? Why should the systems project team be multidisciplinary?
10.22 What is the purpose of an activity flow diagram? Name and describe the purpose of each activity flow diagram symbol.
10.23 What is the purpose of a fishbone (cause-and-effect) diagram?
10.24 What is the purpose of aggregation and decomposition? Summarize the rules of thumb for both processes.
10.25 What constitutes an appropriate activity driver per the activity flow diagram? Summarize the rules of thumb for determining activity drivers.
10.26 What is a bill of activities used for?
10.27 List four market-driven cost objects. If an ABC system cannot cost individual customers, what next-level cost object is used?
10.28 Can ABC systems be used in service organizations? Name two types of service organizations in which ABC systems have been successfully used.
CHAPTER-SPECIFIC PROBLEMS
These problems require responses based directly on concepts and techniques presented in the text.
10.29 Activity-based costing and volume-based costing contrasted: cost per setup. Morrison Electronics currently charges setup costs to its products using direct labor hours. Cliff Molson, management accountant, has collected the following data for contrasting the present costing system with an ABC system:
|
|
|
PRODUCT A |
PRODUCT B |
|
|
Production volume |
50 |
1,000 |
|
|
Cost per setup |
$1,000 |
$1,000 |
|
|
Number of setups |
1 |
2 |
|
|
Batch size |
50 |
500 |
|
|
Total cost of setups |
$1,000 |
$2,000 |
|
|
Direct labor hours per unit |
2 |
2 |
|
|
Total direct labor hours |
100 |
2,000 |
Required:
Calculate the amount of setup costs per unit using the activity-based approach and the volume-based approach (i.e., direct labor hours). [Adapted from Peter B. B. Turney]
10.30 Activity-based costing and volume-based costing contrasted: cost per engineering change. National Fabricators uses a costing system that charges its engineering change costs to products using direct labor hours as the application base. The following data were collected during activity analysis:
|
|
PRODUCT C |
PRODUCT D |
|
Production volume |
1,000 |
500 |
|
Cost per engineering change |
$1,000 |
$1,000 |
|
Number of engineering changes |
2 |
10 |
|
Total cost of engineering changes |
$2,000 |
$10,000 |
|
Direct labor hours per unit |
3 |
2 |
Required:
Calculate the engineering change cost per direct labor hour. Then calculate the overhead cost (engineering changes) per unit using the volume-based approach and the activity-based approach. (Adapted from Peter B. B. Turney]
10.31 Costing nursing home services. Shady Pines Nursing Care has established an ABC system as follows:
|
ACTIVITY COST POOLS |
ACTIVITY DRIVER RATE |
||
|
Nursing care |
Acuteness level |
1: |
$ 80 per day |
|
|
Acuteness level |
2: |
160 per day |
|
|
Acuteness level |
3: |
240 per day |
|
|
Acuteness level |
4: |
320 per day |
|
|
Acuteness level |
5: |
400 per day |
|
|
Acuteness level |
6: |
480 per day |
|
|
Acuteness level |
7: |
560 per day |
|
|
Acuteness level |
8: |
640 per day |
|
|
Acuteness level |
9: |
720 per day |
|
Occupancy and feeding |
Acuteness level |
10: |
800 per day
$100 per day |
Required:
Calculate the cost per day to care for a person with an acuteness level of 3.
10.32 Costing a railroad shipment. Rocky Plateau is a small railroad company that hauls commodities, such as lumber, coal, and ore. The following are data from its ABC system:
ACTIVITY COST POOLS ACTIVITY DRIVER RATES
Move freight train $0.60 per gross ton mile
Switch freight train $100.00 per minute
Handle freight cars $0.20 per freight car mile
Load and unload $20.00 per gross ton
Required:
Calculate the cost of a one-ton shipment that will travel 200 miles and require one minute of switching of one freight car.
THINK-TANK PROBLEMS
Although these problems are based on chapter material, reading extra material, reviewing previous chapters, and using creativity may be required to develop workable solutions.
10.33 Setting up an activity center, activity cost pools, and cost drivers. The process of designing and implementing an ABC system for support departments usually begins with interviews of the department heads. The interviews yield insights into departmental operations and into the factors that trigger departmental activities. Subsequent analysis traces these activities to specific products.
The following example illustrates the ABC process for an inventory control department responsible for raw materials and purchased components. The annual costs associated with the department (mainly personnel costs) are $500,000.
Q: How many people work for you?
A: Twelve.
Q: What do they do?
A: Six of them spend most of their time handling incoming shipments of purchased parts. They handle everything--from documentation to transferring parts to the WIP stockroom. Three others work in raw materials. After the material clears inspection, they move it into inventory and take care of the paperwork.
Q: What determines the time required to process an incoming shipment? Does it matter if the shipment is large or small?
A: Not for parts. They go directly to the WIP stockroom, and unless the shipment is extremely large, it can be handled in one trip. With raw materials, though, volume can have a big effect on processing time. But there are only a few large raw material shipments. Over the course of a year, the time required to process a part or raw material really depends on the number of times it's received, not on the size of the shipments in which it comes.
Q: What other factors affect your department's work load?
A: Well, there are three people I haven't discussed yet. They disburse raw materials to the shop floor. Again, volume is not really an issue; it's more the number of times materials have to be disbursed.
Q: Do you usually disburse the total amount of material required for a production run all at once, or does it go out in smaller quantities?
A: It varies with the size of the run. On a big run, we can't disburse it all at once-there would be too much raw material on the shop floor. On smaller runs-and I'd say that's 80% of all runs-we'd send it out in a single trip once setup is complete.
In 20x5, this company received 25,000 shipments of purchased parts and 10,000 shipments of raw materials. The factory made 5,000 production runs.
The company manufactures 1,000 units of product A in a year. Product A is a complex product with more than 50 purchased parts and several different types of raw material. During the year, the 1,000 units were assembled in 10 different production runs requiring 200 purchased parts shipments and 50 different raw material shipments.
Product A also consumed 1,000 hours of direct labor out of the factory's total of 400,000 hours.
Required:
a. Draw a large rounded rectangle and label it “Inventory Control Activity Center.” Within this rectangle, set up three activity cost pools appropriately titled. Assign the inventory control department's annual costs to the activity cost pools using an appropriate assignment base. Then show three arrows, one from each activity cost pool, pointing to a rectangle called “Product A.” Identify an appropriate cost driver for each activity cost pool. Alongside the name of each cost driver, place the cost per transaction of each cost driver.
b. Calculate the inventory control costs for each unit of product A using the ABC model you just designed. Also, using direct labor hours as your base, apply inventory control costs to product A.
c. Calculate the cost difference between the activity-based costing approach and the labor-based costing approach. Explain why the two approaches differ. State which cost figure you have the most faith in and explain why.
[Adapted from Robin Cooper and Robert S. Kaplan]
10.34 Distinguishing between traditional costing and activity-based costing systems. Many companies now recognize that their costing systems are inadequate for today's powerful global competition. Managers in companies selling multiple products are making important product decisions based on distorted cost information, as most cost systems designed in the past focused on inventory valuation. To elevate the level of management information, current literature suggests that companies should have as many as three costing systems for (1) inventory valuation, (2) operational control, and (3) activity-based costing, which is also known as individual product cost measurement.
Required:
a. Discuss why the traditional costing system, developed to value inventory, distorts product cost information.
b. Identify the purpose and characteristics of each of the following cost systems:
1. Inventory valuation.
2. Operational control.
3. Activity-based costing.
c. Do the following:
1. Describe the benefits that management can expect from activity-based costing.
2. List the steps that a company that uses a traditional costing system would take to implement activity-based costing. [CMA adapted]
10.35 Traditional costing system versus activity-based costing system. The following overhead cost data relate to Huron Industries:
|
Product |
Costs Related to Direct Labor |
Costs Related to Setups |
Costs Related to Part number |
|
P1 |
5 direct labor hours |
1 setup |
1 part number |
|
P2 |
50 direct labor hours |
3 setups |
1 part number |
|
P3 |
15 direct labor hours |
1 setup |
1 part number |
|
P4 |
150 direct labor hours |
3 setups |
1 part number |
|
|
220 direct labor hours |
8 setups |
4 part numbers |
|
Overhead costs |
$5,764 |
$2,160 |
$2,000 |
|
Total overhead costs |
$9,924 |
|
|
Required:
a. Calculate the overhead unit costs reported by a traditional costing method using direct labor hours as the base.
b. Calculate the overhead unit costs reported by an ABC system using number of direct labor hours, number of setups, and number of part numbers as cost drivers.
[Adapted from Robin Cooper]
10.36 Designing an activity-based costing system. Thortec Industries manufactures different electronic components used in computers. One of these components is a PC board. Its present costing system includes three cost elements:
• Direct materials
• Direct labor
• Overhead
Overhead is applied to products using direct labor dollars. Direct labor represents less than 2 percent of total manufacturing costs. Over 30 minutes of direct labor time per person each day is spent on vouchering labor time directly to individual products.
Sammi Lin, CEO, has become very disenchanted with the present costing system and has hired Teri Alvarez, newly graduated management accountant, to develop a costing system that will produce reasonably accurate cost information.
Teri started by identifying the categories of manufacturing overhead costs. She identified two broad categories: procurement manufacturing overhead and production manufacturing overhead. She analyzed procurement and determined that it was composed of six highly-related activities:
• Parts ordering
• Incoming inspection
• Counting parts
• Documentation
• Movement
• Storage
Teri decided to aggregate these activities into one activity cost pool called “procurement activity cost pool.” Further analysis indicated that the number of parts was highly correlated with the procurement activity cost pool. The PC board requires 94 parts, and the procurement overhead is costed at $0.10 per part.
She analyzed the production manufacturing overhead and identified several activities. She grouped the start station activity and the following insertion activities together:
• Axial insertion
• Dip insertion
• Manual insertion
• Backload insertion
Fred Baxter, process engineer, was shocked! He explained, for example, that axial components were much less expensive to insert than dip components. He urged Teri to differentiate between the start station and insertion activities. Upon further analysis, Teri identified the following activities and their drivers:
• Start station and number of raw PC boards (source of raw PC boards is the stockroom) [1 board @ $0.90 each]
• Axial insertions and number of axial insertions [43 @ $0.06 each]
• Dip insertions and number of dip insertions [130 @ $0.17 each]
• Manual insertions and number of manual insertions [13 @ $0.35 each]
• Backload insertions and number of backload insertions [6 @ $0.58 each]
• Teri had also aggregated wave solder, test, and defect analysis into one activity. After further analysis, she decomposed these activities as follows:
• Wave solder and number of boards soldered [1 board @ $2.50 each]
• Test and standard time board in test [0.2 hour @ $70.00 per hour]
• Defect analysis and standard time for defect analysis and rework [0.08 hour @ $6200 per hour]
Required:
• a. Explain how direct labor cost should be handled.
• b. Develop the final activity flow diagram that models the procurement and production overhead activities.
• c. Calculate the cost per PC board for the following:
• Procurement activities
• Production activities
• d. Comment on how employees at Thortec are likely to view the new costing system.
[Adapted From Debbie Berlant, Reese Browning, and George Foster]
10.37 Bill of activities and standard costs. Following are the budgeted data for the Stormor Corporation:
|
Production Budget For the Period Ended December 31, 20x5 |
|
|
|||
|
|
Budgeted production volume: |
|
|
|
|
|
|
Product A Product B |
|
100,000 units 200,000 units |
|
|
|
|
Total production for the period |
|
300,000 units |
|
|
|
|
Budgeted production costs: |
|
|
|
|
|
|
Direct technology: |
|
|
|
|
|
|
Product A Product B |
$20,000 80,000 |
$100,000 |
|
|
|
|
Activity cost pools: |
|
|
|
|
|
|
Purchasing Quality control Maintenance Warehousing Expediting |
$25,000 30,000 5,000 75,000 30,000 |
165,000 |
|
|
|
|
Total production costs |
|
$265,000 |
|
|
Direct materials costs are not included in the production budget. Also, because Stormor is highly automated and all labor is handled as indirect labor, a direct labor cost element is not included in the budget.Direct technology runs at 80 units per hour to produce product A and 40 units per hour to make product B. Product A requires 1,250 hours of machine time per year, and product B requires 5,000 hours. Direct technology costs are assigned to the products on the basis of machine hours.Activity drivers for Stormor's ABC system follow:
|
|
|
|
|
|
ACTIVITY |
ACTIVITY DRIVER |
PRODUCT A |
PRODUCT B |
|
Purchasing |
Number of purchase orders per 1,000 units of finished product |
10.0 |
7.5 |
|
Quality control |
Number of hours of quality testing per 1,000 units of finished product |
10.0 |
2.5 |
|
Maintenance |
Number of hours of equipment maintenance per 100 hours of machine time |
4.0 |
1.5 |
|
Warehousing |
Number of units of finished product per pallet |
40.0 |
40.0 |
|
Expediting |
Number of units of finished product |
100,000 |
200,000 |
|
|
|
|
|
Required:
a. Prepare a bill of activities for product A and product B as of December 31, 20x5, assuming that the budgeted amounts are the actual amounts.
b. Following are the actual production data for the period:
|
|
PRODUCT A |
PRODUCT 13 |
|
Production volume |
110,000 Units |
180,000 Units |
|
Direct technology |
$ 30.000 |
$ 62,000 |
|
Purchasing |
12,000 |
14,000 |
|
Quality control |
21,000 |
11,000 |
|
Maintenance |
2,400 |
2,200 |
|
Warehousing |
27,000 |
44,000 |
|
Expediting., |
13,200 |
18,000 |
|
Total actual costs |
$105,600 |
$151,200 |
Prepare two bills of activities (including direct technology), one for product A and one for product B, showing the standard product costs (i.e., those established by the budget) adjusted to actual costs per unit. The differences between actual and budgeted will be “spending” variances similar to those calculated in Chapter 8.
c. Briefly contrast the traditional standard costing approach covered in Chapter 8 with the ABC approach in terms of variance analysis.
10.38 Overhead variances adapted to ABC. A move materials activity cost pool is budgeted with $20,000 for the forthcoming period. Production volume is budgeted at 100,000 units of Doohickeys, the company's only product. The quantity of move materials transactions necessary to support this level of production volume is 10,000. During the period, 102,000 Doohickeys were produced. The actual costs of the move materials activity are $23,100. The number of move materials transactions necessary to produce the 102,000 Doohickeys is 10,500.
Required:
Adapt material covered in Chapter 8 and calculate the spending and efficiency variances for the move materials activity.
10.39 Costing market-driven activities and determining operating income by sales territory and by product line. Following is product line information for Teco Corporation:
|
|
PRODUCTLINE |
||
|
PRODUCT LINE INFORMATION |
A |
B |
C |
|
Selling price Unit manufacturing cost Quantity of units sold and shipped Average weight of units Number of sales orders |
$10.00 $8.00 50,000 3 lb. 200 |
$8.00 $5.00 40,000 4 lb. 150 |
$12.00 $11.00 30,000 6 lb. 100 |
|
The market-driven activity information follows: |
|
|
|
|
|
|
|
Marketing Activity Costs |
|
|
Marketing Activity Cost Pools |
Activity Drivers |
Quantity |
Total |
Unit Rate |
|
Selling |
Dollar value of sales |
$1,180,000 |
$59,000 |
5.0% |
|
Advertising |
Quantity of units sold |
120,000 units |
$36,000 |
$0.30 |
|
Warehousing |
Weight shipped |
490,000 lb. |
$49,000 |
$0.10 |
|
Packing and shipping |
Quantity shipped |
120,000 units |
$30,000 |
$0.25 |
|
Administration |
Number of sales orders |
450 sales orders |
$22,500 |
$50.00 |
|
|
|
|
|
|
Sales and orders by sales territories are presented below:
|
|
|
Product Line |
||
|
Transaction By Sales Territory |
Total |
A |
B |
C |
|
Products sold (units): |
|
|
|
|
|
East sales territory |
70,000 |
28,000 |
24,000 |
18,000 |
|
West sales territory |
50,000 |
22,000 |
16,000 |
12,000 |
|
Totals |
120,000 |
50,000 |
40,000 |
30.000 |
|
Sales orders: |
|
|
|
|
|
East sales territory |
290 |
110 |
100 |
80 |
|
West sales territory |
160 |
50 |
80 |
30 |
|
Totals |
450 |
160 |
180 |
110 |
Required:
a. Using a traditional operating income statement format, present operating income by sales territory and operating income by product line. Assume the period ends December 31, 20x5.
b. State what the operating income statements reveal and what management action is warranted.
c. Mention another operating income statement that would reveal information with even greater detail.
10.40 Determining what really drives costs. Diamond Industries is a “lights out” fully automated plant with no direct labor. The plant is composed of two activity centers: AC1 and AC2. Diamond makes product A and product B.
Diamond Industries has budgeted 40,000 total machine hours (20,000 to ACl and 20,000 to AC2) for the forthcoming period. Power is budgeted at $60,000, and setup costs are budgeted at $83,200. The budget calls for 5,000 units of each product to be produced during the period. Each product requires two hours of machine time in AC1 and two hours of machine tithe in AC2. Machine costs are charged at a rate of $30 per hour in AC1 and $12 per hour in AC2, not counting power and setup costs. AC1 consumes power at $2.25 per machine hour. AC2 consumes power at $0.75 per machine hour.
Setup costs for each product are as follows:
|
AC1: |
|
|
|
Product A: Product B: |
($1,000 x 2 setups) = ($1,000 x 50 setups) = |
$ 2,000 $50,000 |
|
Total setup costs of AC1 |
|
$52,000 |
|
AC2; |
|
|
|
Product A: |
($600 x 2 setups) = |
$ 1,200 |
|
Product B: |
($600 x 50 setups) = |
30,000 |
|
Total setup costs of AC2 |
$31,200 |
|
The two products require different amounts of setups because product A. has a simplified design requiring only two setups in each activity center. Product B has a more complex design requiring different attaching devices. For each run of 100 units of product B, a new attaching device is required, thus causing a new setup. The setup costs per unit are calculated as follows:
AC1:
Product A: ($2,000 / 5,000 units) = $0.40 per unit
Product B: ($50,000 / 5,000 units) = $10.00 per unit
AC2:
Product A: ($1,200 / 5,000 units) = $0.24 per unit
Product B: ($30,000 / 5,000 units) = $6.00 per unit
Required:
a. Draw an ABC systems model. The first-stage resource drivers are number of machine hours and number of setups. The activity cost pools in each activity center are power, setups, and machine. The activity drivers are number of machine hours and number of units.
b. Using the ABC systems model, calculate the total costs per unit for product A and product B. Assume that 5,000 units of each product were manufactured and sold. Explain why product B's costs per unit are greater than product A's.
c. Combine the setup costs with machine costs, and apply these combined costs and power costs to both products on the basis of machine hours. What are the total costs per unit of each product now? Again, assume that 5,000 units of each product were manufactured and sold.
d. Assume that the sales price is $96 for product A and $100 for product B. Determine the profit (loss) of each product using the costing systems of Requirements (b) and (c). What is management's likely decision if Diamond costs its products in accordance with the costing system of Requirement (b)? Requirement (c)? Which costing system do you recommend? Explain why.