Chapter 17 : Strategic Planning and the Master Budget
LEARNING OBJECTIVES
Learning objective 1. Discuss strategic planning and list its component steps.
Learning objective 2. Define the budgets that make up the master budgeting process.
Learning objective 3. Prepare the operating budgets for a manufacturing enterprise.
Learning objective 4. Explain how operating budgets are used in merchandising and service firms.
Learning objective 5. Describe how operating budgets are used to facilitate planning, controlling operations, and evaluating performance.
INTRODUCTION
The master budget is a vital tool that management accountants can use to assist enterprise members in planning, controlling, and evaluating activities. Before any budget is prepared, however, an enterprise should develop a strategic plan.
Once an enterprise has developed a strategic plan, the next step is to translate this plan into short-term and long-term budgets for implementation. The master budget contains both the short-term operating budgets and the long-term capital budget. The master budget translates and summarizes the financial results of the strategies chosen for the upcoming year. The strategies (plans) an enterprise chooses are directed toward accomplishing its goals. In this way, the budgets provide a tight, goal-congruent, rational linkage with the strategic plan.1
STRATEGIC PLANNING
Strategic planning is defined by the Institute of Management Accountants as a systematic and formalized process for purposefully directing and controlling future operations toward desired objectives for periods extending beyond one year. The strategic planning process begins with a mission statement (see p. 782), which sets out the enterprise's purposes. These should include both the business purposes and the social (responsibility) purposes to employees, the community, and the environment. Bently Nevada Corporation's mission statement is the first of six steps in the strategic planning process, shown in Exhibit 17-1.
|
Exhibit 17-1 Steps in the Strategic Planning Process |
|
|
Step 1 |
Define the enterprise’s mission and prepare a formal mission statement |
|
Step 2 |
Establish objectives that, if achieved, should accomplish the mission. |
|
Step 3 |
Define operating goals for the master budget period. |
|
Step 4 |
Analyze the external and internal environment |
|
Step 5 |
Determine strategies (actions) to capitalize on external opportunities and internal strengths and to overcome external threats and internal weaknesses. |
|
Step 6 |
Measure results against the strategies planned. |
Defining Objectives and Goals
Objectives are long-run statements of what the enterprise wants to accomplish. They serve as criteria for assessing long-run effectiveness. Objectives should be linked to the mission, so that if they are realized, organizational survival should result. Goals are measurable translations of objectives. They are bound by a time period, usually the master budget time frame (the budget horizon). Progress toward goal achievement is measured by the management accounting system and other information systems (manufacturing and marketing LANs, for example)2. Objectives and goals are often found in the Management Letter included in annual statements and in the Articles of Incorporation.
Among the objectives IMAX (see p. 783) includes in its mission statement are the following:
|
INSIGHTS & APPLICATIONS Strategic Priorities In day-to-day business activities, as well as in long-term planning, strategic decisions must be made. It is vital that a framework for decision making be established that accurately reflects corporate priorities and promotes consistency. At Bently Nevada we have the following priorities: Safety We continuously strive to create a safer workplace for our employees and to produce products that function at peak performance and safety levels. We will only design and market systems that reliably and effectively monitor the behavior of your machinery. Safety also applies to the environment. Bently Nevada is concerned about ecology and is taking every step possible to ensure protection of the environment. |
Quality We define quality as “conformance to customer require-menu.” Second only to safety, our highest priority is to consistently provide high quality products and services. Above all, we have a deep commitment to continually improve the way we assist our customers. We've worked hard over the past 35 years to achieve our reputation as the top vendor in our industry and we are proud of it! Timeliness Fast, reliable deliveries and prompt replies to inquiries are essential to our mutual success. Although timeliness is of the utmost importance, we will never jeopardize safety or quality to meet deadlines. Cost We will continue to provide products of increasingly better value through improved technology and better manufacturing methods. This process of continuous improvement allows us to pass along savings to you. Our commitment to you is to provide the best value in the industry. Courtesy of Bently Nevada Corporation |
• Create a world-class manufacturing environment
• Obtain a 10 percent market share in the next five years
For the upcoming year, IMAX has established four goals:
• To provide customer service and flexibility, IMAX has a three-day cycle time policy for custom configurations and a two-day shipping time policy on standard configurations.
• To maintain high quality and low inventories of materials, IMAX is developing relationships with a few high-quality suppliers.
• To promote a team concept, cross-training programs, just-in-time (JIT) cells, and quality circles have been made integral parts of the management plan.
• To work toward its 10 percent market share objective, IMAX has set a sales goal of 3,200 Highstepper Pentiums for the upcoming year.
Considering External and Internal Critical Factors
Strategic planning attempts to develop a combination of strategies to maximize the enterprise's performance while considering all critical factors, both external and internal.
External critical factors include the following:
• Customers
• Vendors
• Shareholders
• Government
• Competitors
• Product or service life cycles
Internal critical factors include the following:
• Employees
• Activity-based management (ABM)
|
INSIGHTS & APPLICATIONS IMAX Computers and the Highstepper Pentium “'Managing a new venture is often a greater challenge than managing an established business. To meet this challenge, it is critical that the start-up company implement a comprehensive budgeting process. |
IMAX Computers, a small start-up company, offers a new line of personal computers known as Highstepper. Competition in the PC industry is intense, and the technology can change rapidly. Flexibility, quality, and customer service are key success criteria. IMAX management believes their market niche is in the west coastal United States. In the short run, to establish itself, IMAX is concentrating its marketing efforts in this region. In the long run, national and international sales will be important for growth. Consequently, the Highstepper is advertised in national trade publications and at trade conventions. |
• Total quality management (TQM)
• Logistics
• Target costing, new product development, and life cycle analysis
• Throughput analysis
• Constraint optimization
These, and other, critical environmental factors can be organized into the organization's internal strengths and weaknesses, and its external opportunities and threats (SWOT). SWOT takes into account the interactions between the organization and its environment with respect to what the organization does or plans to do (its objectives and goals). Management should understand;
• What the organization can do well
• What it cannot do very well
• Where it is vulnerable
• What countermeasures are appropriate against these vulnerabilities
• Where the opportunities are
• How to take advantage of those opportunities
By using SWOT as a guidepost, alternate courses of action can be evaluated to determine how well the enterprise overcomes its weaknesses and threats, and capitalizes on its strengths and opportunities in attempting to achieve its goals and objectives.
The internal environment revolves around the corporate culture. Culture is composed of generally accepted rules of behavior passed from generation to generation of employees. Five basic elements influence corporate culture:
• The internal environment created by management
• Its values
• Its heroes
• Rites and rituals (regular social activities)
• The informal communication (cultural) network
The external environment can be characterized in six dimensions:
• The firm's competition
• Its legal and political environment
• Economic conditions
• External social and cultural values and customs
• Technological environment within the industry
• International business and cultural environments3
|
INSIGHTS & APPLICATIONS Monsanto's Introduction of Cycle-Safe Monsanto's efforts to introduce Cycle-Safe illustrate the impact of a firm's external environment and the difficulty in predicting management's future environment. |
Although Monsanto went to great lengths to ensure the safety of Cycle-Safe and received a favorable response to the new product, management did not anticipate the FDA ban. Two dimensions of the external environment—legal and social-cultural—impacted on Monsanto. The company believed that the FDA ban was largely the result of the intense environmental concerns that permeated society at the time. Monsanto took a proactive stance to the FDA ban of Cycle-Safe. First it initiated legal action... [then] Monsanto refiled Cycle-Safe with the FDA and finally received its approval. |
Analyzing and predicting the external environment, even in the short run of the master budget horizon, can be at best risky and at worst uncertain:4
IMAX, in considering its sales goal and its goals for the world-class manufacturing objective, identified a number of external opportunities and threats:
• Many customer orders are for standard configurations. Therefore, many High-stepper Pentiums can be manufactured in a continuous (process) flow. While this can smooth production operations, a three-day finished goods inventory will have to be maintained because of the inherent variability in sales and because IMAX, as a start-up company, is unable to forecast short-term demand accurately.
• Although a few high-quality suppliers are available in the Silicon Valley area of northern California, establishing frequent deliveries (i.e., daily) for a JIT supply situation is not likely in the short run. A 10-day lead time is required for PC boards.
• IMAX chose to locate in Reno, Nevada, because of the area's distribution channels to the primary West Coast market and its low business and property taxes. Also, IMAX management feels it can establish a good relationship with the local government, and obtain favorable tax status by building a factory there.
• Through the local banking community and the Small Business Development Center at the University of Nevada, Reno, IMAX can apply for an SBA loan and develop long-run relationships for creating an EDI system.
• The new national government appears ready to support a proposed amendment to the Americans with Disabilities Act that will provide funding for small businesses with active policies for employing the handicapped.
IMAX management also has identified certain internal strengths and weaknesses that can impact its goal achievement:
• Production and administration facilities can be designed to facilitate efficient operations by handicapped employees. Many of the production processes are amenable to wheelchair-bound employees. Since IMAX is a new company, the plant and administration facilities can be designed for easy access and travel by handicapped employees. For example, fairly cheap land allows for single-story construction. When purchasing office equipment, two-drawer file cabinets (instead of four-drawer) should be selected to allow easy access by handicapped personnel.
• Employees are willing to learn and are motivated to produce high-quality computers. They are also able to design the technology platforms needed to become a world-class manufacturer. These include the ICBIS's LANs and an EDT system for suppliers and some customers.
• The owners have insufficient funds for capital improvements and working capital. This problem can be partly mitigated by the availability of SBA loan guarantees and possibly funds from special federal programs (noted above).
• To help overcome the funding problems, employees are willing to participate in a futures option in a stock purchase program if and when IMAX publicly offers stock (part of the five-year plan).
Setting Strategies
A strategy is a method or action to achieve a goal. For example, installation of new production facilities to make turbochargers for diesel engines represents a new program for an enterprise. Locating the facilities near a truck manufacturer and becoming the manufacturer's major AT supplier represents a strategy. With a clear mission, it is easier to perform sales forecasting and coordinate resources so activities and departments can work together for a common purpose. All people throughout the organization know what business they are in, what their purposes are, how they plan to conduct business, who their customers are, and what will be required to get the job done right the first time.
To ensure goal congruence and rational linkages in the strategic plan, environmental SWOTs should be matched with goals that they can affect. Strategies (and tactics, or specific plans of action) should be matched with specific environmental factors. Matching strategies and environmental factors promotes a proactive (rather than reactive) stance as management attempts to influence the enterprise's environmental dimensions.
Measuring Results
Each action should have a desired result that can be specified in a measurable way. The financial outcomes desired can then be compared against actual results. Profit variances are calculated to measure these differences just as cost variances are used to compare standard and actual costs.'
Variance analysis should not be restricted to budget-to-actual comparisons for the master budget period, however. Long-range trend comparisons illustrating the changes in budgets, standards, and variances should also be presented, possibly with the use of spreadsheet graphics, to facilitate continuous improvement. The effectiveness criteria developed by the firm should reflect where it is in its life cycle. Short-run criteria emphasize production and sales effectiveness, efficiency, and customer satisfaction. Both sets of stakeholders, external customers and employees, should be considered. Measures of product quality, on-time delivery, and service are important external customer criteria. Measures of employee turnover, absenteeism, attitudes, and learning are important “internal customer” criteria. Long-run criteria measure the changes in short-term results over time and additionally include overall organizational changes in flexibility and adaptivity.5
THE MASTER BUDGET
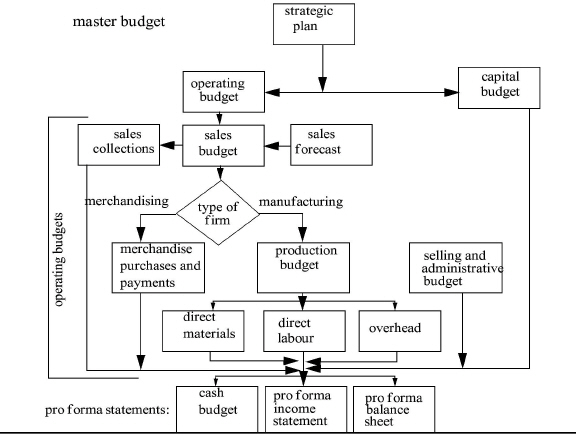
The master budget is a quantitative expression of a plan of action usually for the forthcoming fiscal year. It is a comprehensive set of all operating budgets and includes budgeted financial statements as well as a capital budget. The master budget model is illustrated in Exhibit 17-2.
|
Exhibit 17-2 The Master Budget Model |
|
Strategic Planning Compared with Budgeting
Strategic planning is different from preparing annual budgets, although the two are interrelated. One chief difference is the time period involved. Budgeting primarily involves one year, whereas strategic planning ultimately covers a period that can be three years, ten years, or more, depending on the firm's mission and objectives. The strategic plan is long range; the annual budget is short range. They are interrelated because the master budget is a tool used to achieve one or more of the actions outlined in the strategic plan.
Another difference is that the strategic plan contains relatively little financial data, whereas the master budget is financially based. The main parts of a strategic plan are narrative, for example: “To increase the quality of our products and decrease costs of quality, a total quality management (TQM) system should be implemented.” The objective is in normal type and the goal is italicized. Other examples follow the same pattern:
• “To increase after tax return to shareholders from 12 to 18 percent during the next five years, we need to increase sales from $50 million to $90 million during this period by decreasing time-to-market of new products by 20 percent.”
• “To increase our market share from 16 to 20 percent within the next four years, we must decrease our delivery time by 30 percent.”
• “To reduce production costs by 20 percent within two years, we must eliminate nonvalue-added activities and reengineer value-added activities.”
Role of Management Accountants in Strategic Planning and Budgeting
To a great extent, the reasons for strategic planning and budgeting are to enable management to re-engineer and continuously improve the organization, ensuring its success. During strategic planning, management accountants should review the mission, objectives, goals, and strategies looking for conflicts. For example, an enterprise might be reducing raw materials costs by substituting cheaper materials, while at the same time attempting to eliminate internal and external failure costs. These may be in conflict unless the cheaper raw materials meet quality standards. If this is indeed the case, then both can be achieved. On the other hand, if a trade-off is necessary, the people involved should be made aware which one has the greater priority.
Management accountants can also assist managers in determining how they should change the current situation to improve performance6. In simple terms, the enterprise must know where it is before it can determine where it wants to be.
Further, management accountants can provide reports comparing actual to budget. They can also develop a broad range of performance measurements. Both financial and non-financial information serve as a backdrop for strategic planning and budgeting; for example, product or service costs, activity analysis (e.g., determination of nonvalue-added activities), costs of quality, logistics costs, target costs, life cycle analysis, throughput, and constraint analysis can all be used.
Consequently, modern management accountants perform many roles in the strategic planning and master budgeting process. They serve as organizers, over-seers, facilitators, and even “number crunchers7”. As already noted, a link should exist between strategic planning and the master budget. The principal people who “audit” this link are management accountants. The manner in which the budgeting process is performed and the frequency of budget revisions can promote this linkage.
Many traditional enterprises prepare annual budgets using last year's budget and actual results as a starting point. The upcoming year's budget often simply adjusts the previous year's budget by changing prices without necessarily questioning the validity or appropriateness of last year's expenditures with respect to the organization's strategic plan. One of the main pitfalls with this approach is that the budgeting process may not give adequate consideration to continuous improvement. Implicitly, projected expenditures are justified because the activities creating them were accepted as legitimate last year. Another serious pitfall, especially prevalent with governmental operations in adverse economic environments, is the attitude of “spend it or lose it.” If any efficiencies have resulted in cost savings, the surplus funds are spent at the end of the fiscal year on nonbudgeted items. This frantic spending occurs because the responsibility center managers fear that their budgets will be cut if they do not spend all the funds budgeted in the previous year.
Zero-based budgeting presents an alternative approach to the incremental budgeting process just described. Under zero-based budgeting, each activity, department, or division is periodically rolled back to a zero budget and evaluated critically. Then, each responsibility center manager has to justify every activity and its costs as a condition of the responsibility center's continuation or elimination. Some businesses and government agencies apply zero-based budgeting during strategic planning, activity-based management (ABM), and reengineering initiatives, as discussed in Chapter 11.
Zero-based budgeting can be used as a tool for allocating funds for the annual master budget. Traditionally, incremental budgets worked on the assumption that all activities were worthy of receiving budget increases to cover increasing costs. The question, therefore, was not whether to continue the activity, but rather how much the current level of funding should be increased. In contrast, zero-based budgeting questions each activity in the current budget and determines whether it should be supported as is, re-engineered, or eliminated, consistent with the objectives and goals in the strategic plan.
The budget horizon is the length of time the master budget covers. Master budgets normally span the fiscal year of an enterprise. To achieve effective decision making and cost management, annual operating budgets are usually broken down into shorter time periods, such as quarters, months, or weeks. A frequent variation of the fiscal-year operating budget is the continuous budget in which a 12-month forecast is always available by adding a month or a quarter in the future and dropping the month or quarter just ended. This rolling budget process reflects the dynamics of the enterprise and forces managers to rethink operations constantly no matter what time of the year it is.
Integrated computer-based information systems (ICBISs) with comprehensive databases are especially useful in supporting continuous budgeting. By using simulation models, forecasting techniques, and electronic spreadsheets, managers can determine the impact of various operating alternatives on the master budget and generate the results almost instantaneously. For example, if the cost of raw materials has changed significantly or a competitor is setting lower prices that have to be met, computer programs can quickly produce revised operating budget alternatives that reflect the new raw materials costs and management's new pricing decisions. Management then selects the operating budget that appears to be most feasible for the forthcoming period. Management also may want to analyze the effect of adding or dropping a product line. Computer programs can update current budgeted data, answer what-if questions, and generate a new master budget showing the effects of alternative proposals.
The Master Budget Components
An operating budget (the major subject of this chapter) is the first part of the master budget, representing expected results of operations. For manufacturing firms, it contains the sales, production, direct materials, direct labor, manufacturing overhead, and selling and administrative expense budgets. In merchandising firms, the budgets for manufacturing costs are replaced with budgets for merchandise purchases and payments, as shown in Exhibit 17-2. Service enterprises have only sales and expense budgets.
The operating budget serves many roles in strategic planning, master budgeting, and responsibility accounting:
• An operating budget is a planning tool because it is a written plan for the future operations of an enterprise congruent with the strategic planning objectives.
• An operating budget is a control tool because it helps manage sales, costs, and profits by setting guidelines. People are less inclined to spend money for things that are not needed if they know all expenditures will be compared with specific line items in the budget.
• An operating budget is a performance evaluation tool because budgets can reveal the progress, or lack of progress, of managers. A budget, therefore, is just as likely to enhance a manager's career as it is to be detrimental to a manager's career.
• Moreover, managers can also use budgets as self-evaluation tools.
• An operating budget can be a motivational tool, especially when managers and workers take part in preparing the budget. If, on the other hand, the budget is forced on them, the budget will probably be viewed as a threat.
• An operating budget is a means of communication and coordination. A budget conveys the objectives the enterprise is trying to achieve.
The capital budget focuses on planned capital outlays for property, plant, and equipment. It is a listing of all approved long-term expenditures planned to improve an enterprise's operating capacity and efficiency. The capital budgeting methodology is covered in Chapters 22 through 24.
The master budget culminates in estimated financial statements, referred to as pro forma statements. These statements include the following:
• Cash budget
• Budgeted income statement
• Budgeted balance sheet
STEPS IN PREPARING THE OPERATING BUDGETS
Preparing the operating budgets involves the following eight steps:
l. Make a sales forecast.
2. Prepare the sales budget.
3. Develop the production budget.
4. Prepare the direct materials purchases budget.
5. Prepare the direct labor budget.
6. Prepare the manufacturing overhead budget.
7. Prepare the selling and administrative expenses budget.
8. Prepare budgeted financial statements.
These steps are addressed in the following sections.
Step 1: Make the Sales Forecast
The sales forecast is a projection of the number of products to be sold within the budget horizon. It is the basis of the sales budget, which, in turn, is the basis for all of the other operating budgets. Consequently, the accuracy of the sales forecast directly affects the reliability of the master budget.
Sales forecasts can be classified in many ways. Among the most common are sales by products, by product lines, by distribution channels, by class of customer, and by territories. The following methods are normally used to forecast sales:
• Estimate method
• Statistical method
THE ESTIMATE METHOD. The estimate method is essentially subjective and assumes that the forecaster's knowledge and experience are sufficient to develop reliable forecasts. Generally, one of the following processes is used to develop the sales forecast:
• Top-down. A small group of strategic-level managers determine the sales forecast generally with aid from their staff. Often, this approach results in a sales goal being communicated to lower-level managers. In enterprises with highly centralized decision making and well-defined lines of authority, an autocratic approach sometimes results, based on top management's belief in a Theory X level of motivation in employees. While this approach may be adequate in very stable organizations and external environments, it may not be effective in other situations. More importantly, an autocratic process does not assure that employees will accept the budget as legitimate. Consequently, they may not be motivated to attempt to achieve it. Instead, employees may fight the budget, claiming that it places unrealistic demands upon them. Dysfunctional behavior may also result even if top management uses a consultative approach to budgeting. In this approach, top management consults with operations personnel, but the final forecast and budgets are set at the top without formal employee agreement.
• Bottom-up. The key feature of this approach is that multiple levels of managers and salespersons are involved in the forecasting process. As an example, many companies require that individual sales representatives estimate sales for their sales areas. These estimates are then combined to obtain a total sales figure. In contrast to the autocratic and consultative approaches, this approach relies on participative budgeting. Often, many iterations of sales forecasts, operating budgets, and pro forma statements are conducted before the final agreement of operations personnel is obtained. This approach is based on a Theory Y belief in motivation. Operating personnel are motivated to prepare realistic budgets and accept them as valid benchmarks for performance evaluation. There is also some evidence that line management and shop floor personnel will set and achieve more ideal standards than top management would set. The bottom-up approach is particularly effective in unstable external environments requiring decentralized operations.
THE STATISTICAL METHOD. In contrast to the estimate method, the statistical method uses objective data, such as financial, operating, and economic data, as a basis for forecasts. Historical, financial and operating data are generated by management accountants and stored on computer databases. Economic data are obtained from government publications, trade journals, consultants, and various research companies. External data, such as housing starts, regulatory effects, automobile production, weather forecasts, oil prices, projected interest rates, projected inflation rate, and projected GNP are also used. Both the internal and external data are fed into various sophisticated statistical and econometric models to generate sales forecasts.
Then, the forecasts are presented to the budget committee for approval. Three versions may be considered:
• Best case
• Worst case
• Most likely case
A best case budget is prepared with the assumption that everything will work out as planned. A worst case budget predicts just the opposite and includes the necessary corrective actions that would be performed if the anticipated problems occur. For example, management may establish a line-of-credit just in case additional funds are needed. A most likely case budget includes normal disruptions, constraints, and estimation errors.
The budget committee decides which sales forecast is most reasonable and supportive of the strategic plan. In addition, a budget committee may sometimes make specific recommendations for increasing sales, quality improvement, faster delivery, efficient order processing, advertising campaigns, and the like.
Returning to the IMAX case, top management chose a participative budgeting approach to setting the sales forecast. IMAX's sales staff, armed with a simple questionnaire, surveyed their customers to determine how many Highsteppers they planned to buy and how much they would be willing to pay. IMAX's entire budget is based on the sales forecast-the number of Highsteppers that it will sell and the price they will be sold for. Sales forecasting is the main “gear” that drives all the other “budget gears,” and it is the most uncertain part of IMAX's budgeting process. It must be supported by a combination of facts, market surveys, detailed analysis, and assumptions. The data from these surveys were given to IMAX's management accountant, Hal Segiguchi, who entered the data into a spreadsheet program. The program produces the sales budget discussed next.
Step 2: Prepare the Sales Budget
Once a sales forecast is made, a sales budget is, prepared. The sales budget is the expected sales in units and dollars and includes a schedule of cash collections from sales. It serves as a basis for preparing the other budgets. Clearly, the sales level affects the production and purchasing levels, the operating expense levels, as well as cash flow.
The sales budget should be supportive of the strategic plan. For example, management must be careful about deviating from long-term pricing strategies to meet short-term sales projections.
Hal Segiguchi used one of the Highsteppers to run the spreadsheet program, which generated different results based on several sets of assumptions about pricing and promotion. The spreadsheet program includes an “add-in” program for statistical forecasting and sensitivity analysis. The results were sent to the budget committee for review. The forecast and pricing they selected were returned to Hal, who prepared the sales budget. To keep the procedures and calculations to a manageable level, only the budgets for the second quarter of 2014 are presented in the exhibits that follow.
Exhibit 17-3 presents the sales forecast, which is based on a stable sales price of $2,000 per computer. The sales staff, based on their survey results, believe 20 percent of IMAX's customers will pay in cash. Cash sales for each month in the second quarter of 2005 comprise the first set of four “sources of cash from sales” included in the Collections of Sales schedule.
|
Exhibit 17-3 IMAX's Sales Budget |
|||||||
|
Sales Forecast: |
Feb. |
March |
April |
May |
June |
July |
Aug. |
|
Sales (units) x sales price |
350 $2,000 |
250 $2,000 |
00 $2,000 |
230 $2,000 |
270 $2,000 |
300 $2,000 |
220 $2,000 |
|
Sales revenues |
$700,000 |
$500,000 |
$400,000 |
$460,000 |
$540,000 |
$600,000 |
$440,000 |
|
COLLECTIONS OF SALES: |
|
|
Amounts Collected |
|
|||
|
Month |
Sales Formula |
|
April |
May |
June |
|
|
|
This month-cash* |
|
|
|
|
|
|
|
|
April |
$400,000 x 20% |
|
$80,000 |
|
|
|
|
|
May |
$460,000 x 20% |
|
|
$92,000 |
|
|
|
|
June |
$540,000 x 20% |
|
|
|
$108,000 |
|
|
|
This month-credit** |
|
|
|
|
|
|
|
|
April |
$400,000 x 80% x 50% x 98% |
156,800 |
|
|
|
||
|
May |
$460,000 x 80% x 50% x 98% |
|
180,320 |
|
|
||
|
June |
$540,000 x 80% x 50% x 98% |
|
|
211,680 |
|
||
|
From last month's credit sales |
|
|
|
|
|
|
|
|
March |
$500,000 x 80% x 35% |
140,000 |
|
||||
|
April |
$400,000 x 80% x 35% |
|
112,000 |
|
|
||
|
May |
$460,000 x 80% x 35% |
|
|
128,800 |
|
||
|
From 2 months ago-credit sales |
|
|
|
|
|
|
|
|
February |
$700,000 x 80% x 14% |
78,400 |
|
||||
|
March |
$500,000 x 80% x 14% |
|
56,000 |
|
|
||
|
April |
$400,000 x 80% x 14% |
|
|
44,800 |
|
||
|
Total cash collected from sales in 2nd quarter: |
|
$455,200 |
$440,320 |
$493,280 |
|
||
|
*Cash sales = 20% of each month's total sales. **Credit sales collection pattern = 50% collected in month of sale (less 2% discount), 35% in next month, 14% two months after sales, and 1% bad debts. |
|||||||
|
MANUAL CALCULATIONS PROCEDURES: 1. Find information on when sales are collected. (Cash versus Credit Sales, and Credit Collection Pattern) 2. Setup schedule format. (3 columns + 1 column for each month included in the budget period. There will be 1 group of rows for each source of cash. For this example, there are 4 sources of cash deposited into the bank each month. Within each group of rows, there will be 1 row for each month in the budget period.) 3. Write in given information. (In column 1, write down the month that belongs on each row; in column 2, write in the sales for that month; and then, in column 3, write in the multiplication chains [the collection formula].) 4. Turn on your calculator and complete each month's column. (The last three columns in the “Amounts Collected” section.) |
|||||||
The sales staff has two choices for credit sales: extending in-house credit or accepting national credit cards. When in-house credit is offered, a credit collection pattern is used to show how much of a month's credit sales are projected to be collected in that month and in subsequent months. The following pattern is used in Exhibit 17-3:
• Fifty percent of a month's credit sales will be collected within that month.
• Thirty-five percent of a month's credit sales will be collected in the subsequent month (a “one-month lag”).
• Fourteen percent of a month's credit sales will be collected two months in the future (a two-month lag on collections).
• One percent of a month's credit sales are projected to be uncollectible.
• To collect credit sales within the month of sale, IMAX will have to offer a 2 percent credit sales discount. This can be justified by the cost savings from not having to send out monthly statements to credit customers paying from the invoices.
The sales manager and staff decided against accepting national credit cards because they would charge a 3 percent fee, maintaining the separate bank accounts required by each card would involve extra costs, and IMAX could be backtracked for sales rejected by the credit card companies. The credit card companies' experience in backcharges is greater than the 1 percent of in-house credit sales projected to be uncollectible.
Exhibit 17-3's schedule for Collections of Sales includes four sources of cash deposits into IMAX's bank account within any given month. The first section of the exhibit includes the cash sales for that month. The second section represents deposits from credit sales made during the month. The third section, and the third type of cash deposits made in a month, comes from collections of credit sales made in the previous month. The fourth section includes deposits from collections of credit sales made two months ago.
The “Formula” column of the schedule shows the multiplication chains that represent the credit collection pattern_ The first set of percentages (20 and 80 percent) are the portion of a month's sales that are cash versus credit. The second set of percentages (50, 35, and 14 percent, respectively) are the percentages of a month's credit sales collected in subsequent months. The third set of percentages in the chain represents the net amounts collected within the month of sale adjusted for the 2 percent credit sales discount8. Procedures for setting up this section of the sales budget manually, and verifying the amounts, are presented at the bottom of Exhibit 17-3.
Step 3: Develop the Production Budget
The production budget presents the production quota for the budget period, adjusted for planned changes in finished goods inventory levels. The production budget is used in conjunction with raw materials inventory plans to prepare the direct materials purchases budget. It is also used to prepare the direct labor budget and manufacturing overhead budgets.
Although the sales budget is usually developed before the production budget, there should be continuous communication between production and marketing to ensure that production requirements are somewhat uniform throughout the year and capacity is not exceeded. With a stable production policy, manufacturing resources will be better utilized. Moreover, careful planning of production, inventory levels, labor needs, and other resource requirements can result in significant savings.
Exhibit 17-4 presents IMAX's production budget. According to this budget, sufficient units have to be available to meet sales needs and provide for the desired ending inventory. Because of the production cycle time for the Highstepper Pentium and inherent uncertainty in daily sales, three days of FGI is desired. Consequently, each month's beginning FGI should be 10 percent (3 of 30 days in a month) of the month's projected sales. This is equivalent to having a desired ending FGI equal to 10 percent of next month's sales forecast.
|
Exhibit 17-4 IMAX's Production Budgeta |
||||
|
|
April |
May |
June |
July |
|
Sales (in units) |
200 |
230 |
270 |
300 |
|
Plus desired ending FGI |
23 |
27 |
30 |
|
|
Units needed |
223 |
257 |
300 |
|
|
Less beginning FGI |
<20> |
<23> |
<27> |
|
|
Production quota |
203 |
234 |
273 |
|
|
aNote: Ending FGI = 10% of next month's sales forecast. |
Step 4: Prepare the Direct Materials Purchases Budget
The direct materials purchases budget presents the expected usage of direct materials in production and facilitates planning of purchases. It also assists managers in reducing ordering and carrying costs, whether the inventory management approach is economic order quantity (EOQ) and safety stock, material requirements planning (MRP), or just-in-time (JIT).
A direct material's required quantity is a function of its standard quantity and the production quota. The engineering staff and production personnel, through developing a bill of materials and standard cost card, know how many direct materials (the standard quantity) are required to produce a finished computer. The direct materials standard price is normally estimated by the purchasing manager. In addition, the purchasing manager plans direct material inventory levels, purchases, and the cost of these purchases.
Sufficient direct materials must be available to meet production needs and provide the desired ending direct materials inventory for each month in the budget period. Thus, part of the direct materials requirement will normally exist in the form of beginning direct materials inventory. The remainder will be purchased from suppliers. A 10-day supply of PC boards is needed for production of the Highstepper Pentium (a 10-day supply is one-third of a month). Since IMAX is unable to negotiate JIT deliveries, one-third of the projected PC boards needed in a month should be in that month's beginning direct materials inventory. Or, equivalently, a month's ending direct materials inventory should be one-third of the next month's projected PC boards needed.
The direct materials purchases budget is normally accompanied by a computation of expected cash disbursements for direct materials purchases. This schedule is necessary for developing the cash budget. Disbursements for direct materials consist of payments for some of the prior month's purchases and some of the current month's purchases. PC board shipments are received every 10 days, and 2/3 of a month's purchases are paid within that month, and the last one-third of the month's purchases are paid in the next month9. The direct materials purchases budget for PC boards is illustrated in Exhibit 17-5,
|
Exhibit 17-5 IMAX's Direct Materials Purchases Budget for PC Boards |
||||||
|
|
|
March |
April |
May |
June |
July |
|
Production quota X standard quantity of PC boards |
|
245 5 |
203 5 |
234 5 |
273 5 |
292 5 |
|
PC boards needed for current production |
|
1,225 |
1,015 |
1,170 |
1,365 |
1,460 |
|
Plus ending inventory |
1/3 |
338 |
390 |
455 |
487 |
|
|
Less beginning inventory |
1/3 |
<408> |
<338> |
<390> |
<455> |
|
|
PC boards to purchase |
|
1,155 |
1,067 |
1,235 |
1,397 |
|
|
X standard price |
|
$100 |
$100 |
$100 |
$100 |
|
|
Total purchase cost |
|
$115,500 |
$106,700 |
$123,500 |
$139,700 |
|
|
Accounts Payable Payment Schedule: |
|
|
|
|
||
|
To pay this month |
2/3 |
|
$71,133 |
$82,333 |
$93,133 |
|
|
Owed from last month |
1/3 |
|
38,500 |
35,567 |
41,167 |
$46,567 |
|
Cash outflow for accounts payable payments |
|
$109,633 |
$117,900 |
$134,300 |
|
|
|
Notes: I. The production quotas for March and July were based on sales from Exhibit 17-3. 2. Ending PC boards inventory = one-third of next month's needs. 3. Supplier payment terms require payment of two-thirds of a month's purchases within the month in order to obtain the purchase discount included in the standard price. |
||||||
which includes only the budget for PC boards. Each direct material included on the standard cost card has its own purchases and payments budget. Obviously, the use of a computer program is advantageous. This program can be part of the MRP II program in the production LAN or a component of the standard cost program in the management accounting LAN; alternatively, it can reside in a centralized database in an ICBIS, accessed by each LAN as needed. The standard cost card is presented in Exhibit 17-10.
Step 5: Prepare the Direct Labor Budget
The production quota is also used as a basis for the direct labor budget. This budget contains the direct labor hours to schedule each month, the direct labor cost, and a schedule of cash flows for the payment of labor-related costs.
The method used to convert production quota to direct labor hours varies from one company to another. Some companies have comprehensive standard cost records and sufficient experience to estimate standard direct labor hours fairly accurately. On the other hand, if the product is new, an industrial engineer may set up time and motion studies and learning curve analyses to develop reliable labor standard quantities.
After meeting with the cell workers, IMAX's industrial engineer determined that 20 direct labor hours will be required to complete one Highstepper Pentium. The standard direct labor rate includes the wage rates budgeted and the projected payroll taxes and fringe benefits. Standard labor hours are based on practical standards, with allowances for inspection time within each task10. The resulting direct labor budget is shown in Exhibit 17-6.
Step 6: Prepare the Manufacturing Overhead Budget
The manufacturing overhead budget contains the expected cost of all indirect manufacturing elements necessary to meet the production budget. The manufacturing overhead budget summarizes the overhead costs of all the different responsibility centers. Like different direct materials, each responsibility center should have a separate overhead budget. Therefore, overhead cost equations are needed for each overhead resource, activity, service center, and production department. As all overhead flows into the production department’s overhead accounts and predetermined overhead rates (PORs) within the production budgeting process, the PORs include all the different indirect and support activities. This allows the management accountant to prepare a summary budget for all overhead costs using the departmental PORs. To further simplify the concept, assume IMAX uses just one plantwide variable overhead (VOH) POR and fixed overhead (FOH) POR.
|
Exhibit 17-6 IMAX's Direct Labor Budget |
||||||
|
|
|
March |
April |
May |
June |
July |
|
Production quota |
|
245 |
203 |
234 |
273 |
|
|
x standard quantity |
|
20 |
20 |
20 |
20 |
|
|
Direct labor hours to schedule |
|
4,900 |
4,060 |
4,680 |
5,460 |
|
|
X standard price |
|
$15 |
$15 |
$15 |
$15 |
|
|
Total direct labor cost |
|
$73,500 |
$60,900 |
$70,200 |
$81,900 |
|
|
Wages Payable Payment Schedule: |
|
|
|
|
|
|
|
To pay this month |
75% |
|
$45,675 |
$52,650 |
$61,425 |
|
|
Owed from last month |
25% |
|
18,375 |
15,225 |
17,550 |
$20,475 |
|
Cash outflow for wages payable payments |
|
|
$64,050 |
$67,875 |
$78,975 |
|
|
Note: Workers are paid weekly so the last week's labor cost is paid in the first week of the next month. |
||||||
Exhibit 17-7 presents the summary overhead budget for IMAX. The VOH POR of $10 per direct labor hour captures all the VOH items within the factory. The budgeted fixed overhead of $40,000 per month includes $25,000 per month in building and equipment depreciation. Note that this is subtracted from the budgeted overhead because it is not a cash cost. Also note that in the Payment Schedule, all overhead costs are paid on a one-month lag. In other words, all overhead costs incurred in a month are paid in the next month.
A word of caution is in order. Many fixed overhead costs are not incurred uniformly throughout the year. For example, property taxes and insurance may only be paid semi-annually or annually. In these situations, the fixed overhead costs should be budgeted in amounts representative of when actual payments are expected to be made. This further highlights the necessity of having separate budgets for individual overhead activities. The IMAX illustration in Exhibit 17-7 is oversimplified.
|
Exhibit 17-7 IMAX's Manufacturing Overhead Budget |
|||||
|
|
|
|
|
|
|
|
|
March |
April |
May |
June |
July
|
|
Production quota |
245 |
203 |
234 |
273 |
|
|
X direct labor standard quantity |
20 |
20 |
20 |
20 |
|
|
Direct labor hours to schedule |
4,900 |
4,060 |
4,680 |
5,460 |
|
|
X VOH POR |
$10 |
$10 |
$10 |
$10 |
|
|
Total VOH cost |
$49,000 |
$40,600 |
$46,800 |
$54,600 |
|
|
Total FOH cost |
40,000 |
40,000 |
40,000 |
40,000 |
|
|
Less noncash FOH items: Depreciation |
<25,000> |
<25,000> |
<25,000> |
<25,000> |
|
|
Total cash-related FOH costs |
$15,000 |
$15,000 |
$15,000 |
$15,000 |
|
|
Total budgeted cash overhead |
$64,000 |
$55,600 |
$61,800 |
$69,600 |
|
|
|
|
|
|
|
|
|
Manufacturing Overhead Payment Schedule: |
|
|
|
|
|
|
To pay this month |
0%, |
$ -0- |
$ -0- |
$ -0- |
|
|
Owed from last month |
100% |
64,000 |
55,600 |
61,800 |
$69,600 |
|
Cash outflow for overhead payments |
|
$64,000 |
$55,600 |
$61,800 |
|
|
Notes: 1. Noncash items are subtracted from FOH because only cash-paid costs should appear on the cash budget. 2. All overhead costs arc paid on a one-month lag. |
|||||
Step 7: Prepare the Selling and Administrative Expenses Budget
The selling and administrative expenses budget includes planned expenditures for nonmanufacturing activities. Like the costs in the manufacturing over-head budget, selling and administrative expenses can be divided into variable and fixed components.
To develop this budget, IMAX managers in charge of marketing and administration analyzed the amount of resources they needed to meet the sales budget. The results of this analysis are presented in Exhibit 17-8. This summary budget uses the same format as the summary overhead budget. Like the overhead budgets, selling and administrative budgets should be individually prepared by each responsibility center manager.
A word of caution is in order when budgeting variable selling and administrative expenses. Some expenses vary with sales revenues, such as the 5 percent sales commission used in the IMAX case, other expenses, though, such as shipping costs, vary with sales volume. Consequently, the budget may contain two variable selling expense lines. Consistent with activity-based costing, some administrative expenses may vary with the activities performed. For example, some order processing and accounts receivable costs will vary with the number of shipments and/or sales orders processed.
|
Exhibit 17-8 IMAX's Selling and Administrative Expenses Budget |
|
||||
|
|
March |
April |
May |
June |
July |
|
Sales revenues (Exhibit 17-3) |
$500,000 |
$400,000 |
$460,000 |
$540,000 |
|
|
X variable selling expenses |
5% |
5% |
5% |
5% |
|
|
Total variable selling expenses |
25,000 |
20,000 |
23,000 |
27,000 |
|
|
Total fixed selling expenses |
20,000 |
25,000 |
20,000 |
20,000 |
|
|
Total fixed administrative expenses |
130,000 |
120,000 |
125,000 |
150,000 |
|
|
Less noncash expenses: Depreciation |
<5,000> |
<5,000> |
<5,000> |
<5,000> |
|
|
Total cash-related fixed S & A expenses |
$145,000 |
$140,000 |
$140,000 |
$165,000 |
|
|
Total cash S & A expenses budgeted |
$170,000 |
$160,000 |
$163,000 |
$192,000 |
|
|
|
|
|
|
|
|
|
Selling And Administrative Expenses Payment Schedule: |
|
|
|
||
|
To pay this month 0% |
|
$ -0- |
$ -0- |
$ -0- |
|
|
Owed from last month 100% |
|
170,000 |
160,000 |
163,000 |
$192,000 |
|
Cash outflow S & A expenses payments |
$170,000 |
$160,000 |
$163,000 |
|
|
|
Notes: 1. Noncash items are subtracted from fixed administrative expenses because only cash-paid costs should appear on the cash budget. 2. All selling and administrative expenses are paid on a one-month lag. |
|||||
Step 8: Prepare Budgeted Financial Statements
The foregoing budgets produce the necessary data to prepare IMAX's pro forma (budgeted) financial statements. These statements include the following:
• The cash budget discloses the expected cash inflows and outflows for the budget period. The cash budget is interrelated to all the other budgets and is the starting point for the preparation of the pro formas.
• The sales budget, standard cost card, and selling and administrative expenses budget provide the data necessary to prepare the pro forma income statement. Additional data on other income, other expenses, and income taxes are also gathered from other sources and included.
• The pro forma balance sheet shows the projected financial position of the enterprise at the end of the budget period. Many of the amounts needed are created in the process of preparing the operating budgets. As these amounts are identified, they can be “posted” to the pro forma balance sheet. Detailed instructions for preparing the pro formas are presented next.
THE CASH BUDGET. Exhibit 17-9 presents IMAX's cash budget for the second quarter, 2005. It pulls together much of the data generated in the preceding steps. Hal Segiguchi's spreadsheet program copied the monthly totals from the operating budgets into this report. He then input into the Data Section of the program amounts for nonoperational cash flows obtained from general ledger personnel and the Finance Department.
Prior to Hal's new spreadsheet program and Highstepper Pentium, he had to prepare the budgets manually. Obviously, this was a time-consuming and complex process. Hal followed these steps in manually preparing IMAX's budgets:
Step 1. Get a big table. In the middle of the table, Hal placed a sheet of four-column accounting working paper for the cash budget. On each side of this paper, Hal placed a sheet of working paper for the pro forma income statement and balance sheet. His strategy was to develop the operating budgets as needed to provide the amounts for the cash budget. As soon as amounts needed for the income statement and balance sheet were created on an operating budget, they were “posted” to the pro formas. In this way, the cash budget served as the focal point for his manual process. Additionally, this process allowed Hal to prepare the pro formas simultaneously with the operating budgets.
Step 2. Begin the cash budget. Hal then began with the cash budget's first entry. If this entry needed a supporting schedule, he would prepare it, post the amounts to the cash budget and pro formas, and then place the schedule next to the pro formas on the table. Hal set up the cash budget format by dividing it into three sections:
• The “Cash from operations” section reports on the cash flows from operations for each month in the budget horizon. IMAX's management used the Cash from Operations subtotal as a measure of cash “profitability” resulting from the production and sales of the Highstepper Pentium. This subtotal answers the question, “Do each month's operations generate a positive cash flow?”
The second section lists nonoperational sources and uses of cash. The subtotal “Monthly Cash Flow” is used by IMAX management as a measure of the month's cash profitability. This subtotal answers the question, “Does the month as a whole generate a positive cash flow?” Hal obtained the information for this section from the capital budget and general ledger personnel in the Accounting Department. Sources are positive amounts as they will be deposited into IMAX's bank account. Uses are payments and, thus, are shown as negative amounts.
|
Exhibit 17-9 IMAX's Cash Budget for the Second Quarter |
||||
|
|
CASH BUDGET SECOND QUARTER, 2005 |
|
|
|
|
|
April |
May |
June |
Totals |
|
OPERATIONAL CASH INFLOWS: From product sales (Exhibit 17-3) |
$455,200 |
$440,320 |
$493,280 |
$1,388,800 |
|
OPERATIONAL CASH OUTFLOWS: Direct materials (Exhibit 17-5) |
$109,633 |
$117,900 |
$134,300 |
361,833 |
|
Direct labor (Exhibit 17-6) |
64,050 |
67,875 |
78,975 |
210,900 |
|
Manufacturing overhead (Exhibit 17-7) |
64,000 |
55,600 |
61,800 |
181,400 |
|
Selling & Admin. expenses (Exhibit 17-8) |
170,000 |
160,000 |
163,000 |
493,000 |
|
Income taxes (Exhibit 17-11) |
<450> |
3,844 |
4,536 |
7,930 |
|
TOTAL OPERATIONAL CASH OUTFLOWS |
<$407,233> |
<$405,219> |
<$442,611> |
<$1,255,063> |
|
CASH FROM OPERATIONS |
$47,967 |
$35,101 |
$50,669 |
$133,737 |
|
|
|
|
|
|
|
NONOPERATIONAL SOURCES & USES: Notes receivable collections |
7,000 |
-0- |
7,000 |
14,000 |
|
Equipment purchases |
<5,000> |
<10,000> |
<10,000> |
<25,000> |
|
Notes payable payments |
<40,000> |
<40,000> |
<40,000> |
<120,000> |
|
TOTAL NONOPERATIONAL CASH FLOWS |
<$38,000> |
<$50,000> |
<$43,000> |
<$131,000> |
|
MONTHLY CASH FLOW |
$9,967 |
<$14,899> |
$7,669 |
$2,737 |
|
Beginning cash balance |
20,000 |
24,917 |
20,000 |
20,000 |
|
CASH SURPLUS/<DEFICIT> |
$29,967 |
$10,018 |
$27,669 |
$22,737 |
|
FINANCING Beginning line-of-credit balance |
$5,000 |
$-0- |
$9,982 |
$5,000 |
|
Interest |
<50> |
-0- |
<100> |
<150> |
|
Borrowings |
-0- |
9,982 |
-0- |
9,982 |
|
Repayments |
<5,000> |
-0- |
<7,569> |
<12,569> |
|
Ending line-of-credit balance |
-0- |
9,982 |
2,413 |
2,413 |
|
ENDING CASH BALANCE |
$24,917 |
$20,000 |
$20,000 |
$20,000 |
• The last section “Financing” addresses the need for short-term financing. In some months, all businesses have surplus cash left over. In other months, there may not be sufficient deposits to cover the anticipated payments. In these months, a company needs a line-of-credit with its bank. A line-of-credit is analogous to an individual having overdraft protection. The bank temporarily deposits funds into IMAX's account to cover a projected deficit. This is a short-term, usually unsecured, loan. When a surplus balance is projected, the bank withdraws the surplus to pay the interest on the loan and then to pay off the principal balance. In this way, IMAX's bank is a stakeholder in the company. IMAX's bank requires that a cash budget, with a financing section, be updated quarterly and provided to the bank as a condition of maintaining the line-of-credit.
The Financing section really begins with the calculation of the monthly bank account balance (the “Cash Surplus/(Deficit)” subtotal). This is the sum of the Monthly Cash Flow subtotal plus the beginning cash balance for that month. On April 1, IMAX projects a $20,000 beginning cash balance, which is its minimum required balance according to the line-of-credit agreement with the bank. Whenever IMAX projects a balance less than $20,000, the bank will deposit enough money to bring the balance up to this amount. Whenever IMAX projects an ending balance greater than $20,000, the bank will use the surplus to repay the line-of-credit balance.
On April 1, IMAX expects to owe a $5,000 balance on its line-of-credit. For April, the bank will charge 1 percent simple interest and deduct this amount ($50) from the hank account. Therefore, the monthly interest charge is shown as a negative amount in the cash budget because it will be withdrawn from IMAX's bank account. In April, IMAX projects an ending bank account balance of $29,967 before line-of-credit financing (i.e., the “Cash Surplus/ <Deficit>”). It is in a position to pay back the entire balance on its line-of-credit. First, $50 will be deducted from the bank account for interest expense, then $5,000 for principal. This leaves a projected ending line-of-credit balance of zero and an ending bank account balance of $24,917.
The ending cash balance for April becomes the beginning cash balance for May. Once this is known, Hal can calculate May's cash surplus or deficit and determine whether any line-of-credit financing is needed. Because May's cash surplus is only projected to be $10,018, IMAX will need to borrow $9,982 on its line-of-credit so it can maintain its minimum required cash balance of $20,000.
In June, IMAX projects a cash surplus of $27,669. The bank will first use $100 of the surplus to pay one month's interest and then use the balance ($7,569) to partially repay the line-of-credit principal. At the end of June, IMAX will still owe $2,413 on its line-of-credit.
Considering the second quarter in total, IMAX operations will generate a positive cash flow of $133,737. Including nonoperational cash flows, the second quarter as a whole will generate a positive cash flow of only $2,737, however. The $2,737 will be used to pay $150 in line-of-credit interest and $2,587 of the beginning line-of-credit balance.
To prepare the “Totals” column in the cash budget, most lines can simply be added across. The beginning cash balance line should not be added across into the Totals column, though. The Totals column represents the entire second quarter-April 1, 201x, through June 30, 201x. Consequently, the beginning cash balance should be the beginning balance on April 1; that is, the $20,000. The cash surplus or deficit in the Totals column is then the sum of the quarter's cash flow plus the April 1st beginning balance.
Similarly, the beginning line-of-credit balance on April 1 is the beginning balance in the Totals column. The ending line-of-credit balance in the June column (the June 30th balance) becomes the ending balance for the quarter (which also ends on June 30th). The ending June cash balance is the ending cash balance for the second quarter. The cash surplus minus interest, plus borrowings, and minus repayments should sum to the ending cash balance for each month and for the quarter in the Totals column.
Step 3. Prepare supporting schedules and operating budgets as needed. The first line of the cash budget is cash deposits from the sales of Highstepper Pentiums. This information comes from Exhibit 17-3. Each line in the first section of the cash budget requires a supporting schedule (operating budget). As each operating budget is prepared, amounts needed for the pro formas are posted to them, as discussed in the next step.
Step 4. Complete the cash budget and pro formas. After individual amounts are posted to the cash budget, income statement, and balance sheet, the income statement is completed. The income tax liability is posted to the cash budget, and it is completed as described in step 2 above. Finally, the balance sheet is completed. Specific steps in posting amounts to the pro formas are discussed next.
THE PRO FORMA INCOME STATEMENT. Prior to completing the income statement, Hal Segiguchi obtained the standard cost card for the Highstepper Pentium from the MRP II LAN. It is presented in Exhibit 17-10. The pro forma income statement is shown in Exhibit 17-11. The sales budget (Exhibit 17-3) and the standard cost card (Exhibit 17-10) provide the information to project Gross Profit for each month11. Exhibit 17-8 provides the information on selling and administrative expenses. Note that the expenses are used and not the cash totals for each month. Expenses include depreciation even though it is not included in the cash outflows for the cash budget. Income taxes are projected to be 20 percent of pre-tax operating income less line-of-credit interest.
|
Data Section: Standard Costs |
|
|
|
|
Manufacturing inputs |
Price |
Output Quantity |
Loss % |
|
PC Boards |
$100.00 |
5.00 |
0.00% |
|
Direct Labour |
$15.00 |
16.00 |
20.00% |
|
Variable Overhead |
$10.00/DLH |
|
|
|
Fixed overhead |
$7.50/DLH |
|
|
|
Normal production volume (in units) |
3200 |
|
|
|
|
|
|
|
|
Solution section: Standard Cost Card and Manufacturing cost equation |
|||
|
IMAX Computers Highstepper Pentium Standard Cost Card |
|
|
|
|
Manufacturing inputs |
Standard Prices |
Standard Quantities |
Standard Costs |
|
PC Boards |
$100.00 |
5 boards/computer |
$500/computer |
|
Direct Labour |
$15.00 |
20 DLH/computer |
$300/computer |
|
Variable Overhead |
$10.00/DLH |
20 DLH/computer |
$200/computer |
|
Fixed overhead |
$7.50/DLH |
20 DLH/computer |
$150/computer |
|
|
Standard Absorptive Manufacturing Cost |
$1,150/computer |
|
|
Monthly production cost = |
$40,000/month + $1,000/computer |
|
|
|
Note: the 20DLH standard quantity is 16 DLH / (1-20%). The $1,000/computer is the sum of the variable standard costs. Refer to Chapter 7. |
|||
THE PRO FORMA BALANCE SHEET. The pro forma balance sheet is presented in Exhibit 17-12. Most of the amounts are posted to it as the operating budgets are prepared. Some amounts require special calculations not reflected on the operating budgets. For example, the accounts receivable balance can be computed upon completion of the sales budget, as shown in note 1 to the balance sheet. The current portion of the notes receivable represents three more bimonthly collections in 2005 (in August, October, and December according to the cash budget).
|
IMAX COMPUTERS Pro Forma Income Statement Second Quarter, 2005 |
||||
|
|
April |
May |
June |
Totals |
|
Sales revenues (Exhibit 17-3) |
$460,000 |
$400,000 |
$540,000 |
$1,400,000 |
|
Less sales discounts |
<3,200> |
<3,680> |
<4,320> |
<11,200> |
|
Less bad debts |
<4,000> |
<4,600> |
<5,400> |
<14,000> |
|
Net sales |
$392,800 |
$451,720 |
$530,280 |
$1,374,800 |
|
Less cost of goods sold (Exhibit 17-10) |
<230,000> |
<264,500> |
<310,500> |
<805,000> |
|
Gross profit |
$162,800 |
$187,220 |
$219,780 |
$569,800 |
|
Less selling and administrative expenses (Exhibit 17-8): |
|
|
|
|
|
Variable selling expenses |
20,000 |
23,000 |
27,000 |
70,000 |
|
Fixed selling expenses |
25,000 |
20,000 |
20,000 |
65,000 |
|
Fixed administrative expenses |
120,000 |
125,000 |
150,000 |
395,000 |
|
Total selling & admin. expenses |
<165,000> |
<168,000> |
<197,000> |
<$530,000> |
|
Net pre-tax operating income |
<$2,200> |
$19,220 |
$22,780 |
$39,800 |
|
Less line-of-credit interest (Exhibit 17-9) |
<50> |
-0- |
<100> |
<150> |
|
Less income taxes -20% |
450 |
<3,844> |
<4,536> |
<7,930> |
|
Net operating income |
<$1,800> |
$15,376 |
$18,144 |
$31,720 |
|
Note: COGS is calculated by multiplying the standard absorptive manufacturing cost by the monthly sales forecast. |
||||
The beginning property, plant, and equipment account balance ($2,500,000) comes from the projected March 30th balance, as does the accumulated depreciation balance ($450,000). The current liability balances come directly from the operating budgets referenced in the “Exhibit” column. As Hal Segiguchi calculated each amount, he noted his calculations below the balance sheet. Based on his past experiences with the budget committee, he knew he would need to explain where these amounts came from. The notes provide him with the necessary “audit trail.”
Master Budgeting Differences in Nonmanufacturing Enterprises
The foregoing budgeting steps can also be used in preparing the operating budget in merchandising and service firms. The operating budgets are much simpler in nonmanufacturing enterprises because these firms do not make products.
In a merchandising organization, a merchandise purchases budget replaces the production budget and its associated direct materials, direct labor, and manufacturing overhead budgets as illustrated in Exhibit 17-2. A merchandise purchases budget is a statement showing the cost of merchandise to be purchased to meet estimated sales and ending merchandise inventory needs. A typical budget is illustrated in Exhibit 17-13.
Note the similarities between this budget and the direct materials budget in Exhibit 17-5. The only difference is that instead of calculating the number of computers to manufacture as the basis for direct material purchases, in this budget, sales revenues are used to project merchandise purchases. Assume that IMAX purchases Highstepper Pentiums and Cost of Goods Sold equals 60 percent of sales revenues12. Sales revenues are calculated using retail sales prices. Merchandise is purchased at cost, however, not at retail sales price. Thus, revenues first have to be converted into their corresponding cost of the computers sold.
|
Exhibit 17-12 IMAX's Pro Forma Balance Sheet |
|||
|
IMAX COMPUTERS Pro Forma Balance Sheet June 30, 2005 |
|
|
|
|
Assets: |
Exhibit |
Balance |
Totals |
|
Current: Cash |
17-9 |
$20,000 |
|
|
Accounts receivable |
note 1 |
263,200 |
|
|
Notes receivable |
note 2 |
21,000 |
|
|
Raw materials inventory |
17-5 |
48,700 |
|
|
Work-in-process inventory |
none |
-0- |
|
|
Finished goods inventory |
17-4 |
34,500 |
$387,400 |
|
Noncurrent: Notes receivable |
note 3 |
$84,000 |
|
|
Property, plant, & equipment |
note 4 |
2,525,000 |
|
|
Less accumulated depreciation |
note 4 |
<540,000> |
2,069,000 |
|
Total Assets |
|
|
$2,456,400 |
|
|
|
|
|
|
Liabilities: |
|
|
|
|
Current: Accounts payable |
17-5 |
$46,567 |
|
|
Wages payable |
17-6 |
20,475 |
|
|
Overhead payable |
17-7 |
69,600 |
|
|
Selling & Admin. expenses payable |
17-8 |
192,000 |
|
|
Line-of-credit payable |
17-9 |
2,413 |
|
|
Notes payable |
note 5 |
240,000 |
$571,055 |
|
Noncurrent: Notes payable |
note 6 |
|
1,600,000 |
|
Total Liabilities |
|
|
$2,171,055 |
|
Owners' Equity: |
|
|
|
|
Beginning balance |
note 7 |
$253,625 |
|
|
Plus second quarter net income |
17-11 |
31,720 |
285,345 |
|
Total Liabilities And Owners' Equity |
|
$2,456,400 |
|
|
Notes: 1. Accounts receivable (Exhibit 17-3): May revenues x 80% x 14%; June revenues x 80% x (35% + 14%). 2. Notes receivable-current (Exhibit 17-9): $7,000 is collected every other month. 3. Notes receivable-long run: two years remaining after 2005 at $7,000 every other month. 4. Property, plant & equipment: purchased $25,000 (Exhibit 17-9); depreciation of $75,000 (Exhibit 17-7 FOH) plus $15,000 (Exhibit 17-8 S & A Expenses). 5. Notes payable-current: $40,000 per month from Exhibit 17-9. 6. Notes payable-long term: 40 months remaining after 2005 at $40,000 per month (Exhibit 17-9). 7. Owners' equity: there is no drawing account as owners are paid salaries included in S & A expenses. |
|||
|
Exhibit 17-13 IMAX'S Merchandise Purchases Budget |
||||||
|
Item: |
Formula: |
March |
April |
May |
June |
July |
|
Sales |
|
$500,000 |
$400,000 |
$460,000 |
$540,000 |
$600,000 |
|
COGS |
60.00% |
$300,000 |
$240,000 |
$276,000 |
$324,000 |
$360,000 |
|
+Ending inventory(10-day supply) |
113 |
80,000 |
92,000 |
108,000 |
120,000 |
|
|
<Beginning inventory> |
113 |
<100,000> |
<80,000> |
<92,000> |
<108,000> |
|
|
Gross Purchases |
|
$280,000 |
$252,000 |
$292,000 |
$336,000 |
|
|
Net Purchases |
98.00% |
$274,400 |
$246,960 |
$286,160 |
$329,280 |
|
|
Accounts Payable Payment Schedule: |
|
|
|
|
|
|
|
To pay this month (1st two monthly shipments) |
2/3 |
|
$164,640 |
$190,773 |
$219,520 |
|
|
Owed from last month |
1/3 |
|
91,467 |
82,320 |
95,387 |
$109,760 |
|
Cash outflow for accounts payable payments |
|
$256,107 |
$273,093 |
$314,907 |
|
|
|
Manual Calculations Procedures: |
|
|
|
|
|
|
|
1. Write down sales revenues. (Double underline so revenues are not added into gross purchases totals.) 2. Convert revenues into cost of goods sold. (Sales are purchased at cost, not at retail sales prices. Use COGS ratio.) 3. Calculate beginning and ending FGI requirements. (Use COGS, not revenues, in calculating beginning and ending FGL) 4. Adjust gross purchases to net purchases. (Always take purchase discounts.) 5. “Flow out” net purchases into the months they are really paid. (Just as was done in Exhibit 17-5 for direct materials purchases.) |
||||||
The beginning and ending merchandise inventories also have to be calculated at cost, using projected COGS in the second line of the budget.
The 10-day ending merchandise inventory requirement represents one-third of the next month's COGS (sales at cost), using a 30-day month. The 10-day requirement is due to IMAX only being able to receive shipments every 10 days. Purchase discount terms of 2% 10, N3013 mean that the first two shipments received in a month (two-thirds of the month's purchases) will have to be paid for within that month if the purchase discount is to be taken. Therefore, two-thirds of a month's purchases are paid within the month, and one-third can be paid in the first week of the next month (still taking the discount on the third shipment). The five-step procedure at the bottom of the exhibit explains how to verify these amounts manually.
An operating budget for a service firm is prepared in the same manner as for a merchandising firm, except it does not include a purchases budget for merchandise inventory. But a purchases budget for supplies is often prepared in the same format as the merchandise purchases budget. Both in merchandising and service enterprises, a “direct labor” budget is usually prepared for sales personnel (merchandising) or for those providing professional services directly to customers (e.g., lawyers' time, engineers' time, CPAs' time, and so forth).
MASTER BUDGETING AND RESPONSIBILITY ACCOUNTING
The management accountant serves two responsibility accounting roles in the strategic planning and master budgeting process. First is the functional role discussed earlier. The management accountant serves as a facilitator and coordinator in the budgeting process. Especially in the absence of ICBISs, purchasing needs to know what production is planning. Production obviously needs to know what sales and marketing personnel are planning. Conversely, sales and marketing need to know whether production bottlenecks will be created and whether supplies and materials will be available when needed.
Hal Segiguchi, within his functional role, also serves as an auditor, making sure the process runs effectively and efficiently, producing the desired results. Historically, he was also the “number cruncher,” actually preparing the budgets when they were done manually. Now he uses his spreadsheet program and the new Highstepper Pentium.
The operating budgets represent what is planned. Periodic reports also should be produced comparing actual results against the budget to determine how well plans are being met (management-by-exception). Detailed reports should be given to managers who are responsible for the items they have budgeted. These reports often include sales and cost variances. Summary reports are distributed to higher levels of management. These often include summary income statement and balance sheet comparisons against the pro formas14.
Behavioral Role in the Planning Process
In addition to fulfilling the functional role, the management accountant must be aware of the many behavioral implications of the planning process. In this behavioral role, the management accountant needs to “see the big picture”: how the planning, operational control, and performance evaluation processes are linked together to motivate people properly in an enterprise.
During the process of creating the master budget, the management accountant should be aware of a phenomenon called “budgetary slack,” which often occurs when budgets are used for control and performance evaluation. Budgetary slack describes a tendency of managers to underestimate revenues and overestimate expenditures in order to build in allowances for unexpected declines in revenue and/or unforeseen expenses. Some allowances may be desirable, especially in manufacturing firms with long product cycle times. For example, it is not uncommon for construction firms to allow up to a 20 percent allowance for contingencies in the budget for a subdivision or a shopping center.
However, to be on the safe side and make themselves look good as the year progresses, operating managers may further underestimate sales (or production) and overestimate costs. This “padding of the budget” increases the likelihood that the managers will be able to achieve the budget with less effort15.
Allowing budgetary slack creates problems because of the interaction among budget elements. If sales are understated, problems can arise in production and logistics. Budgetary slack can cause an inefficient allocation of scarce resources. It hides waste and decreases the objectivity of performance evaluations.
One approach that top management can use to reduce budgetary slack is to establish a reward system that rewards operating managers who set high revenue and production estimates and low cost estimates (ideal standards) and then achieve them. Another approach is to use zero-based budgeting.
Most importantly, operations management and shop floor personnel need to internalize their budgets. Top management must convey the perception that the operating budgets belong to the managers who create them. This is difficult because the master budgeting process is iterative. Often, once the master budget is prepared, it undergoes a number of revisions before agreement is reached on a final plan. Operations managers need to understand how all the pieces fit together and why changes from the original budgets they submitted may be needed for the enterprise to accomplish its goals and objectives.
Behavioral Role in Operational Control
If operations personnel perceive the process as autocratic, they may regard the master budget as something imposed by top management. Efforts to achieve imposed budgets may result in dysfunctional behaviors. For example, excessive pressure to meet imposed production quotas, while maintaining ideal standards, may cause product quality to decline. This is contrary to IMAX's world-class manufacturing long-range objective.
In daily control of profit center operations, desires of various managers to achieve their individual responsibility center budgets may create conflicts within the profit center. Consider sales and marketing's desire to achieve its sales budget. Price concessions may be made to certain customers for special orders. These rush orders interrupt normal production scheduling and may cause costs to be higher than standard. Production personnel may resist processing these orders if they are held responsible for the resulting production volume variance and various cost variances.
One way to overcome this suboptimizing behavior is to develop a cost variance reporting system that identifies the sources and causes of cost variances by tracing them back to the people really responsible for them. A visual factory and an ICBIS are useful components of a profit and cost management system. If rush orders are a significant component of the sales budget, then this may signal the need for capital budgeting plans to reengineer the plant into a JIT process or a mushroom process that will allow for greater flexibility16.
Behavioral Role in Performance Evaluation
The master budgeting process also creates behavioral implications for performance evaluation. In addition to providing real-time information on variances for daily operations control, budget variance reports must be linked to performance evaluation and rewards. Employees may reject the budget as irrelevant if they are not provided feedback about variances or held accountable for budget deviations. They have to believe that the master budgeting process is important, not only for the firm's survival but also for each individual's survival. The budget, and performance evaluation against it, must also lead to rewards the employees consider valuable.
If the budgeting process is to be effective in motivating goal-congruent actions:
• There must be a strategic plan defining the enterprise's mission, its objectives, and goals for the budget horizon.
• The goals must be linked to objectives in a rational way, and objectives must lead to accomplishing the firm's mission.
• The master budget must be linked to the goals in a manner that operations personnel can understand and accept.
• The operating budgets must be used in performance evaluation.
• Performance evaluation must lead to rewards accepted as valid by those being held responsible for budget achievement.
SUMMARY OF LEARNING OBJECTIVES
The major goals of this chapter were to enable you to achieve five learning objectives:
Learning objective 1. Discuss strategic planning and list its component steps.
Strategic planning is a systematic process for defining the mission, long-run objectives, and short-term goals of an enterprise. The mission statement defines the firm's purpose. Objectives are long-run statements of what the firm wants to accomplish. Goals are short-run translations of objectives, bounded by time and are measurable. Goals become the basis for the master budget. The master budget, in turn, is used to plan operations for the budget period, to monitor and control daily operations, and to evaluate performance. Budgets provide the benchmarks for control and performance evaluation.
Exhibit 17-1 lists six steps in the strategic planning process. In the first three steps, the enterprise's mission, objectives, and goals are defined. Step 4 involves an analysis of the enterprise's environment. The environment is decomposed into internal strengths and weaknesses and external opportunities and threats (SWOT). In step 5, strategies are set to capitalize on strengths and opportunities, and overcome weaknesses and threats. Finally, in step 6, results are compared against budget in a real-time mode for operational control and in formal variance reports for performance evaluation.
Learning objective 2. Define the budgets that make up the master budgeting process.
The master budget is comprised of a capital budget and operating budgets. The capital budget translates into financial terms the plans for property, plant, and equipment acquisitions, market expansion, new product development, and other plans of a long-run nature. The operating budgets focus on short-run operations. The master budgeting process is summarized in Exhibit 17-2.
Operating budgets begin with the sales budget (Exhibit 17-3). This includes the sales forecast in units and revenues and a schedule of cash collections of sales. The sales budget is the basis for the remaining operating budgets. In manufacturing firms, a production budget (Exhibit 17-4) is prepared next detailing the production quota for the budget horizon. This leads to budgets for direct materials purchases, direct labor, and manufacturing overhead (Exhibits 17-5, 6, and 7). In merchandising firms, a merchandise purchases budget (Exhibit 17-13) is prepared instead of the production budgets. The basic purpose of these budgets is to schedule the acquisition and payment for these resources. The last operating budget is the selling and administrative expenses budget (Exhibit 17-8). While preparing the operating budgets, the pro forma statements are also created. The pro forma statements include the cash budget, budgeted income statement, and budgeted balance sheet (Exhibits 17-9, 11, and 12).
Learning objective 3. Prepare the operating budgets for a manufacturing enterprise.
As summarized above, both manufacturing and nonmanufacturing firms prepare a sales budget, selling and administrative expense budget, and the three pro forma statements. A manufacturing firm also prepares operating budgets for production activities. A merchandising firm prepares a merchandise purchases budget. These budgets are illustrated again in this chapter's demonstration problems.
Learning objective 4. Explain how operating budgets are used in merchandising and service firms.
As in manufacturing firms, the sales budget is the focal point for the operating budgets in merchandising and service firms. In merchandising firms, sales create the need for merchandise purchases. Service firms often prepare separate budgets for the supplies needed to provide their services.
Budgeting labor is equally important in manufacturing, merchandising, and service firms. In merchandising firms, “direct labor” can be thought of as the sales and service personnel necessary to satisfy customer needs. In a service firm, direct labor can be thought of as those who actually provide the service to a firm's customers.
All three types of enterprises incur selling and administrative expenses. In service firms, “selling” expenses may be thought of as those expenses directly traceable to individual services and customers.
Learning objective 5. Describe how operating budgets are used to facilitate planning, controlling operations, and evaluating performance.
As was first discussed in Chapters 7 and 8, the management accountant has two roles in responsibility accounting. Within the functional role, the management accountant serves as a facilitator in the master budgeting process. Communication and coordination are important in providing operations personnel with a sense of the “big picture.” This is necessary because the original budgets will have to be revised if they, in aggregate, will not lead to the firm's goals. Coordination is also important in the daily scheduling and control of operations. The management accountant also has a functional responsibility to develop budget variance reports for performance evaluation.
In the behavioral role, the management accountant is involved in assuring that employees are properly motivated to budget, control operations, and evaluate and reward performance. Operations personnel need to participate in, and internalize, their budgets. They must believe that they, not top management, are responsible for preparing and achieving the budget. If operating personnel accept the budget as legitimate, they are likely to be better motivated to coordinate and control operations to achieve it. Finally, if the operating budgets are accepted as legitimate, they should be used as benchmarks for performance evaluation. The motivational linkages end with performance evaluations leading to acceptable rewards.
IMPORTANT TERMS
Budget horizon The time period covered by the master budget. In many firms this is a year, budgeted by month or by quarter.
Budgetary slack Excess costs (or lower sales) purposefully built into a budget to provide protection against unforeseen events. It is often called “padding the budget.”
Capital budget A listing of all approved long-term expenditures for property, plant, and equipment necessary to meet the strategic plan of the enterprise.
Cash budget A period-by-period (monthly or quarterly) statement of expected cash flows from operations, nonoperational activities, and line-of-credit financing.
Continuous budget An evolving, dynamic budget in which a 12-month forecast is always available by adding a month or a quarter in the future and dropping the month or quarter just ended.
Credit collection pattern A listing of the percentage of a month's (or quarter's) sales that will be collected in that month and in subsequent months. These percentages are used to determine the projected cash deposits from the collection of sales within the sales budget.
Direct labor budget A statement used by manufacturing firms that shows the labor hours to budget, labor cost, and when these costs will be paid. It is based on the production quota.
Direct materials purchases budget A statement used by manufacturing firms that shows how much and when direct materials should be purchased, and when they will be paid. It is also based on the production quota.
Line-of-credit This is an overdraft protection agreement between a firm and its bank. Usually, it is an unsecured short-term loan automatically deposited into the firm's bank account to cover checks the firm has written. Repayments also are usually automatically withdrawn by the bank if a surplus cash balance exists at the end of a month.
Manufacturing overhead budget A statement that summarizes all expected manufacturing costs other than direct material and direct labor costs as well as expected cash payments for those costs.
Master budget A series of interrelated budgets that quantify management's expectations about revenues, expenses, cash flow, net income, and financial position. The operating budgets, the capital budget, and the pro forma statements are the three major components of the master budget.
Merchandise purchases budget A statement prepared by merchandising firms that shows the cost of merchandise to be purchased to satisfy estimated sales demand and ending inventory needs. It also shows the scheduled payments for merchandise purchases. A similar budget can be prepared for a service firm's purchases of supplies.
Operating budget A component of the master budget that represents expected results of operations of a manufacturing, merchandising, or service organization. In a manufacturing firm, operating budgets include a production budget, direct materials purchases, direct labor, and overhead expenditures. Merchandising firms prepare a merchandise purchases budget. All types of firms prepare selling and administrative expenses budgets as part of the operating budget.
Production budget A statement specifying the number of units of a product to be manufactured within the budget horizon to meet sales demand and provide the desired ending finished goods inventory.
Pro forma balance sheet An estimate of the enterprise's financial position at the end of the budget period.
Pro forma income statement A statement showing estimated revenues and expenses from income-producing activities for the budget period.
Pro forma statements Budgeted cash flow, income, and balance sheet statements.
Sales budget An estimate of sales in units and dollars expected during the budget period as well as an estimate of cash receipts.
Sales forecast A component of the sales budget that shows how many products or services are planned by period within the budget horizon.
Selling and administrative expenses budget A budget that shows nonmanufacturing expenses planned during a budget period.
Strategic planning The process of defining the mission, objectives, and goals of an enterprise. It also includes an analysis of the firm's internal and external environments, its strategies, and an evaluation of actual results compared against the master budget.
Zero-based budgeting A budgeting process that requires each responsibility center to justify all of its planned activities and budgeted costs, as though the budget were being developed for the first time.
DEMONSTRATION PROBLEMS
DEMONSTRATION PROBLEM 1 Operating budgets for the first quarter of 2005. John Williams, one of the project engineers at IMAX, has suggested that IMAX purchase FAX-modem cards to install in Highstepper Pentiums. He proposes a “spin-off” company that he will run. John wishes to borrow $5,000 from IMAX to set up the company. He can pay back IMAX $250 per month. In support of his suggestion, John has prepared the following information.
DATA SECTION:
|
ITEMS: NOVEMBER |
November |
December |
January |
February |
March |
April |
|
Sales (units) |
25 |
40 |
10 |
20 |
30 |
25 |
|
Sales price |
$100
|
$100 |
$100 |
$100
|
$100 |
$100 |
|
|
|
|
|
|
|
|
|
NOTE: Cash sales: Credit sales collected: |
|
|
40% of total sales for any month 60% in the month of sale; 30% the next month; 8% in the following month; 2% uncollectable. |
|
||
|
Credit sales discount: |
|
|
1% if bills paid within month of sale. |
|
||
|
Merchandise Purchases: Gross profit ratio: |
|
50% |
|
|
|
|
|
Ending finished goods inventory: Purchase discount: |
|
|
50% of next month's sales 2%/15,N30 (assume a 30-day month) |
|
||
|
|
|
|
|
|
|
|
|
Operating Expenses: Selling expenses: Variable |
|
|
2% of gross sales each month |
|
||
|
Selling expenses: Fixed |
|
|
$1,000 |
$1,000 |
$1,000 |
|
|
Administrative expenses |
|
|
200 |
200 |
200 |
|
|
Income taxes |
|
|
100 |
200 |
300 |
|
|
Depreciation included in selling expenses |
|
|
500 |
500 |
500 |
|
|
|
|
|
|
|
|
|
|
Other Cash Flow Items: |
|
|
January |
February |
March |
|
|
Loan from IMAX |
|
|
$5,000 |
|
|
|
|
Equipment purchases |
|
|
|
$5,000 |
|
|
|
Notes payable payments |
|
|
$250 |
$250 |
$250 |
|
|
|
|
|
|
|
|
|
|
Line-of-credit Financing: |
|
|
|
|
|
|
|
Beginning cash balance |
|
|
$ 0 |
|
|
|
|
Minimum cash balance |
|
|
$1,000 |
|
|
|
|
Beginning line-of-credit balance |
|
|
-0- |
|
|
|
|
Line-of-credit interest rate |
|
|
12% per year |
|
|
|
|
|
|
|
|
|
|
|
Required: John has asked your help in completing the following:
a. A sales budget.
b. A merchandise purchases budget.
c. A cash budget for the first quarter of 2005.
SOLUTION TO DEMONSTRATION PROBLEM 1 a. John Williams' sales budget:
|
SALES FORECAST: |
November |
December |
January |
February |
March |
|
Sales (units) |
25 |
40 |
10 |
20 |
30 |
|
X sales price |
$ 100 |
$ 100 |
$ 100 |
$ 100 |
$ 100 |
|
Sales revenues |
$2,500 |
$4,000 |
$1,000 |
$2,000 |
$3,000 |
|
COLLECTIONS OF SALES: |
|
Amounts Collected |
||
|
Month |
Sales Formula |
January |
February |
March |
|
This month-cash |
|
|
|
|
|
January |
$1,000 x 40% |
$400 |
|
|
|
February |
$2,000 x 40% |
|
$800 |
|
|
March |
$3,000 x 40% |
|
|
$1,200 |
|
This month-credit January |
$1,000 x 60% x 60% x 99% |
356 |
|
|
|
February |
$2,000 x 60% x 60% x 99% |
|
713 |
|
|
March |
$3,000 x 60% x 60% x 99% |
|
|
1,069 |
|
From last month's credit sales |
|
|
|
|
|
December |
$4,000 x 60% x 30% |
720 |
|
|
|
January |
$1,000 x 60% x 30% |
|
180 |
|
|
February |
$2,000 x 60% x 30% |
|
|
360 |
|
From 2 months ago-credit sales |
|
|
|
|
|
November |
$2,500 x 60% x 8% |
120 |
|
|
|
December |
$4,000 x 60% x 8% |
|
192 |
|
|
January |
$1,000 x 60% x 8% |
|
|
48 |
|
Total cash collected from sales in 1st quarter: |
$1,596 |
$1,885 |
$2,677 |
|
|
b. John Williams' merchandise purchases budget: |
|
|
|
|
||
|
Item: |
Formula: |
December |
January |
February |
March |
April |
|
Sales |
|
$4,000 |
$1,000 |
$2,000 |
$3,000 |
$2,500 |
|
COGS |
50% |
$2,000 |
$500 |
$1,000 |
$1,500 |
$1,250 |
|
+Ending inventory (15 days supply) |
50% |
250 |
500 |
750 |
625 |
|
|
<Beginning inventory> |
50% |
<1,000> |
<250> |
<500> |
<750> |
|
|
|
|
|
|
|
||
|
Formula; |
December |
January |
February |
March |
|
|
|
Gross Purchases |
|
$1,250 |
$750 |
$1,250 |
$1,375 |
|
|
Net Purchases |
98% |
$1,225 |
$735 |
$1,225 |
$1,348 |
|
|
Accounts Payable Payment Schedule: |
|
|
|
|
||
|
To pay this month (see note below) |
50% |
|
$368 |
$612 |
$674 |
|
|
Owed from last month |
50% |
|
612 |
368 |
613 |
$674 |
|
Cash outflows for accounts payable payments |
$980 |
$980 |
$1,287 |
|
||
Note: Purchase discount terms are 2/15, n30. This means that half of a month's purchases must be paid within the month, but half can wait until the next month to be paid, with all purchase discounts being taken. The $368 in February was rounded up because the $612 was rounded down resulting in the correct cash outflow of $980.
|
c. John Williams' cash budget: |
|
|
|
|
|
|
Cash Budget First Quarter, 2005 |
|||
|
|
January |
February |
March |
Totals |
|
Operational Cash Inflows: From product sales (solution part a) |
$1,596 |
$1,885 |
$2,677 |
$6,158 |
|
Operational Cash Outflows: Merchandise purchases (solution part b) |
$980 |
$980 |
$1,287 |
3,247 |
|
Selling expenses: Variable |
20 |
40 |
60 |
120 |
|
Selling expenses: Fixed |
500 |
500 |
500 |
1,500 |
|
Administrative expenses |
200 |
200 |
200 |
600 |
|
Taxes |
100 |
200 |
300 |
600 |
|
Total Operational Cash Outflows |
<$1,800> |
<$1,920> |
<$2,347> |
<$6,067> |
|
Cash From Operations |
<$204> |
<$35> |
$330 |
$91 |
|
Nonoperational Sources & Uses: Loan From Imax |
5,000 |
-0- |
-0- |
5,000 |
|
Equipment purchases |
-0- |
<5,000> |
-0- |
<5,000> |
|
Notes payable payments |
<250> |
<250> |
<250> |
<750> |
|
Total Nonoperational Cash Flows |
$4,750 |
<$5,250> |
<$250> |
<$750> |
|
Monthly Cash Flow |
$4,546 |
<$5,285> |
$80 |
<$659> |
|
Beginning cash balance |
$ -0- |
$ 4,546 |
$ 1,000 |
$ -0- |
|
Cash Surplus/<Deficit> |
$4,546 |
<$739> |
$1,080 |
<$659> |
|
Financing: Beginning line-of-credit balance |
$-0- |
$-0- |
$1,739 |
$ -0- |
|
Interest |
-0- |
-0- |
<17> |
<17> |
|
Borrowings |
-0- |
1,739 |
-0- |
1,739 |
|
Repayments |
-0- |
-0- |
<63> |
<63> |
|
Ending line-of-credit balance |
-0- |
1,739 |
1,676 |
1,676 |
|
Ending Cash Balance |
$4,546 |
$1,000 |
$1,000 |
$1,000 |
REVIEW QUESTIONS
17.1 What is the relationship between the strategic plan and the master budget?
17.2 How does a strategic plan differ from a master budget?
17.3 Define an objective. How does it differ from a goal?
17.4 What is SWOT? How does a SWOT analysis benefit the strategic plan?
17.5 What are strategies? How do they relate to the master budget?
17.6 What are the three components of a master budget?
17.7 List 4 functional roles of the management accountant in a strategic planning and master budgeting process.
17.8 How does zero-based budgeting differ from traditional, incremental budgeting approaches?
17.9 How is the budget horizon affected by continuous budgeting?
17.10 List the different budgets included within the operating budget.
17.11 Describe the different roles the operating budget serves in strategic planning, master budgeting, and responsibility accounting.
17.12 How does a capital budget differ from an operating budget?
17.13 What are the three pro forma financial statements prepared as part of the master budget?
17.14 What is the relationship between a sales forecast and a sales budget?
17.15 Contrast the two methods for preparing a sales forecast.
17.16 What is the difference between the top-down and bottom-up approaches to estimating sales?
17.17 Describe three types of statistical sales forecasts. Why are all three needed?
17.18 What is a credit collection pattern and how can it be represented as a simple multiplication chain?
17.19 If a company budgets both cash and credit sales and expects up to a two-month lag in collections of credit sales, how many sources of cash deposits are there within a month? Explain.
17.20 Why are the credit sales for months preceding the budget horizon needed when
preparing the sales budget? How many preceding months' sales are required?
17.21 When preparing the production budget, the sales forecast for the month following the budget horizon is needed. Why?
17.22 When preparing the direct materials purchases budget, why are the month preceding and the month following the budget horizon needed?
17.23 Why is it necessary to have many overhead budgets instead of just one summary budget?
17.24 Why is depreciation subtracted in the fixed overhead budget?
17.25 Not all variable selling and administrative expenses vary with sales volume. Give an example of a type of selling and administrative expense that can vary with other factors than sales volume.
17.26 What arc the three sections of the cash budget? What is the purpose of each section?
17.27 Why is a line-of-credit important?
17.28 Which lines of the cash budget do not add across into the Totals column?
17.29 How does the cash selling and administrative expenses totals from that budget need to be modified for use in the pro forma income statement?
17.30 When is a merchandise purchases budget used instead of the production operating budgets?
17.31 How does the COGS ratio differ from the Gross Profit ratio?
17.32 Why do revenues have to be converted into COGS as the first step in preparing the merchandise purchases budget?
17.33 What two responsibility accounting roles does the management accountant serve in the master budgeting process?
17.34 How can budgetary slack influence the master budget?
17.35 Do you think more or less slack will be included in the master budget if the process is perceived as an autocratic one?
CHAPTER-SPECIFIC PROBLEMS
These problems require responses based directly on concepts and techniques presented in the text.
17.36 Multiple-choice questions.
1. All of the following are characteristics of the strategic planning process except:
a. Emphasis on the long run.
b. Analysis and review of departmental budgets.
c. Analysis of consumer demand and demographics.
d. Analysis of competitive forces and technology.
2. A budget is:
a. A quantitative expression of a plan.
b. A control and performance evaluation tool.
c. A communication, coordination, and motivational tool.
d. All of the above.
3. Currently, Pulte Company uses the operational budget only as a planning tool. Management has decided that it should also be used for control purposes. To implement this change, the management accountant must:
a. Perform zero-base budgeting.
b. Organize a budget committee.
c. Revise the financial accounting system.
d. Provide timely reports to managers indicating variances between actual and budgeted values.
4. A budget system referred to as “continuous budgeting”:
a. Consolidates the direct materials purchase budgets into a blanket purchase order for continuous delivery of raw materials.
b. Drops the current month or quarter and adds a future month or quarter as the current month or quarter is completed.
c. Ranks activities from a zero base to high priority on a continuum.
d. Represents a process performed in preparing a flexible budget.
5. From top management's viewpoint, the use of budgetary slack:
a. Increases the likelihood of inefficient resource allocation.
b. Increases the ability to identify potential budget weaknesses.
c. Increases the ability to identify potential budget strengths.
d. Enables management to perform continuous budgeting.
6. The budgeting process should motivate operating managers to work toward company objectives. Which of the following is least likely to motivate operating managers?
a. Setting budget targets at challenging, but attainable levels.
b. Participating in the budgeting process.
c. Holding operating managers accountable for activities they control.
d. Having senior management set budget levels.
7. In developing a comprehensive operating budget, which of the following should be performed first?
a. Develop a production resource budget.
b. Develop a sales budget.
c. Determine the selling and administrative expenses budget.
d. Prepare a budgeted balance sheet.
17.37 Preparing the production budget. Masstore Company's sales budget shows the following estimates for the year ending December 31, 2005:
|
Quarter |
Units |
|
First |
60,000 |
|
Second |
50,000 |
|
Third |
40,000 |
|
Fourth |
80,000 |
|
Total |
230,000 |
|
|
|
January 2006 sales are forecast to be 70,000 units. The quantity of finished goods inventory at the end of each quarter is equal to 30% of the next quarter's budgeted sales in units.
Required:
Determine the units to be produced during each quarter.
17.38 Comprehensive profit plan. [CMA adapted] The Palms Manufacturing Company makes two basic products known as Cee and Dee. Data that have been assembled by the managers follow:
|
|
CEE |
DEE |
|
Requirements for finished unit: |
|
|
|
Product information: |
|
|
|
Raw material 1 |
10 pounds |
8 pounds |
|
Raw material 2 |
|
4 pounds |
|
Raw material 3 |
2 units |
1 unit |
|
Direct labor |
5 hours |
8 hours |
|
Product information: Sales price Sales units Estimated beginning inventory Desired ending inventory |
$100 12,000 400 300 |
$150 9,000 150 200 |
|
|
|
|
|
|
|
|
RAW MATERIALS |
|
|
|
|
1 |
2 |
3 |
|
Cost |
$2.00 per pound |
$2.50 per pound |
$0.50 per unit |
|
Estimated beginning inventory |
3,000 |
1,500 |
1,000 |
|
Desired ending inventory |
4,000 |
1,000 |
1,500 |
The direct labor wage rate is $4 per hour. Overhead is applied on the basis of direct labor hours. The tax rate is 40%.
The budgeted sales level is divided into quarters. Palms estimated that 20% of the annual sales will be in the first quarter, 30% in the second, and 25% in the third and fourth quarters. The beginning inventory of finished products has the same cost per unit as the ending inventory. The work-in-process inventory is negligible.
|
|
|
Palms Manufacturing Company Sales Forecasts By Products 20x1 |
|
||
|
|
Cee |
Dee |
|
||
|
|
Units |
Dollars |
Units |
Dollars |
Total Dollars |
|
First quarter |
2,400 |
$ 240,000 |
1,800 |
$ 270,000 |
$ 510,000 |
|
Second quarter |
3,600 |
360,000 |
2,700 |
405,000 |
765,000 |
|
Third quarter |
3,000 |
300,000 |
2,250 |
337,500 |
637,500 |
|
Fourth quarter |
3,000 |
300,000 |
2,250 |
337,500 |
637,500 |
|
Total |
12,000 |
$1,200,000 |
9,000 |
$1,350,000 |
$2,550,000 |
|
Factory Overhead Information |
|
|
Indirect materials |
$ 10,000 |
|
Miscellaneous supplies and tools |
5,000 |
|
Indirect labor |
40.000 |
|
Supervision |
20,000 |
|
Payroll taxes and fringe benefits |
75,000 |
|
Maintenance costs-fixed |
20,000 |
|
Maintenance costs-variable |
10,000 |
|
Depreciation |
70,000 |
|
Heat, light, and power-fixed |
8,710 |
|
Heat, light, and power-variable |
5,090 |
|
Total |
$263,800 |
|
Selling And Administrative Expense Information |
|
|
Advertising |
$ 60,000 |
|
Sales salaries |
200,000 |
|
Travel and entertainment |
60,000 |
|
Depreciation-warehouse |
5,000 |
|
Office salaries |
20,000 |
|
Executive salaries |
250,000 |
|
Supplies |
4,000 |
|
Depreciation-office |
6,000 |
|
Total |
$605,000 |
Required: Prepare the following:
a. Production budget.
b. Direct materials purchase budget.
c. Direct labor budget.
d. Factory overhead budget.
e. Cost of goods sold budget, with schedule of ending inventory.
f. Selling and administrative expense budget.
g. Budgeted income statement.
17.39 Determining units of material to be purchased. [AICPA adapted] Reid Company is budgeting sales of 100,000 units of product R for the month of September. Production of one unit of product R requires two units of material A and three units of material B. Actual inventory units at September 1 and budgeted inventory units at September 30 are as follows:
|
|
Actual |
Budgeted |
|
Product R |
20,000 |
10,000 |
|
Material A |
25,000 |
18,000 |
|
Material B |
22,000 |
24,000 |
Required: Determine how many units of material B Reid is planning to purchase during September.
17.40 Budgeting cash. [CMA adapted] Information pertaining to Noskey Corporation's sales revenue follows:
|
|
November 2004 (Actual) |
December 2004 (Budget) |
January 2005 (Budget) |
|
Cash sales |
$ 80,000 |
$100,000 |
$ 60,000 |
|
Credit sales |
240,000 |
360,000 |
180,000 |
|
Total sales |
$320,000 |
$460,000 |
$240,000 |
Management estimates that 5% of credit sales are uncollectible. Of the credit sales that are collectible, 60% are collected in the month of sale and the remainder in the month following the sale. Purchases of inventory are equal to next month's sales, and the gross profit margin is 30%. All purchases of inventory are on account; 25% are paid in the month of purchase, and the remainder are paid in the month following the purchase.
Required:
a. Calculate the budgeted cash collections in December 2004 from November 2004 credit sales.
b. Calculate budgeted total cash receipts in January 2005.
c. Calculate budgeted total cash payments in December 2004 for inventory purchases.
17.41 Budgeting for a retailer. [AICPA adapted] D. Tomlinson Retail seeks your assistance in developing cash and other budget information for May, June, and July. At April 30, the company had cash of $5,500, accounts receivable of $437,000, inventories of $309,400, and accounts payable of $133,055. The budget is to be based on the following assumptions:
Sales. Each month's sales are billed on the last day of the month. Customers are allowed a 3% discount if payment is made within 10 days after the billing date. Receivables are booked gross. 60% of the billings are collected within the discount period, 25% are collected by the end of the month, 9% are collected by the end of the second month, and 6% prove uncollectible.
Purchases. 54% of all purchases of material and selling, general, and administrative expenses are paid in the month purchased and the remainder in the following month. Each month's units of ending inventory are equal to 130% of the next month's units of sales. The cost of each unit of inventory is $20. Selling, general, and administrative expenses, of which $2,000 is depreciation, are equal to 15% of the current month's sales.
Actual and projected sales are as follows:
|
|
Dollars |
Units |
|
March |
$354,000 |
11,800 |
|
April |
363,000 |
12,100 |
|
May |
357,000 |
11,900 |
|
June |
342,000 |
11,400 |
|
July |
360,000 |
12,000 |
|
August |
366,000 |
12,200 |
Required.
a. Determine the budgeted purchases for May and June.
b. Determine the budgeted cash disbursements during June.
c. Determine the budgeted cash collections during May.
d. Determine the budgeted number of units of inventory to be purchased during July.
17.42 Budgeting for a retailer. [CMA adapted] The Russon Corporation is a retailer whose sales are all made on credit. Sales are billed twice monthly, on the 10th of the month for the last half of the prior month's sales, and on the 20th of the month for the first half of the current month's sales. The terms of all sales are 2/10, net/30. Based upon past experience, accounts receivable are collected as follows:
• Within the discount period 80%
• On the 30th day 18%
• Uncollectible 2%
Russon's average markup on its products is 20% of the sales price. All sales and purchases occur uniformly throughout the month.
The sales value of shipments for May and the forecasts for the next four months follow:
|
Revenues |
|
|
May (actual) |
$500,000 |
|
June |
600,000 |
|
July |
700,000 |
|
August |
700,000 |
|
September |
400,000 |
Russon purchases merchandise for resale to meet the current month's sales demand and to maintain a desired monthly ending inventory of 25% of the next month's sales. All purchases are on credit with terms of net/30. Russon pays for 50% of a month's purchases in the month of purchase and 50% in the month following the purchase.
Required:
a. Determine how much cash will be collected in September from sales made in August.
b. Calculate the budgeted dollar value of inventory on August 31.
c. Determine how much cash will be collected from accounts receivable collections during July.
d. Determine how much merchandise should be purchased during June.
e. Determine the amount that should be budgeted in August for the payment of merchandise.
THINK-TANK PROBLEMS
Although these problems are based on chapter material, reading extra material, reviewing previous chapters, and using creativity may be required to develop workable solutions.
17.43 Analyzing the behavioral impact of strategic planning. [CMA adapted] Sovera Enterprises, an expanding conglomerate, was founded 35 years ago by Emil Sovera. The company's policy has been to acquire businesses that show significant profit potential; if a business fails to attain projected profits, it is usually sold. Currently, the company consists of eight businesses acquired throughout the years; three of these businesses are described here.
LaBue Videodiscs produces a line of DVD players. The sale of DVD players has not met expectations, but LaBue's management believes that the company will succeed in being the first to develop a moderately priced DVD recorder/player. Market research predicts that the first company to develop this product will be a star.
Ulysses Travel Agencies also showed potential, and the travel industry is growing. However, Ulysses's market share has declined for the last two years even though Sovera has contributed a lot of money to Ulysses' operations. The travel agencies located in the midwestern and eastern sections of the country have been the biggest drain on resources.
Reddy Self-Storage was one of the first self-storage companies to open. For the last three years, Reddy has maintained a large market share while growth in the self-storage market has slowed considerably.
Ron Ebert, chairman of Sovera, prepared the agenda for the company's annual planning meeting where the present businesses were evaluated and strategies for future acquisitions were formulated. The following statements of strategy for each of the subsidiary companies discussed were formulated on the basis of the master plan:
• LaBue Videodiscs. Sovera's discretionary resources are to be employed to support the growth of this business. The future officers of Sovera are to be developed here.
• Ulysses Travel Agencies. An orderly disposal of the least profitable locations is the initial objective. Once the disposals are complete, an acceptable profit and growth strategy for the remaining locations will be formulated.
• Reddy Self-Storage. The strategy for this company is to maintain efficient operations and maximize the generation of cash for use in the further development of Sovera's other businesses.
These strategy statements were part of the strategic plan presented to Sovera's board of directors. The directors' only debate was whether Sovera should sell the entire Ulysses organization rather than parts of it. However, the board approved all three statements as presented and circulated them to managers throughout the three units as the corporation's “new marching orders.”
Required:
a. Identify corporate policies and practices needed for strategic planning to be effective.
b. Identify at least four general characteristics that differentiate the three businesses described above, and explain how these characteristics influenced the formation of a different strategy for each business.
c. Discuss the likely effects of the three strategy statements on the behavior of top management and middle management of each of the three businesses.
17.44 Explaining budgetary slack and zero-based budgeting. [CMA adapted] Bob Bingham is the controller of Atlantis Laboratories, a manufacturer and distributor of generic prescription pharmaceuticals. He is currently in the process of preparing the annual budget and reviewing the current business plan. The business unit managers of Atlantis prepare and assemble the detailed operating budgets with technical assistance from the corporate accounting staff. The final budgets are then presented by the business unit managers to the corporate executive committee for approval. The corporate accounting staff reviews the budgets for adherence to corporate accounting policies, but no detailed review for reasonableness of the line items within the budget is done.
Bingham is aware that the upcoming year for Atlantis may be a difficult one due to the expiration of a major patent and the loss of a licensing agreement for another product line. He also knows that during the budgeting process, “budgetary slack” is created in varying degrees throughout the organization. Bingham believes this slack has a negative effect on the overall business objectives of Atlantis Laboratories and should be eliminated where possible.
Required:
a. Define budgetary slack.
b. Explain the advantages and disadvantages of budgetary slack from the point of view of each of the following:
1. The business unit manager who must achieve the budget.
2. Corporate management.
c. Bob Bingham is considering implementing zero-based budgeting at Atlantis Laboratories.
1. Define zero-based budgeting.
2. Describe how zero-based budgeting could be advantageous to Atlantis Laboratories in controlling budgetary slack.
3. Discuss the disadvantages Atlantis Laboratories might encounter from using zero-based budgeting.
17.45 Preparing a direct materials purchases budget.[CMA adapted] The Press Company manufactures and sells industrial components. The Whitmore Plant is responsible for producing AD-5 and FX-3. Plastic, brass, and aluminum are used in the production of these two products.
Press Company has adopted a 13-period reporting cycle in all of its plants for budgeting purposes. Each period is four weeks long and has 20 working days. The projected inventory levels for AD-5 and FX-3 at the end of the current (seventh) period and the projected sales for these two products for the next three four-week periods follow:
|
|
|
|
||
|
|
Projected Inventory Level (Units) |
Projected Sales (In Units) |
||
|
|
End Of Seventh Period |
Eighth Period |
Ninth Period |
Tenth Period |
|
AD-5 |
3,000 |
7,500 |
8,750 |
9,500 |
|
FX-3 |
2,800 |
7,000 |
4,500 |
4,000 |
Past experience has shown that adequate inventory levels for AD-5 and FX-3 can be maintained if 40% of the next period's projected sales are on hand at the end of a reporting period. Based on this experience and the projected sales, the Whitmore Plant has budgeted production of 8,000 AD-5 and 6,000 FX-3 in the eighth period. Production is assumed to be uniform for both products within each four-week period.
The raw material specifications for AD-5 and FX-3 are as follows:
|
|
AD-5 |
FX-3 |
|
Plastic |
2.0 lb. |
1.0 lb. |
|
Brass |
0.5 lb. |
- |
|
Aluminum |
|
1.5 lb. |
Sales of AD-5 and FX-3 do not vary significantly from month to month. Consequently, the safety stock incorporated into the reorder point for each of the raw materials is adequate to compensate for variations in the sales of the finished products.
Raw material orders are placed the day the quantity on hand falls below the reorder point. Whitmore Plant's suppliers are very dependable so the given lead times are reliable. The outstanding orders for plastic and aluminum are due to arrive on the tenth and fourth working days of the eighth period, respectively. Payments for all raw material orders are remitted in the month of delivery. Purchase data and raw materials inventory status are as follows:
|
|
|
Projected Inventory Status— End Of The Seventh period (In Pounds) |
||||
|
|
Purchase Price Per Pound |
Standard Purchase Lot (In Pounds) |
Reorder Point (In Pounds) |
On Hand |
On Order |
Leadtime In Working Days |
|
Plastic |
$0.40 |
15,000 |
12,000 |
16,000 |
15,000 |
10 |
|
Brass |
0.95 |
5,000 |
7,500 |
9,000 |
|
30 |
|
Aluminum |
0.55 |
10,000 |
10,000 |
14,000 |
10,000 |
20 |
Required: Whitmore Plant is required to submit a report to corporate headquarters of Press Company summarizing the projected raw material activities before each period commences. The data for the eighth period report are being assembled. Determine the following items for plastic, brass, and aluminum for inclusion in the eighth-period report:
a. Projected quantities (in pounds) of each raw material to be issued to production.
b. Projected quantities (in pounds) of each raw material ordered and the date (in terms of working days) the order is to be placed.
c. The projected inventory balance (in pounds) of each raw material at the end of the period.
d. The payments for purchases of each raw material.
17.46 Preparing a budgeted statement of financial position. [CMA adapted] The Breckenridge Institute is a not-for-profit foundation that undertakes scientific research on a contract basis. The institute regularly does research for federal, state, and local governments as well as for business firms.
The objectives of the institute, as established by the board of trustees, are to operate a financially sound, not-for-profit organization and to provide quality research at reasonable costs for the government and business community. The board is also committed to operate with a minimum amount of debt.
Pursuant to these objectives, management has tried to develop the capability of serving its clients without using outside consultants or subcontracting work to other laboratories. Consequently, the institute has gained an excellent reputation for its research capabilities and for the economical manner in which it is operated.
Following are the Statement of Financial Position for the institute at April 30, 19X6; the Statement of Operations showing the actual results for the year ended April 30, 19X6; and the budgeted amount for the coming year ending April 30, 19X7; and the Statement of Cash Receipts and Disbursements presenting actual results and budgeted figures for the years ending April 30, 19X6 and 19X7, respectively:
|
|
Breckenridge Institute Statement Of Financial Position (000 Omitted) April 30, 19x6 |
|
|||||
|
ASSETS |
|
|
|
EQUITIES |
|
|
|
|
Current assets: |
|
|
|
Current liabilities: |
|
|
|
|
Cash |
|
|
$ 110 |
Accounts payable |
|
|
$120 |
|
Marketable securities |
|
|
80 |
Accrued payroll |
|
|
|
|
Accounts receivable: |
|
|
|
payroll taxes and benefits |
|
|
46 |
|
Government contracts |
|
$ 230 |
|
Due to outside consultants |
|
|
20 |
|
Private contracts |
$ 150 |
|
|
Interest payable |
|
|
16 |
|
Less allowance for uncollectibles |
10 |
140 |
370 |
Current portion of long-term debt |
|
|
60 |
|
Materials and supplies |
|
|
64 |
Total current liabilities |
|
|
262 |
|
Prepaid insurance |
|
|
6 |
Long-term debt |
|
|
240 |
|
Total current assets |
|
|
630 |
Total liabilities |
|
|
502 |
|
Plant and equipment (net of depreciation) |
|
|
1,200 |
Original capital |
|
$1,000 |
|
|
Total assets |
|
|
$1,830 |
Accumulated excess of revenues over expenditures |
|
328 |
1,328 |
|
|
|
|
|
Total equities |
|
|
$1,830 |
|
|
|
|
|
|
|
|
|
|
Statement Of Operations (000 Omitted) |
|
Cash Receipts And Disbursements (000 Omitted) |
|
||||
|
|
Actual Results For Year Ended 4/30/x6 |
Budget for Year Ended 4/30/x7
|
|
|
|
Actual Results For Year Ended 4/30/x6 |
Budget For Year Ended 4/30/x7
|
|
Revenues from operations: |
|
|
|
Receipts: |
|
|
|
|
Federal government |
$1,500 |
$1,650 |
|
Contracts: |
|
|
|
|
State and local government |
224 |
250 |
|
Federal, state and local governments |
|
$1,700 |
$1,820 |
|
Private (less provision for bad debts (of $19 and $25) |
1,216 |
1,335 |
|
Private |
|
1,200 |
1,300 |
|
|
|
|
|
|
|
2,900 |
3,120 |
|
|
|
|
|
Interest |
|
4 |
2 |
|
Interest |
4 |
2 |
|
Sales of marketable securities |
— |
50 |
|
|
Total revenues |
2,944 |
3,237 |
|
Total receipts |
2,904 |
3,172 |
|
|
Operating expenses: |
|
|
|
Disbursements: |
|
|
|
|
Personnel: Salaries |
1,390 |
1,300 |
|
Salaries and wages |
1,560 |
1,510 |
|
|
Wages |
175 |
200 |
|
Employee benefits |
260 |
300 |
|
|
Employee benefits and payroll taxes |
273 |
300 |
|
Consultant fees |
15 |
230 |
|
|
Consultants |
35 |
250 |
|
Employee training programs |
20 |
35 |
|
|
Employee training |
20 |
35 |
|
Materials and supplies |
540 |
575 |
|
|
Materials and supplies |
548 |
600 |
|
Utilities |
55 |
65 |
|
|
Utilities |
60 |
60 |
|
Insurance |
20 |
22 |
|
|
Insurance |
20 |
20 |
|
Other expenses |
117 |
123 |
|
|
Depreciation |
160 |
165 |
|
Interest |
18 |
16 |
|
|
Other expenses |
117 |
123 |
|
Retirement of debt |
60 |
60 |
|
|
Interest charges |
16 |
14 |
|
Purchases of capital |
|
|
|
|
Total operating expenses |
2,814 |
3,067 |
|
equipment |
80 |
315 |
|
|
Excess of revenues over expenses |
$ 130 |
$ 170 |
|
Total disbursements |
2745 |
3251 |
|
|
|
|
|
|
Increase <decrease> in cash |
$ 159 |
$ <79> |
|
During the construction of the budget, the following additional information was developed:
1. Purchases of materials and supplies were budgeted at $610,000. 2. Write-offs of specific accounts receivable are estimated as follows:
a. $8,000 of the accounts receivable balance at April 30, 19X6.
b. Uncollectible accounts of $12,000 from fiscal 19X7 sales to be written off in fiscal 19X7.
3. The unusually large budgeted expenditure for capital equipment is part of a three-year program begun in 19X6 to enable the institute to enter new areas of scientific research. Similar amounts will be spent in the next two years for additional equipment. Increased revenues from the new capabilities will not be significant until 19X9.
4. The increased level of consultant fees is expected to continue until the capital expansion program is complete.
Required:
a. In addition to the two budgeted statements already prepared for the coming fiscal year, prepare a budgeted statement of financial position as of April 30, 19X7, for presentation to the board of trustees.
b. Prepare a report that identifies the financial difficulties the institute's management will face in the next several years in fulfilling the objectives established by the board of trustees.
17.47 Preparing a projected income statement. [CMA adapted] The Metropolitan News, a daily newspaper, services a community of 100,000. The paper has a circulation of 40,000, with 32,000 copies delivered directly to subscribers. The rate schedule for the paper is as follows:
|
|
DAILY |
SUNDAY |
|
Single issue price |
$0.15 |
$0.30 |
|
Weekly subscription |
$1.00 (includes daily and Sunday) |
|
The paper has experienced profitable operations as can he seen from the Income Statement for the year ended September 30, 19X4 (numbers are in thousands):
|
|
|
|
|
Revenue: Newspaper sales |
$2,200 |
|
|
Advertising sales |
1,800 |
$4,000 |
|
Costs and expenses: Personnel costs: Commissions: Carriers |
$ 292 |
|
|
Sales |
73 |
|
|
Advertising |
48 |
|
|
Salaries: Administration |
250 |
|
|
Advertising Equipment operators |
100 500 |
|
|
Newsroom |
400 |
|
|
Employee benefits |
195 |
1,858 |
|
Newsprint |
|
834 |
|
Other supplies |
|
417 |
|
Repairs |
|
25 |
|
Depreciation |
|
180 |
|
Property taxes |
|
120 |
|
Building rental |
|
80 |
|
Automobile leases |
|
10 |
|
Other |
|
90 |
|
Total costs and expenses |
|
3,614 |
|
income before income taxes |
|
386 |
|
Income taxes |
|
154 |
|
Net income |
|
$ 232 |
The Sunday edition usually has twice as many pages as the daily editions. Direct edition variable costs for 19X3-X4 are shown in the following schedule:
|
|
Cost per Issue |
|
|
|
Daily |
Sunday |
|
Paper |
$0.050 |
$0.100 |
|
Other supplies |
0.025 |
0.050 |
|
Carrier and sales commissions |
0.025 |
0.025 |
|
|
$0.100 |
$0.175 |
The company has scheduled the following changes in operations for the next year and anticipates some increased costs:
1. The building lease expired on September 30, 19X4, and has been renewed with a change in the rental fee provisions from a straight fee to a fixed fee of $60,000 plus 1% of newspaper sales.
2. The Advertising Department will eliminate the payment of a 4% advertising commission on contracts sold by its employees. An average of two-thirds of the advertising has been sold on a contract basis in the past. The salaries of the four employees who solicited advertising will be raised from $7,500 each to $14,000 each.
3. Automobiles will no longer be leased. Employees whose jobs require automobiles will use their own and be reimbursed at $0.15 per mile. The leased cars were driven 80,000 miles in 19X3-X4, and it is estimated that the employees will drive some 84,000 miles next year on company business.
4. Cost increases estimated for next year:
Newsprint, $0.01 per daily issue and $0.02 for the Sunday paper
Salaries:
Equipment operators, 8% Other employees, 6%
Employee benefits (from 15% of personnel costs excluding carrier and sales commissions to 20%), 5%
5. Circulation increases of 5% in newsstand and home delivery are anticipated.
6. Advertising revenue is estimated at $1,890,000 with $1,260,000 from employee-solicited contracts.
Required:
a. Prepare a projected income statement for Metropolitan News for the 19X4-X5 fiscal year using a format that shows the total variable costs and total fixed costs for the newspaper (round calculations to the nearest thousand dollars).
b. The management of Metropolitan News is contemplating one additional proposal for the 19X4-X5 fiscal year-raising the rates for the newspaper to the following amounts:
|
|
Daily |
Sunday |
|
Single issue price |
$0.20 |
$0.40 |
|
Weekly subscription (includes daily and Sunday) |
|
$1.25 |
The company estimates that the newspaper's circulation would decline to 90% of the currently anticipated 19X4-X5 level for both newsstand and home delivery sales if this change is initiated. Calculate the effect on the projected 19X4-X5 income if this proposed rate increase is implemented.
17.48 Preparing budgets and comparing actual with budgeted costs. [CMA adapted] The Melcher Company produces farm equipment at several plants. The business is seasonal and cyclical in nature. The company has attempted to use budgeting for planning and controlling activities, but the variable nature of the business has caused some company officials to be skeptical about the usefulness of budgeting to the company. The accountant for the Adrian Plant has been using a system she calls “flexible budgeting” to help plant management control operations.
The company president asks the management accountant to explain what the term means, how she applies the system at the Adrian Plant, and how it can be applied to the company as a whole. The accountant presents the following data as part of her explanation:
|
Actual Data For January 19X3 Hours worked |
8,400 |
|
Units produced |
3,800 |
|
Costs incurred: Material (24,000 lb.) |
$36,000 |
|
Direct labor |
25,200 |
|
Indirect labor |
6,000 |
|
Indirect materials |
600 |
|
Repairs |
1,800 |
|
Depreciation |
3,250 |
|
Supervision |
3,000 |
|
Total |
$75,850 |
|
Budget Data For 19X3 Normal monthly capacity of the plant in direct labor hours 10,000 hours Material costs 6 lb. @ $1.50 $9.00/unit Labor costs 2 hours @ $3.00 $6.001unit |
|
|
Overhead Estimate At Normal Monthly Capacity |
|
|
Variable (controllable): Indirect labor |
$6,650 |
|
Indirect materials |
600 |
|
Repairs |
750 |
|
Total variable |
8,000 |
|
Fixed (noncontrollable): Depreciation |
3,250 |
|
Supervision |
3,000 |
|
Total fixed |
6,250 |
|
Total fixed and variable |
$14,250 |
|
Planned units for January 19X3 |
4,000 |
|
Planned units for February 19X3 |
6,000 |
Required:
a. Prepare a budget for January.
b. Prepare a report for January comparing actual and budgeted costs for the actual activity for the month.
c. Can flexible budgeting be applied to the nonmanufacturing activities of the company? Explain your answer.
17-49 Employing flexible budgeting. [CMA adapted] The University of Boyne offers an extensive continuing education program in many cities throughout the state. For the convenience of its faculty and administrative staff and also to save costs, the university operates a motor pool. The motor pool operated with 20 vehicles until February of this year when an additional automobile was acquired, increasing the total to 21 vehicles. The motor pool furnishes gasoline, oil, and other supplies for the cars and hires one mechanic who does routine maintenance and minor repairs. Major repairs are done at a nearby commercial garage. A supervisor manages the operations.
Each year the supervisor prepares an operating budget for the motor pool. The budget informs university management of the funds needed to operate the pool.
Depreciation on the automobiles is recorded in the budget in order to determine the cost per mile.
The following schedule presents the annual budget approved by the university. The actual costs for March are compared to one-twelfth of the annual budget.
|
|
University Motor Pool Budget Report For March 19x6 |
|||
|
|
Annual Budget |
One-month Budget |
March Actual |
Over/under |
|
Gasoline |
$24,000 |
$2,000 |
$2,800 |
$800* |
|
Oil, minor repairs, parts, and supplies |
3,600 |
300 |
380 |
80* |
|
Outside repairs |
2,700 |
225 |
50 |
175 |
|
Insurance |
6,000 |
500 |
525 |
25* |
|
Salaries and benefits |
30,000 |
2,500 |
2,500 |
— |
|
Depreciation |
26,400 |
2,200 |
2,310 |
110* |
|
|
$92,700 |
$7,725 |
$8,565 |
$840* |
|
Total miles |
600,000 |
50,000 |
63,000 |
|
|
Cost per mile |
$0.1545 |
$0.1545 |
$0.1360 |
|
|
Number of automobiles |
20 |
20 |
21 |
|
The annual budget was constructed based on the following assumptions:
• 20 automobiles in the pool.
• 30,000 miles per year per automobile.
• 15 miles per gallon per automobile.
• $0.60 per gallon for gas.
• $0.006 per mile for oil, minor repairs, parts, and supplies.
• $135 per automobile in outside repairs.
The supervisor is unhappy with the monthly report comparing budget and actual costs for March. He claims it presents his performance for March unfairly. His previous employer used flexible budgeting to compare actual costs to budgeted amounts.
Required:
a. Employing flexible budgeting techniques, prepare a report that shows budgeted amounts, actual costs, and monthly variation for March.
b. Explain briefly the basis of your budget figure for outside repairs.
17.50 Forecasting cash position and managing cash. [CMA adapted] The Barker Corporation manufactures and distributes wooden baseball bats. The bats are manufactured in Georgia at its only plant. This is a seasonal business with a large portion of its sales occurring in late winter and early spring. The production schedule for the last quarter of the year is heavy in order to build up inventory to meet expected sales volume.
The company experiences a temporary cash strain during this heavy production period. Payroll costs rise during the last quarter because overtime is scheduled to meet the increased production needs. Collections from customers are low because the fall season produces only modest sales. This year the company's concern is intensified because prices are increasing during the current inflationary period. In addition, the Sales Department forecasts sales of fewer than one million bats for the first time in three years. This decrease in sales appears to he caused by the popularity of aluminum bats.
The cash account builds up during the first and second quarters as sales exceed production. The excess cash is invested in U.S. Treasury bills and other commercial paper. During the last half of the year, the temporary investments are liquidated to meet the cash needs. In the early years of the company, short-term borrowing was used to supplement the funds released by selling investments, but this has not been necessary in recent years. Because costs are higher this year, the treasurer asks for a forecast for December to judge if the $40,000 in temporary investments will be adequate to carry the company through the month with a minimum balance of $10,000. Should this amount ($40,000) be insufficient, she wants to begin negotiations for a short-term loan.
The unit sales volume for the past two months and the estimate for the next four months are as follows:
|
October (actual) |
70,000 |
January (estimated) |
90,000 |
|
November (actual) |
50,000 |
February (estimated) |
90,000 |
|
December (estimated) |
50,000 |
March (estimated) |
120,000 |
The bats are sold for $3 each. All sales are made on account. Half of the accounts are collected in the month of the sale, 40% are collected in the month following the sale, and the remaining 10% in the second month following the sale. Customers who pay in the month of the sale receive a 2% cash discount.
The production schedule for the six-month period beginning with October reflects the company's policy of maintaining a stable year-round work force by scheduling overtime to meet the following production schedules:
|
October (actual) |
90,000 |
January (estimated) |
90,000 |
|
November (actual) |
90,000 |
February (estimated) |
100,000 |
|
December (estimated) |
90,000 |
March (estimated) |
100,000 |
The bats are made from wooden blocks that cost $6 each. Ten bats can be produced from each block. The blocks are acquired one year in advance so they can be properly aged. Barker pays the supplier one-twelfth of the cost of this material each month until the obligation is retired. The monthly payment is $60,000.
The plant is normally scheduled for a 40-hour, five-day work week. During the busy production season, however, the work week may he increased to six 10-hour days. Workers can produce 7.5 bats per hour. Normal monthly output is 75,000 bats. Factory employees are paid $4 per hour (up $0.50 from last year) for regular time and time and one-half for overtime.
Other manufacturing costs include variable overhead of $0.30 per unit and annual fixed overhead of $280,000. Depreciation charges totalling $40,000 are included among the fixed overhead. Selling expenses include variable costs of $0.20 per unit and annual fixed costs of $60,000. Fixed administrative costs are $120,000 annually. All fixed costs are incurred uniformly throughout the year.
The controller has accumulated the following additional information:
1. The balances of selected accounts as of November 30, 19X4, are as follows:
Cash $ 12,000
Marketable securities (cost and market are the same) 40,000
Accounts receivable 96,000
Prepaid expenses 4,800
Accounts payable (arising from raw material purchases) 300,000
Accrued vacation pay 9,500
Equipment note payable 102,000
Accrued income taxes payable 50,000
2. Interest to be received from the company's temporary investments is estimated at $500 for December.
3. Prepaid expenses of $3,600 will expire during December, and the balance of the prepaid account is estimated at $4,200 for the end of December.
4. Barker purchased new machinery in 19X4 as part of a plant modernization program. The machinery was financed by a 24-month note of $144,000. The terms call for equal principal payments over the next 24 months with interest paid at the rate of 1% per month on the unpaid balance at the first of the month. The first payment was made on May 1, 19X4.
5. Old equipment, which has a book value of $8,000, is to be sold during December for $7,500.
6. Each month the company accrues $1,700 for vacation pay by charging Vacation Pay Expense and crediting Accrued Vacation Pay. The plant closes for two weeks in June when all plant employees take a vacation.
7. Quarterly dividends of $0.20 per share will be paid on December 15 to stock-holders of record. Barker Corporation has authorized 10,000 shares. The company has issued 7,500 shares, and 500 of these are classified as treasury stock.
8. The quarterly income taxes payment of $50,000 is due on December 15, 19X4.
Required:
a. Prepare a schedule that forecasts the cash position at December 31, 19X4.What action, if any, will be required to maintain a $10,000 cash balance?
b. Without prejudice to your answer in Requirement (a), assume Barker regularly needs to arrange short-term loans during the November-to-February period. What changes might Barker consider in its methods of doing business to reduce or eliminate the need for short-term borrowing?
17.51 Preparing a revised operating budget. The Mason Agency, a division of General Service Industries, offers consulting services to clients for a fee. The corporate management at General Service is pleased with the performance of the Mason Agency for the first nine months of the current year and has recommended that the division manager of the Mason Agency, Richard Howell, submit a revised forecast for the remaining quarter, as the division has exceeded the annual plan year-to-date by 20% of operating income. An unexpected increase in billed hour volume over the original plan is the main reason for this gain in income. The original operating budget for the first three quarters for the Mason Agency follows:
|
|
The Mason Agency |
|
|
|
|
|
20x4-20x5 Operating Budget |
|
||
|
|
|
|
|
|
|
|
First Quarter |
Second quarter |
Third quarter |
Total Nine Months |
|
Revenues |
|
|
|
|
|
Consulting fees |
|
|
|
|
|
Management consulting |
$ 315,000 |
$ 315,000 |
$ 315,000 |
$ 945,000 |
|
EDP Consulting |
421,875 |
421,875 |
421,875 |
1,265,625 |
|
Total Consulting fees |
$ 736,875 |
$ 736,875 |
$ 736,875 |
$ 2,210,625 |
|
Other Revenues |
10,000 |
10,000 |
10,000 |
30,000 |
|
Total Revenues |
$ 746,875 |
$ 746,875 |
$ 746,875 |
$ 2,240,625 |
|
|
|
|
|
|
|
Expenses |
|
|
|
|
|
Consultant salary expense |
$ 386,750 |
$ 386,750 |
$ 386,750 |
$ 1,160,250 |
|
Travel and related expense |
45,625 |
45,625 |
45,625 |
136,875 |
|
General and administrative expense |
100,000 |
100,000 |
100,000 |
300,000 |
|
Depreciation expense |
40,000 |
40,000 |
40,000 |
120,000 |
|
Corporate allocation |
50,000 |
50,000 |
50,000 |
150,000 |
|
Total expenses |
$ 622,375 |
$ 622,375 |
$ 622,375 |
$ 1,867,125 |
|
Operating income |
$ 124,500 |
$ 124,500 |
$ 124,500 |
$ 373,500 |
When comparing the actuals for the first three quarters to the original plan, Howell analyzed the variances and will reflect the following information in his revised forecast for the fourth quarter:
• The division currently has 25 consultants on staff, 10 for management consulting and 15 for EDP consulting, and has hired three additional management consultants to start work at the beginning of the fourth quarter in order to meet the increased client demand.
• The hourly billing rate for consulting revenues is market acceptable and will remain at $90 per hour for each management consultant and $75 per hour for each EDP consultant. However, due to the favorable increase in billing hour volume when compared to plan, the hours for each consultant will be increased by 50 hours per quarter. There is no learning curve for billable consulting hours for new employees.
• The budgeted annual salaries and actual annual salaries, paid monthly, are the same at $50,000 for a management consultant and 8% less for an EDP consultant. Corporate management has approved a merit increase of 10% at the beginning of the fourth quarter for all 25 existing consultants, while the new consultants will be compensated at the planned rate.
• The planned salary expense includes a provision for employee fringe benefits amounting to 30% of the annual salaries; however, the improvement of some corporatewide employee programs will increase the fringe benefit allocation to 40%.
• The original plan assumes a fixed hourly rate for travel and other related expenses for each billing hour of consulting. These are expenses that are not reimbursed by the client, and the previously determined hourly rate has proven to be adequate to cover these costs.
• Other revenues are derived from temporary rentals and interest income and remain unchanged for the fourth quarter.
• General and administrative expenses have been favorable at 7% below the plan; this 7% savings on fourth quarter expenses will be reflected in the revised plan.
• Depreciation for office equipment and microcomputers will stay constant at the projected straight-line rate.
• Due to the favorable experience for the first three quarters and the division's increased ability to absorb costs, the corporate management at General Service Industries has increased the corporate expense allocation by 50%.
Required:
a. Prepare a revised operating budget for the fourth quarter for the Mason Agency that Richard Howell will present to General Service Industries. Be sure to furnish supporting calculations for all revised revenue and expense amounts.
b. Discuss the reasons why an organization would prepare a revised forecast.
17.52 Preparing a flexible budget. [CMA adapted] Pearsons, a successful regional chain of moderately priced restaurants, each with a carry-out delicatessen department, is planning to expand to a nationwide operation. As the chain gets larger and covers more territory, managerial control and reporting techniques become more important.
The company's management believes that a budget program for the entire company as well as for each restaurant-deli unit is needed. The budget presented below has been prepared for the typical unit in the chain. Once a new unit is in operation, it is expected to perform in accordance with the budget.
All units are of approximately the same size with a similar amount of space devoted to the carry-out delicatessen. The facilities and the equipment used are uniform in all units. The unit operators are expected to implement the advertising program recommended by the corporation. The corporation charges a franchise fee, which is a percentage of gross sales, for the use of the company name, the building and facilities design, and the advertising advice.
The unit in Akron, Ohio, was selected to test the budget program. Its performance for the year ended December 31, 19X5, compared to the typical budget, is presented next:
|
Pearsons Restaurant-deli Akron, Ohio Net Income For The Year Ended December 31, 19x5 |
|||||
|
|
Actual Results |
|
|
|
|
|
|
Delicatessen |
Restaurant |
Total |
Budget |
Over <Under> Budget |
|
Gross sales |
$1,200 |
$2,000 |
$3,200 |
$3,500 |
<$300> |
|
Purchases |
780 |
800 |
1,580 |
1,600 |
< 20> |
|
Hourly wages |
60 |
700 |
760 |
925 |
<165> |
|
Franchise fee |
36 |
60 |
96 |
105 |
< 9> |
|
Advertising |
100 |
200 |
300 |
300 |
— |
|
Utilities |
76 |
100 |
176 |
195 |
< 19> |
|
Depreciation |
50 |
75 |
125 |
125 |
- |
|
Lease expense |
30 |
50 |
80 |
80 |
- |
|
Salaries |
30 |
50 |
80 |
80 |
|
|
Total |
1,162 |
2,035 |
3,197 |
3,410 |
<213> |
|
Net income before income taxes |
$ 38 |
< $35> |
$3 |
$ 90 |
<$ 87> |
Required:
a. Prepare a schedule that compares a flexible budget for the deli line of the Akron restaurant-deli to its actual performance.
b. Would a complete report, comparing a flexible budget to the performance of each of the two operations, make the problems of the Akron operation easier to identify? Explain, using an example from the problem and your answer to Requirement (a).
c. Should a flexible budget comparison to actual performance become part of the regular reporting system for the following?
1. The annual review.
2. A monthly review.
Explain your answer.
17.53 Developing a cash budget. [CMA adapted] The Triple-F Health Club (Family, Fitness, and Fun) is a nonprofit family-oriented health club. The club's board of directors is developing plans to acquire more equipment and expand the club facilities. The board plans to purchase about $25,000 of new equipment each year and wants to establish a fund to purchase the adjoining property in four or five years. The adjoining property has a market value of about $300,000.
The club manager, Jane Crowe, is concerned that the board has unrealistic goals in light of the club's recent financial performance. She has sought the help, of a club member with an accounting background to assist her in preparing a report to the board supporting her concerns.
The club member reviewed the club's records, including the cash basis income statement presented next:
|
Triple-f Health Club Statement Of Income (Cash Basis) For Years Ended October 31 |
||
|
(000 OMITTED) |
2005 |
2004 |
|
Cash revenues: Annual membership fees |
$355.0 |
$300.0 |
|
Lesson and class fees |
234.0 |
180.0 |
|
Miscellaneous |
2.0 |
1.5 |
|
Total cash received |
591.0 |
481.5 |
|
Cash expenses: |
|
|
|
|
|
2005 |
2004 |
|
|
Manager's salary and benefits |
36.0 |
36.0 |
|
|
Regular employees' wages and benefits |
190.0 |
190.0 |
|
|
Lesson and class employees' wages and benefits |
195.0 |
150.0 |
|
|
Towels and supplies |
16.0 |
15.5 |
|
|
Utilities (heat and light) |
22.0 |
15.0 |
|
|
Mortgage interest |
35.1 |
37.8 |
|
|
Miscellaneous |
2.0 |
1.5 |
|
|
Total cash expenses |
496.1 |
445.8 |
|
|
Cash income |
$ 94.9 |
$ 35.7 |
|
• Other financial information as of October 31, 2005;
• Cash in checking account, $7,000
• Petty cash, $300
• Outstanding mortgage balance, $390,000
• Accounts payable arising from invoices for supplies and utilities that are unpaid as of October 31, 2005, $2,500
• No unpaid bills existed on October 31, 2004.
• The club purchased $25,000 worth of exercise equipment during the current fiscal year. Cash of $10,000 was paid on delivery, and the balance was due on October 1 but has not been paid as of October 31, 2005.
• The club began operations in 1989 in rental quarters. In October 2001, it purchased its current property (land and building) for $600,000, paying $120,000 down and agreeing to pay $30,000 plus 9% interest annually on November 1 until the balance was paid off.
• Membership rose 3% during 2005. The club has experienced approximately this same annual rate since it opened.
• Membership fees were increased by 15% in 2005. The board has tentative plans to increase the fees by 10% in 2006.
• Lesson and class fees have not been increased for three years. The board policy is to encourage classes and lessons by keeping the fees low. The members have taken advantage of this policy, and the number of classes and lessons has increased significantly each year. The club expects the percentage growth experienced in 2005 to be repeated in 2006.
• Miscellaneous revenues are expected to grow at the same percentage as experienced in 2005.
• Operating expenses are expected to increase. Hourly wage rates and the manager's salary will need to he increased 15% because no increases were granted in 2005. Towels and supplies, utilities, and miscellaneous expenses are expected to increase 25%.
Required:
a. Construct a cash budget for 2006 for the Triple-F Health Club.
b. Identify any operating problems) that this budget discloses for the Triple-F Health Club. Explain your answer.
c. Is Jane Crowe's concern that the board's goals are unrealistic justified? Explain your answer.
17.54 Profit planning for small businesses. [CMA adapted] Small businesses are usually the first organizations to feel the effects of a recession and are generally the last to recover. Two major reasons for small business financial difficulties are managerial inexperience and inadequate financing or financial management.
Small business managers frequently have problems in planning and controlling profits, including revenue generation and cost reduction activities. These important financial methods are especially critical during a recession. The financial problems of small businesses are further compounded when there are poor accounting records and inexperience in the management of money.
Required:
a. Profit planning is critical for the planning and controlling of profits of a small business. identify key features that need to be considered when developing a profit plan.
b. The management accountant can help assure that good accounting records exist in an organization. Discuss the key features that form the basis for a good accounting system that will support management decisions.
c. Explain how the management accountant can assist an organization in adopting measures to assure appropriate money management.
17.55 Preparing a revised budgeted cash receipts and disbursements statement. [CMA adapted] The Pantex Corporation has gone through a period of rapid expansion to reach its present size of seven divisions. The expansion program has placed strains on its cash resources. Therefore, the need for better cash planning at the corporate level has become very important.
At the present time, each division is responsible for the collection of receivables and the disbursements for all operating expenses and approved capital projects. The corporation does exercise control over division activities and has attempted to coordinate the cash needs of the divisions and the corporation. However, it has not yet developed effective division cash reports from which it can determine the needs and availability of cash in the next budgetary year. As a result of inadequate information, the corporation permitted some divisions to make expenditures for goods and services that need not have been made or that could have been postponed until a later time, while other divisions had to delay expenditures that should have had a greater priority.
The 19X8 cash receipts and disbursements plan prepared by the Tapon Division for submission to the corporate office is as follows:
|
Tapon Division Budgeted Cash Receipts And Disbursements For The Year Ended December 31, 19x8 |
|
|
(000 OMITTED) |
|
|
Receipts: Collections on accounts |
$9,320 |
|
Miscellaneous |
36 |
|
|
9,356 |
|
Disbursements: Production: Raw materials |
2,240 |
|
Labor and fringe benefits |
2,076 |
|
Overhead |
2,100 |
|
Sales: Commissions |
395 |
|
Travel and entertainment |
600 |
|
Other |
200 |
|
Administrative: Accounting |
80 |
|
Personnel |
110 |
|
General management |
350 |
|
Capital expenditures |
1,240 |
|
|
9,391 |
|
Excess of receipts over <under> disbursements |
<$35> |
The following additional information was used by the Tapon Division to develop the cash receipts and disbursements budget:
• Receipts. Miscellaneous receipts are estimated proceeds from the sales of unneeded equipment.
• Sales. Travel and entertainment represents the costs required to produce the sales volume projected for the year. The other sales costs consist of $50,000 for training new sales personnel, $25,000 for attendance by sales personnel at association meetings (not sales shows), and $125,000 for sales management salaries.
• Administration. The personnel costs include $50,000 for salary and department operating costs, $20,000 for training new personnel, and $40,000 for management training courses for current employees. The general management costs include $310,000 in salaries and office costs for the division management plus $10,000 for officials' travel to Pantex Corporation meetings and $30,000 for industry and association conferences.
Capital expenditures. Planned expenditures for capital items during 19X8 are as follows:
Capital Programs Approved By The Corporation
|
Items ordered in 19X8 for delivery in 19X8 |
$300,000 |
|
sterns to be ordered in 19X8 for delivery in 19X8 |
$700,000 |
|
New programs to be submitted to corporation during 19X8 |
$240,000 |
Required: Present a revised budgeted cash receipts and disbursements statement for the Tapon Division. Design the format of the revised statement so that it includes adequate detail to improve the corporation's ability to judge the urgency of the cash needs. Such a statement would be submitted by all divisions to provide the basis for overall corporation cash planning.
17.56 Preparing a pro forma schedule of cash receipts and disbursements. [CMA adapted] CrossMan Corporation, a rapidly expanding crossbow distributor to retail outlets, is in the process of formulating plans for 2004. Joan Caldwell, director of marketing, has completed her 2004 forecast and is confident that sales estimates will he met or exceeded. The following sales figures show the growth expected and will provide the planning basis for other corporate departments:
|
Month |
Forecast sales |
Month |
Forecast sales |
|
January |
$1,800,000 |
July |
$3,000,000 |
|
February |
2,000,000 |
August |
3,000,000 |
|
March |
1,800,000 |
September |
3,200,000 |
|
April |
2,200,000 |
October |
3,200,000 |
|
May |
2,500,000 |
November |
3,000,000 |
|
June |
2,800,000 |
December |
3,400,000 |
George Brownell, assistant controller, has been given the responsibility for formulating the cash flow projection, a critical element during a period of rapid expansion. The following information will be used in preparing the cash analysis:
CrossMan has experienced an excellent record in accounts receivable collection and expects this trend to continue. Sixty percent of billings are collected in the month after the sale and 40% in the second month after the sale. Uncollectible accounts are nominal and will not be considered in the analysis.
The purchase of the crossbows is CrossMan's largest expenditure; the cost of these items equals 50% of sales. Sixty percent of the crossbows are received one month prior to sale, and 40% are received during the month of sale. Prior experience shows that 80% of accounts payable are paid by CrossMan one month after receipt of the purchased crossbows, and the remaining 20% are paid the second month after receipt.
Hourly wages, including fringe benefits, are a factor of sales volume and are equal to 20% of the current month's sales. These wages are paid in the month incurred.
General and administrative expenses are projected to he $2,640,000 for 2004. The composition of the expenses is given below. All of these expenses: are incurred uniformly throughout the year except the property taxes. Property taxes are paid in four equal installments in the last month of each quarter.
|
Salaries |
$ 480,000 |
|
Promotion |
660,000 |
|
Property taxes |
240,000 |
|
Insurance |
360,000 |
|
Utilities |
300,000 |
|
Depreciation |
600,000 |
|
Total |
$2,640,000 |
• CrossMan makes income tax payments in the first month of each quarter based on the income for the prior quarter. CrossMan's income tax rate is 40%. CrossMan's net income for the first quarter of 2004 is projected to be $612,000.
• CrossMan has a corporate policy of maintaining an end-of-month cash balance of $100,000. Cash is invested or borrowed monthly, as necessary, to maintain this balance.
• CrossMan uses a calendar year reporting period.
Required:
a. Prepare a Pro Forma Schedule of Cash Receipts and Disbursements for Cross-Man Corporation, by month, for the second quarter of 2004. Be sure that all receipts, disbursements, and borrowing/investing amounts are presented on a monthly basis. Ignore the interest expense and/or interest income associated with the borrowing/investing activities.
b. Discuss why cash budgeting is particularly important for a rapidly expanding company such as CrossMan Corporation.
17.57 Ethics in budgeting. [CMA adapted] Norton Company, a manufacturer of infant furniture and carriages, is in the initial stages of preparing the annual budget for 2005. Scott Ford has recently joined Norton's accounting staff and is interested in learning as much as possible about the company's budgeting process. During a recent lunch with Marge Atkins, sales manager, and Pete Granger, production manager, Ford initiated the following conversation:
Ford: “Since I'm new around here and am going to be involved with the preparation of the annual budget, I'd be interested to learn how the two of you estimate sales and production numbers.”
Atkins: “We start out very methodically by looking at recent history, discussing what we know about current accounts, potential customers, and the general state of consumer spending. Then, we add that usual dose of intuition to come up with the best forecast we can.”
Granger: “I usually take the sales projections as the basis for my projections. Of course, we have to make an estimate of what this year's closing inventories will be, and that sometimes is difficult.”
Ford: “Why does that present a problem? There must have been an estimate of closing inventories in the budget for the current year.”
Granger: “Those numbers aren't always reliable since Marge makes some adjustments to the sales numbers before passing them on to me.”
Ford: “What kind of adjustments?”
Atkins: “Well, we don't want to fall short of the sales projections so we generally give ourselves a little breathing room by lowering the initial sales projection anywhere from 5-10%.”
Granger: “So, you can see why this year's budget is not a very reliable starting point. We always have to adjust the projected production rates as the year progresses and, of course, this changes the ending inventory estimates. By the way, we make similar adjustments to expenses by adding at least 10% to the estimates; I think everyone around here does the same thing.”
Required:
a. Marge Atkins and Pete Granger have described the use of budgetary slack.
1. Explain why Atkins and Granger behave in this manner, and describe the benefits they expect to realize from the use of budgetary slack.
2. Explain how the use of budgetary slack can adversely affect Atkins and Granger.
b. As a management accountant, Scott Ford believes that the behavior described by Marge Atkins and Pete Granger may be unethical and that he may have an obligation not to support this behavior. By citing the specific standards of competence, confidentiality, integrity, and/or objectivity from Standards of Ethical Conduct for Management Accountants, explain why the use of budgetary slack may be unethical.