Chapter 20 : Segmenting The Enterprise For Profit Performance Evaluation
LEARNING OBJECTIVES
After studying this chapter, you should be able to:
1 Examine responsibility centers and state their purpose.
2 Relate responsibility centers and responsibility accounting system design to profit performance evaluation.
3 Segment the profit center's income statement for segment and manager performance evaluation.
4 Identify the relevant profit elements for the add-or-drop decision, and describe how product life cycle analysis and the growth /share matrix are used.
5 Calculate profit performance measures for investment center managers.
6 Discuss Kyocera's amoeba system and new organizational structures in American firms.
INTRODUCTION
An enterprise should continuously strive to develop the organizational structure that most effectively and efficiently uses its resources. As enterprises grow and activities become more complex, some division of responsibility is necessary.
In large organizations, one person or a small group simply will not have enough time or sufficient information to make all the decisions. Thus, many medium to large enterprises divide their organizational structure into responsibility centers and place managers in charge of these centers. Then, a responsibility accounting system measures the performance of these managers against their budgets. Responsibility accounting, when properly used in performance evaluation and coupled with an accepted reward system, holds managers accountable for their actions; that is, the activities they manage and the financial factors they control.
To run their responsibility centers effectively and efficiently, managers need information detailing the results of their decisions. To operate successfully, a responsibility accounting system must provide complete and timely feedback that reports on responsibility center performance, either favorable or unfavorable.
RESPONSIBILITY CENTERS
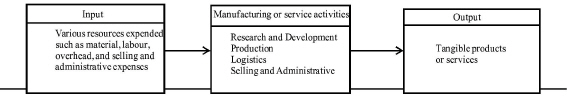
A responsibility center (RC) is a segment of the organization in which a manager is held accountable for a specified set of activities and financial factors, including investment, revenue, and cost decisions. A general model of an RC appears in Exhibit 20-1. Responsibility centers may be created in various ways, but generally the enterprise first divides responsibility by activities. For example:
• Activities related to business functions
• Activities related to products or services
• Activities related to geographic regions
The responsibility accounting system then reports on each RC's financial performance.
|
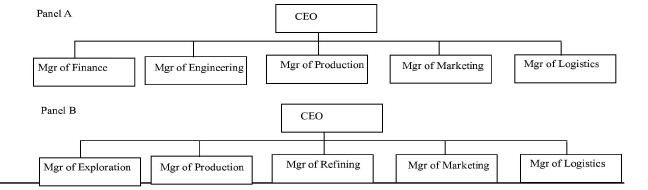
Activities Related to Business Functions
A large number of enterprises divide responsibilities by activities related to business functions. Typical business functions include:
• Finance
• Engineering
• Production
• Marketing
• Logistics
Panel (a) of Exhibit 20-2 presents an organization chart for such an organization, and panel (b) provides a specific example for the business functions of an oil company.
|
LEARNING OBJECTIVE 1
Examine responsibility, centers and state their purpose.
Each manager is responsible for a number of activities related to a particular business function. The chief executive officer (CEO) is responsible for long-range strategic planning and coordinating the activities of all managers. For example, the development of a new product requires coordination among all managers, as described in Chapter 14. Lower-level RCs can also be designated. For example, the manager of logistics may assign a set of responsibilities to a manager of transportation, a manager of warehousing, and so forth. The manager of transportation is responsible for delivering inbound, interfacility, and outbound shipments. The transportation manager is accountable for the delivery of the proper products, on schedule, to the correct destination, and at reasonable cost. At a higher level, the manager of logistics is responsible for coordinating all logistics activities, including transportation.
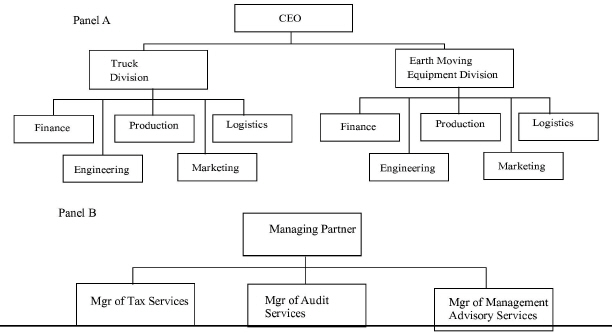
Activities Related to Product Lines or Services
Some organizations set up RCs based on product lines or services. The manager of each product line or service is responsible for all the activities necessary to develop, produce, market, and deliver that product line or service. For example, a manufacturer of trucks and earth-moving equipment would put one manager in charge of trucks and another in charge of the earth-moving equipment, as shown in panel (a) of Exhibit 20-3. The organization chart in panel (b) illustrates the RCs of a public accounting firm.
|
Activities Related to Geographic Regions
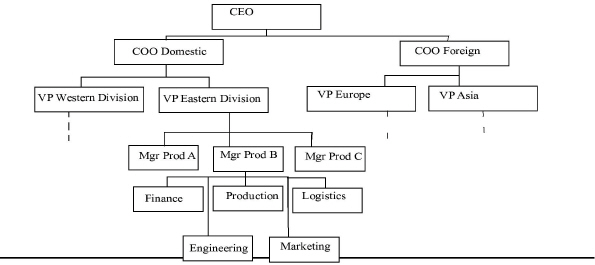
If an organization is dispersed nationally or internationally, RCs may be set up according to geographic regions. For example, an organization may be structured as shown in Exhibit 20-4.
|
In this exhibit, the CEO is responsible for the activities of the organization as a whole, which is his or her RC. The domestic operations and foreign operations are RCs with a chief operating officer (COO) at their helms. Each divisional RC is headed by a vice president. Divisions, in turn, are broken down into lower-level RCs, such as product lines, and then by business function. Alternatively, a division can be broken down into business functions without using product lines as separate RCs Advantages and Disadvantages of Responsibility Centers
In organizations that are divided into RCs, decision-making authority is widely diffused among a number of managers. Managers at levels below top management have authority to make certain major decisions without clearing them first through central headquarters. Creating autonomous RCs is a fundamental tactic in decentralization. Such an arrangement offers both advantages and disadvantages.
THE ADVANTAGES OF DECENTRALIZED RESPONSIBILITY CENTERS. The purported advantages of decentralizing an organization into autonomous RCs include the following:
• Focused decision making. Some enterprises have grown so large that neither top management nor one person can cope efficiently with the volume, breadth, and diversity of the decisions that must be made. Managers of smaller segments possess a better understanding of how the segment operates and what its needs are. Thus, their attention is focused exclusively on the RC to which they are assigned.
• Closer to the action. Because RC managers are closer to the activities and financial factors that they manage, they are on “top of things” and can make more informed decisions.
• Timely decision making. Because RC managers do not have to go through a chain of command to gain approval from top management, they can respond immediately to situations.
• Training ground for managers. Responsibility center managers learn by doing. As they prove their ability to manage smaller segments, they are promoted and given more responsibility.
• Engenders motivation. Being given the responsibility and authority to make their own decisions increases RC managers' incentives to strive for successful outcomes.
• Enhances strategic planning. Because top management is relieved of short-term planning and day-to-day decisions, they can devote more of their time and efforts to long-range strategic planning for the entire enterprise.
• Easier to evaluate managers' performance. Responsibility center managers are given the responsibility and authority to make decisions that will produce certain outcomes. It is, therefore, easier to evaluate them than it is to evaluate managers who have not been assigned well-defined areas of responsibility and authority.
THE DISADVANTAGES OF DECENTRALIZED RESPONSIBILITY CENTERS. The purported disadvantages of RCs include the following:
• Lack of goal congruency. A manager of one RC may make decisions that adversely affect another RC in the organization. The goals of one RC are achieved, but the decision is not congruent with the goals of the organization as a whole. Such dysfunctional decision making can happen in organizations that have highly interdependent RCs.
• Duplication of activities. Dividing an organization into RCs may cause the same activity to be duplicated in each RC. For example, rather than having one information system or accounting department that serves the total organization, each RC may have its own independent LAN. Even worse, a system in one RC may not be compatible with the system in another RC, thus restricting interaction between them.
• Difficulty to compare performance. One reason for decentralizing is that different RCs perform different activities, in different markets, using different resources. Many traditional management accounting systems create upper management reports that directly compare the profitability of divisions without proper regard to whether they are comparable. This “deadly parallel evaluation strategy” can also lead to dysfunctional decisions. For example, would the manager of a McDonald's fast-food restaurant located on the edge of a small town want to be compared against a restaurant located next to a high school or college campus, especially if the managers have no control over the location of their restaurants? If bonuses and profit sharing are based solely on the revenues or profits generated, then the first manager will not compare favorably to the second, even though the first may be doing a better job.
The Role of the Information System in Decentralization
Decentralization requires trade-offs such as the need for LANs to support localized, timely decision making versus centralized information systems to minimize duplication of information processing activities. One of the most serious conflicts from decentralization is the potential sacrifice of goal congruence due to autonomous decision making with RCs. Thus, maximizing employee empowerment and goal congruence become primary goals. So that RCs and their local area networks (LANs) can function cooperatively, an integrated computer-based information system (ICBIS) is needed to link them together. To have decentralized RCs without an ICBIS can actually inhibit effective and efficient local decision making.
A centralized information system is needed to provide divisional information to corporate headquarters. Centralized information about corporate and other RC activities is also needed by RC managers. The ICBIS is more than just a mainframe system with dumb terminals, though. It is an effective combination of PC-based LANs, linked to wide area networks (WANs) (possibly using PCs) and to the corporate headquarter's mainframe.
A modern trend in computer architecture design to support decentralization is downsizing (or “rightsizing”) of the ICBIS. This involves moving away from centralized mainframe systems to client/server networked microcomputers.
|
INSIGHTS & APPLICATIONS Downsizing at Blockbuster Video The interoperable cooperative ICBIS makes optimum use of all resources, assigning the right application to the appropriate level of computer power. Permitting local workstations to prepare transactions and update the database without the use of a mainframe is cost-effective systems design in many companies. Moreover, the PC (or workstation) provides a much friendlier user interface. Interoperable computer architectures enable applications |
to be distributed enterprisewide in an optimal fashion. Such an enterprisewide ICBIS strategy emphasizes decentralized, but cooperative management among all segments of the enterprise. One of Blockbuster's policies is that a movie rented at one store can be returned to any other store. With over 150 outlets, the mainframe video tracking system had to be run every night. Sara Bond, information systems director, downsized the system into a 150-node network of PCs linked through a minicomputer server. Block-buster reported maintenance and support cost savings of approximately $3.2 million annually. Management also claims that productivity has increased from the more accurate and timely tracking of video rentals. |
• Proponents of client/server systems offer many benefits of these system architectures:
• Increased user performance at less cost
• User-friendly interfaces such as graphical displays, no matter where the users are accessing the system (e.g., from another's office, at home, on the RC's shopfloor, or while travelling)
• The ability to distribute centralized information throughout the enterprise so users have real-time access to needed information
• Increased decision-making flexibility at the local levels (where the work is being done)
For example, Eastman Kodak Company's new client/server ICBIS has resulted in a cooperative decision-making synergism, improving morale and strengthening communications while achieving large cost savings. The above Blockbuster Video case exemplifies the trend in downsizing and the distribution of computer resources to end users.
For many applications, the mainframe is still the only workable technology platform. The question is not whether a mainframe or LAN-based architecture is applicable. Rather, it is the dividing line between which applications should be run on a mainframe versus a smaller computer. This dividing line involves the following considerations:
• The size of the application. Some applications require gigabytes of online storage while pulling together data from numerous locations. LANs are not powerful enough to support many large-scale applications.
• The kind of application planned for the system. Some applications use millions of records with complex reporting modules. PCs may not possess fast enough processing speeds to handle such large databases.
• The number of end users. When the number of users enters the thousands, then a mainframe system may be necessary.
Decentralization requires interoperable architectures based on global enterprisewide systems supporting local end user decision making. Such an ICBIS design mirrors the organizational design. A key design tenet is assigning the right applications to the appropriate level and location of computer hardware. For example, mainframes process transactions that have already been edited, validated, and formatted by microcomputers, thereby updating the corporate database. LAN workstations provide a more friendly user interface for data input and queries, as demonstrated in the Simco case.
|
INSIGHTS & APPLICATIONS Interoperability at Simco Manufacturing Simco, a large steel fabricator, has grown, as many multinationals have, by acquiring smaller companies and setting them up as profit centers. Each RC had its own information system, leading to hardware, software, and data redundancies, as well as incompatible and sometimes conflicting information. James Kirby, Simco's CIO, designed an interoperable ICBIS with a centralized |
corporate database with online, real-time (OLRT) end-user access. After about six months of operation, Simco's RC managers favorably evaluated it pointing out that it allowed them access to different kinds of applications and information regardless of their location.The RC managers wanted and got an information system that allowed them to be able to run an application on whatever machine they happened to be at. This linkage provided interconnectivity of all nodes on the network and portability of applications to any node. With the previous system, Simco's LANs focused on isolated divisional needs rather than strategic interoperability with other segments of the company. |
HIERARCHICAL SEGMENTATION FOR PROFIT PERFORMANCE EVALUATION
LEARNING OBJECTIVE 2
Relate responsibility centers and responsibility accounting system design to profit performance evaluation.
Regardless of how RCs are created, the responsibility accounting system must measure the RC manager's success in achieving his or her master budget goals. Not all managers will have responsibility for the same financial factors, though. There are three financial factors:
• Cost
• Profit
• Investment
Some managers will control only costs. Others will control both cost and revenue to produce a profit. A few will be in charge of all three financial factors. A manager of an activity, such as transportation, will normally have responsibility only for certain costs. A product line manager may be assigned responsibility for that line's costs and revenues. A manager of a geographic division usually will be assigned responsibility for cost, revenue, and investment.
The Cost Center
A cost center is any RC where the manager can exert influence over cost but has little, if any, authority to influence revenues or investments in fixed assets. A production department and a maintenance department are good examples of a cost center. A cost center can produce a product or render a service.
Management accountants traditionally have used standard costs and cost variances to evaluate the performance of cost centers. An example of a detailed cost variance report for July's activities in producing Tigerade at Nulife Sports Drink, Inc., was presented in Exhibit 8-12. This case will also be used to develop the responsibility accounting reports for the product line (profit center) manager.
In addition to traditional cost variance reports, the responsibility accounting system should supply cost center managers with nonfinancial information needed for continuous improvement. Traditionally, many accountants and managers believed that the cost center manager was responsible only for monetary inputs (i.e., costs) and that the management accounting system only needed to relate these inputs to outputs. In today's competitive world, this approach is insufficient. An array of performance measurements are available to the management accountant to measure costs and report on how well these costs are being employed (i.e., performance measurements related to activities). A review of Part III, and especially Chapter 11, may be helpful at this point.
In general, the decision to use standard costs and cost variances is made considering the needs of both responsibility accounting and product costing. Traditional responsibility accounting systems using standard costs and flexible budgets have relied on the measurement and analysis of variances as the primary mechanism for performance evaluation.
This sole reliance on cost variance analysis for performance evaluation, especially the emphasis on labor-based measurements, has been the object of growing criticism from both academics and practitioners, however. By measuring and rewarding direct labor efficiency, other important criteria, such as competitive priorities of customer service, quality, lead time reduction, and on-time delivery are often minimized or ignored. Workers attempt to “play the system” by:
• Processing production orders with easily achievable standards ahead of those orders needed to meet delivery schedules
• Overloading the most efficient machines in spite of the availability of less efficient machines that would permit delivery schedules to be met
• Producing excess quantities to spread setup time and absorb fixed overhead
• Overlooking quality problems in order to achieve favorable efficiency variances
As responsibility accounting systems evolve, a variety of financial and nonfinancial performance measurements will be used, as presented in previous chapters. Moreover, standards or targets will be established for groups of interrelated RCs, where quality, lead time, cost, and customer objectives require that those centers behave as a team. Performance credit will be given to all RCs within the group when products are completed through the last RC.
The Profit Center
A profit center is any RC where the manager has the authority and responsibility to make decisions that will affect the costs and revenues of that center. The profit center manager, however, has little, if any, decision-making power concerning investments in fixed assets.
Clearly, the profit center manager needs information regarding costs and revenues. Proper performance evaluation compares the master budget and flexible budget against actual costs and revenues, reporting profit variances. Segmented income statements are output from the management accounting LAN for this purpose. Using the contribution margin format, “mini income statements” (segmented income statements) can be created for each RC. These mini income statements and their profit variance reports will be illustrated in the next major section of this chapter.
The Investment Center
An investment center is any RC where the manager has the authority and responsibility to make decisions that will affect the costs, revenues, and investments of that center. Thus, there is an expected return on investment on the assets deployed in the center. The investment center approach is usually applied to autonomous business units (i.e., divisions) and is rarely used in measuring the performance of internal service activities, such as logistics.
Profit analysis provides an appraisal of costs and revenues only. In an investment center, a third dimension should be evaluated: the amount of capital employed. How effective are the assets being used to generate revenue? Does the return on sales justify the investment? If not, what steps can be taken to correct the unfavorable performance?
To help investment center managers answer these questions and gauge their progress toward meeting their financial goals, management accountants use several financial performance measurements. Two of the most popular measurements are:
• Return on investment (ROI)
• Residual income (RI)
These will also be illustrated later in the chapter.
Levels of Reporting in Responsibility Accounting
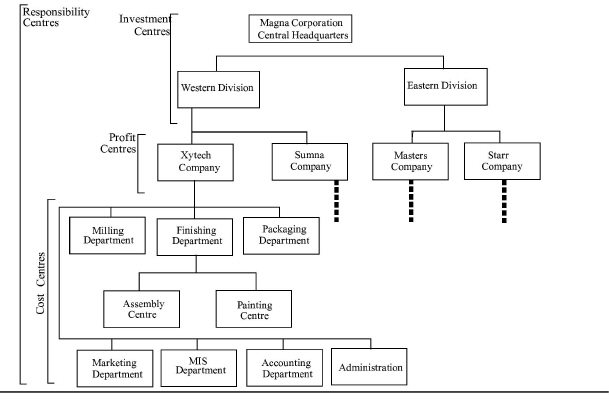
In decentralized organizations, the structure of the RCs may be similar to that of Magna Corporation shown in Exhibit 20-5
|
|
|
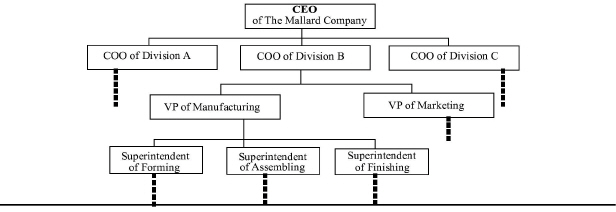
. At the highest level are the investment centers. At the company level are the profit centers. The lowest levels are the cost centers. Another objective of responsibility accounting is to tailor performance reports to their appropriate levels. Part of Mallard Company's organization chart is illustrated in Exhibit 20-6
|
Exhibit 20 -6 Responsibility Centres of Mallard Company |
|
. Only the bold-bordered blocks in the example will be used for illustrative purposes. Exhibit 20-7 illustrates the overhead reports for each RC and the relationship of each report to the next higher echelon of responsibility. Starting with report A at the bottom of Exhibit 20-7
|
D |
Summary of Mallard Company |
|
||
|
|
Overhead ($ 000) |
|
|
|
|
Reporting to CEO |
|
|
|
|
|
Company |
First Quarter |
|
Under <over> budget |
|
|
CEO |
$ 70 |
|
<$ 5> |
|
|
Division A |
460 |
|
30 |
|
|
Division B |
888 |
|
< 8> |
|
|
Division C |
200 |
|
< 22< |
|
|
|
|
|
|
|
|
C |
Division B Overhead ($ 000) |
|
||
|
Division |
First Quarter |
|
Under <over> budget |
|
|
Division B |
$ 40 |
|
$ 5 |
|
|
Manufacturing |
700 |
|
< 33> |
|
|
Marketing |
148 |
|
20 |
|
|
Total |
$ 888 |
|
<$ 8> |
|
|
|
|
|
|
|
|
B |
Manufacturing Overhead ($ 000) |
|
|
|
|
Department |
First Quarter |
|
Under <over> budget |
|
|
VP Manufacturing |
$ 50 |
|
<$ 2> |
|
|
Forming |
200 |
|
< 15> |
|
|
Assembling |
300 |
|
< 6> |
|
|
Finishing |
150 |
|
< 10> |
|
|
Total |
$ 700 |
|
<$ 33> |
|
|
|
|
|
|
|
|
A |
Assembling Overhead ($ 000) |
|
|
|
|
Department |
First Quarter |
|
Under <over> budget |
|
|
Superintendent |
$ 5 |
|
$ 1 |
|
|
Makeup |
150 |
|
8 |
|
|
Welders |
145 |
|
< 15> |
|
|
Total |
$ 300 |
|
<$ 6> |
|
, the Assembling Department superintendent receives a detailed report that discloses the costs of the overhead items within his RC and the amount under or over the budget. Report B provides the vice president of manufacturing with performance figures for her RC, including the Forming, Assembling, and Finishing Departments within manufacturing. Report C provides the chief operating officer (COO) of Division B with performance figures for this division and summary figures for the manufacturing and marketing departments within Division B. Report D provides the CEO at company headquarters with summary figures for the three divisions that comprise the Mallard Company. Variances from budget can be traced downward through the organization as needed to show where management can control costs.
The Importance of Controllability in Responsibility Accounting
No matter what RC level is being evaluated, responsibility accounting is effective only when the RC manager being evaluated has internalized a sense of ownership, autonomy, and controllability. In order to ensure this, activities and financial factors deemed to be uncontrollable for a particular manager should be excluded when evaluating this person's performance. However, it is important to recognize that costs that are not controllable at a certain level are controllable elsewhere in the enterprise. For example, while the head of a department may have influence over the amount of space her area consumes, it is unlikely that she will have control over her own salary and benefits. In a responsibility accounting system, attention is directed toward managers and how much money they are spending to perform their activities. Successful operation of a responsibility accounting system therefore rests on two assumptions:
• Spending is subject to control.
• Responsibility for spending can be directly traced to a specific manager.
In practice, these assumptions contain some degree of subjectivity. As part of the strategic planning and master budgeting process, there must be consensus and agreement about who is responsible for budgeting and controlling each of the enterprise's activities. Explicit recognition of the responsibility assumptions is a prerequisite for a high-quality responsibility accounting system.
Indeed, the ability to control spending is not an absolute, but rather a matter of degree driven by:
• Level of authority
• Time
This does not mean that some spending is clearly controllable and other spending is definitely uncontrollable, but that all spending is controllable at some level of authority at some point in time. The manager of a production department may not control the expenditures for machines or the insurance for the machines in her department, but her manufacturing superintendent may. In summary, if a manager's decision can substantially influence the amount of spending, then the spending is assumed to be controllable by that manager.
Some companies report all profit center costs within segmented income statements and profit variance reports, even though some of the costs are not directly controllable by the managers. This approach is a violation of effective responsibility accounting, and creates ethical concerns in the areas of competency, integrity, and objectivity.
The rationale behind reporting uncontrollable costs is that it makes managers aware of the total costs of their activities. For example, even though an enterprise may be highly decentralized, some support services may be centralized at corporate headquarters. Often, ICBIS and accounting services, human resources departments, and some advertising activities are performed for the divisions. By allocating the costs of these corporate services to the divisions, using service department allocation techniques (Chapter 9) and activity-based costing techniques (Chapter 10), the divisional managers will be more aware of the costs and, consequently, so upper management believes, will not use these services wastefully or abuse them.
The modern management accountant must be very careful in allocating common corporate costs to the divisions. Not only do divisional managers seldom have control over the costs of these services, but if actual costs are allocated to the divisions, the corporate service center managers will have little incentive to control these costs. As Chapter 9 illustrated, traditional actual cost allocation systems, designed primarily for financial accounting purposes, can destroy the legitimacy of the responsibility accounting system.
Divisional managers may only have control over how much of a service they use. Consistent with the techniques described in Chapter 9, then, service department costs should be allocated using a budgeted rate for the variable costs and budgeted lump-sum allocations for the fixed costs. This will allow proper variance reporting in accordance with the controllability axiom. If a policy decision is made to include noncontrollable costs, such costs should be categorized separately in responsibility reports to emphasize that they are not considered controllable at that level.
Is There One Prescribed Way to Create Responsibility Centers?
Organization structures are too varied to permit generalization, as is readily apparent from the preceding description of the different ways to create RCs. Enterprises differ so widely in their goals, operations, philosophies, and personnel that no single form of organization structure and RCs will work for all of them. All RCs, however, require the following:
• Clear-cut lines of responsibility must be drawn.
• Responsibility must be coupled with commensurate authority.
Fuzzy lines of responsibility will bring only bickering and buck-passing. But giving RC managers responsibility for something they have no authority to control is even worse. Thus, to make the RC idea work, managers must be given clear responsibilities and sufficient authority to meet those responsibilities.
SEGMENTED INCOME STATEMENTS AND PROFIT CENTER PERFORMANCE EVALUATION
LEARNING OBJECTIVE 3
Segment the profit center's income statement for segment and manager performance evaluation.
In evaluating a profit center's financial performance, the management accounting system has two basic goals:
• To report on the profitability of the segment
• To report on the performance of the segment manager
First, this section will present two formats for the segmented income statement. Then, reporting for each of the two goals will be examined. Finally, the usefulness of segmented income statements in the decision to continue or drop a product line will be addressed.
Functional Form and Contribution Margin-Based Income Statements
For financial reporting, the income statement organizes costs by their functions (product costs versus operating expenses). This format also employs absorption costing in that fixed overhead is absorbed into the product cost. When segmenting an income statement, using the absorption costing principle, indirect costs (common fixed costs across all profit centers) are allocated to (absorbed by) the profit centers, as presented in the Nulife case.
As Exhibit 20-8 shows, Nulife has been allocated $30,000 in common corporate costs.1 Of this amount, $18,000 was allocated to Tigerade and $12,000 was allocated to Lions Crunch. The controller explained to Karen that these allocations are for corporate services provided to the profit centers, such as centralized accounting and human resources department costs.
|
INSIGHTS & APPLICATIONS Nulife Sport Drink, Inc. This case is a continuation of the case used in Chapter 8 to illustrate cost variance reporting. Nulife has segmented itself by product line. Tigerade sports drink is one of Nulife's profit centers. The manager of this segment, J. B. Fuller, has just introduced a new related product line, Lions Crunch health bars. Both products are considered to be within this profit center.In attempting to establish Lions Crunch, Nulife has |
marketed it in two regions, the East Coast and the West Coast. J. B. Fuller has just received his July income statement, segmented by product line. This is presented in Exhibit 20-8. Obviously, he is concerned about the poor reported performance of Lions Crunch, and he has asked the new management accountant, Karen Rosenau, to analyze it and report back to him. After consulting with the corporate controller, Karen believes the company is using good absorption costing techniques for financial reporting purposes. However, she also believes that reformatting the income statement based on a contribution margin approach, as illustrated in chapters 18 and 19, can provide more useful information for evaluating the real profitability of Lions Crunch. |
Upon further investigation, Karen discovered that Nulife uses a very common allocation method. These actual costs are allocated based on the relative sales revenues of each product. Tigerade, generating $360,000 of Nulife's $600,000 total revenues (which is 60 percent), was allocated 60 percent of the common corporate costs. Lions Crunch generated 40 percent of Nulife's revenues ($240,000) and was allocated 40 percent of the $30,000. This allocation method has been justified by an “ability to bear” philosophy. The more revenues a product creates, the greater its ability to absorb (“bear”) the common fixed costs.
Karen is suspicious of this technique, though, when it is used in evaluating product profitability and profit center manager performance. As she explained to J. B., if sales revenues of one product go down, then the allocation of common fixed costs will also go down, making the product look more profitable. Allocations to the other products will then increase, making them look worse, even though there may not have been any real change in their profitability.
To illustrate this to J. B., Karen prepared the analysis following Exhibit 20-8. Assume that Tigerade revenues drop $100,000 to $260,000.
|
|
Tigerade |
Lions Crunch |
Nulife Totals |
|
Revenues |
$360,000 |
$240,000 |
$600,000 |
|
Less cost of goods sold: Variable manufacturing costs |
225,250 |
60,000 |
285,250 |
|
Fixed manufacturing costs |
12,100 |
25,000 |
37,100 |
|
Total production costs |
<237,350> |
<85,000> |
<322,350> |
|
Gross profit |
$122,650 |
$155,000 |
$277,650 |
|
Less selling and administrative expenses: Variable selling costs |
44,750 |
80,000 |
124,750 |
|
Fixed selling and administrative costs |
47,900 |
65,000 |
112,900 |
|
Allocated corporate costs |
18,000 |
12,000 |
30,000 |
|
Total selling and administrative costs |
<110,650> |
<157,000> |
<267,650> |
|
Net income |
$ 12,000 |
<$ 2,000> |
$ 10,000 |
|
|
Tigerade |
Lions Crunch |
Nulife totals |
|
New sales revenues |
$260,000 |
$240,000 |
$500,000 |
|
New relative sales revenue ratios |
52% |
48% |
100% |
|
New allocation of common corporate costs |
$15,600 |
$14,400 |
$30,000 |
|
Change in allocation of common corporate costs |
<$2,400> |
+$2,400 |
-0- |
Because Tigerade revenues decreased, the allocated common costs went down for Tigerade. In effect, this makes Tigerade appear more profitable than it is. Tigerade's variable cost ratio is 75 percent (($225,250 + $44,750) - $360,000) and its CM ratio is 25 percent. If Tigerade revenues go down by $100,000, then its contribution margin and net income drop $25,000 (CVP rules 4 and 1, respectively, Exhibit 18-3). The decrease in Tigerade profits of $25,000 is partially masked by the $2,400 reduction in allocated common corporate costs.
Meanwhile, there was no real change in the sales, costs, or profits of Lions Crunch. But, because Tigerade revenues went down, Lions Crunch is now allocated another $2,400 in common corporate costs. This makes Lions Crunch's profit performance look worse, when there should be no difference.
With respect to J. B.'s performance evaluation, she argued that the allocated common corporate “overhead” should not be included in evaluating a manager's performance. J. B. Fuller has no control over the costs of these corporate services, especially the actual costs. They should also not be considered in evaluating the segment's real profit contribution to covering overall corporate costs and generating profits.
J. B. Fuller was perplexed. He has no control over the costs of the common corporate services, nor is he allowed to outsource these services if he can obtain them cheaper from another supplier, or perform them within his profit center if he can do it cheaper than corporate headquarters. Karen agreed. Both in measuring the real profitability of the products and in evaluating J. B. Fuller's performance, these common fixed costs should not be included. To determine the real profitability of the products, Karen created a worksheet in a spreadsheet program to segment the income statement by product line, using a contribution margin approach that separates the allocated common fixed corporate costs from the direct costs of each product line. This format is displayed in Exhibit 20-9.
The only difference in the product net incomes between the two income statement formats is that allocated common fixed costs are included under the functional form, absorption costing-based income statement in Exhibit 20-8, whereas under the contribution margin-based approach, the common fixed costs are reported separately just in the totals column. The functional form, absorption costing-based income statement allocates all costs to all product lines. The contribution margin-based income statement format organizes costs by behavior and separates the common fixed costs from the direct fixed costs of the segments.
Evaluating Profit Center Profitability
Karen believes that by separating the common fixed costs from the direct fixed costs, a better measure of the true profitability of the product lines results.
|
|
Tigeradea |
Lions Crunch |
Nulife Totals |
|||||
|
|
Per unitb |
Percent |
Totals |
Per unit |
Percent |
Totals |
Percent |
Totals |
|
Revenues |
$40 |
100% |
$360,000 |
$24 |
100% |
$240,000 |
100% |
$600,000 |
|
Less variable costs: Variable manufacturing costs |
25 |
63% |
225,250 |
6 |
25% |
60,000 |
47% |
285,250 |
|
Variable selling costs |
5 |
12% |
44,750 |
8 |
33% |
80,000 |
21% |
124,750 |
|
Total variable costs |
<30> |
<75%> |
<270,000> |
<14> |
<58%> |
<140,000> |
<68%> |
<410,000> |
|
Contribution margin |
$10 |
25% |
$ 90,000 |
$10 |
42% |
$100,000 |
32% |
$190,000 |
|
Less direct fixed costs: Fixed manufacturing costs |
|
12,100 |
|
|
25,000 |
|
37,100 |
|
|
Fixed selling and administrative costs |
|
|
47,900 |
|
|
65,000 |
|
112,900 |
|
Total fixed costs |
|
|
<60,000> |
|
|
<90,000> |
|
<150,000> |
|
Segment margin |
|
|
$ 30,000 |
|
|
$ 10,000 |
|
$ 40,000 |
|
Less common fixed costs |
|
|
|
|
|
|
|
<30,000> |
|
Net income |
|
|
|
|
|
|
|
$ 10,000 |
|
aSales volume for Tigerade = 9,000 cases; sales volume for Lions Crunch = 10,000 cases. bThe per unit and percent columns are calculated by working backwards from the totals column. For example, the $225,250 total variable manufacturing costs for Tigerade (from Exhibit 8-12) divided by 9,000 cases = $25.0278 per case. Dividing $225,250 by Tigerade revenues of $360,000 = 62.5694% for the percent column. The per unit and percent columns are formatted to the nearest whole dollar and percentage for clarity in presentation. |
THE USEFULNESS OF SEGMENT MARGINS. The “direct” profit generated by each product line is measured in its segment margin. In Exhibit 20-9, J. B. Fuller sees that each product creates positive profits for use in covering the common fixed costs of Nulife and in generating overall corporate profits. In other words, Tigerade contributed $30,000 in direct profits and Lions Crunch contributed another $10,000.
J. B. found this format more useful because it reports each product's contribution margin for use in short-run decisions (illustrated in Chapters 18 and 19), as well as each product's segment margin for use in evaluating the profitability of those segments.
SUBSEGMENTING PRODUCT LINES INTO GEOGRAPHIC TERRITORIES. J. B. Fuller is also interested in the profitability of the two sales territories where Lions Crunch has been test marketed. So, he asked Karen to use her spreadsheet program to create a Lions Crunch income statement segmented by East Coast and West Coast. Exhibit 20-10 presents her report.
Karen explained to J. B. how she prepared her report. First, the Lions Crunch income statement in Exhibit 20-9 is the same as in the Lions Crunch Totals column of Exhibit 20-10. Lions Crunch direct fixed selling and administrative costs (Exhibit 20-9) were $65,000 in July. Of this amount, $50,000 represented selling expenses directly traceable to each sales territory ($10,000 on the East Coast and $40,000 on the West Coast).
The remaining $15,000 (of the $65,000 total) represented common administrative costs of Lions Crunch. Both regions are serviced by a single manufacturing plant, so its $25,000 in FOH is also common to the territories. Therefore, neither of these amounts is included in the regional segment margins. Instead, these costs are separately reported only in the Totals column for Lions Crunch (Exhibit 20-10). To summarize, of the $90,000 in direct fixed costs of Lions Crunch, $50,000 is directly traceable to each region and $40,000 is common to them.
|
|
East Coasta |
West Coast |
Lions Crunch |
|||||
|
|
Per unitb |
% |
Totals |
Per unit |
% |
Totals |
% |
Totals |
|
Revenues |
$24 |
100% |
$96,000 |
$24 |
100% |
$144,000 |
100% |
$240,000 |
|
Less variable costs: Variable manufacturing costs |
6 |
25% |
24,000 |
6 |
25% |
36,000 |
25% |
60,000 |
|
Variable selling costs |
5 |
21% |
20,000 |
10 |
42% |
60,000 |
33% |
80,000 |
|
Total variable costs |
<11> |
<46%> |
<44,000> |
<16> |
<67%> |
<96,000> |
<58%> |
<140,000> |
|
Contribution margin |
$13 |
54% |
$52,000 |
$ 8 |
33% |
$ 48,000 |
42% |
$100,000 |
|
Less direct fixed selling costs |
|
|
<10,000> |
|
|
<40,000> |
|
<50,000> |
|
Segment margin |
|
|
$42,000 |
|
|
$ 8,000 |
|
$ 50,000 |
|
Less common fixed costs: Fixed manufacturing costs |
|
|
|
|
|
25,000 |
||
|
Fixed administrative costs |
|
|
|
|
|
|
|
15,000 |
|
Total fixed costs |
|
|
|
|
|
|
|
<40,000> |
|
Net income |
|
|
|
|
|
|
|
$ 10,000 |
|
aSales volume for East Coast = 4,000 cases; sales volume for West Coast = 6,000 cases. bSee note b in Exhibit 20-9 concerning calculations of per unit and percentage amounts. |
J. B. Fuller now has a better picture for evaluating the profitability of each region. While both contributed positively, the East Coast significantly outperformed the West Coast. This was expected, J. B. explained to Karen. Attempting to penetrate the very competitive West Coast was expensive. Variable selling expenses (coupons, higher commissions to retail jobbers) were twice as high as on the East Coast. This caused a lower CMU and CM ratio for the West Coast. Furthermore, fixed advertising costs were four times greater than on the East Coast. One bit of good news, though, was that West Coast sales actually were higher than the East Coast.
Evaluating Profit Center Manager Performance
J. B. Fuller then returned to his analysis of Tigerade and Lions Crunch (Exhibit 20-9). “Well, I guess I should give those two accounting interns you suggested I hire to manage each product line a bonus. It looks like the Tigerade intern should get three times the bonus of the Lions Crunch intern, though.”
Karen interrupted with a warning, “The segment margins may not be the best performance measure for evaluating a manager. Some of the direct fixed costs of a segment may not really be controllable by the segment manager. For example, if a division provides its segments with administrative services, including accounting, ICBIS, and/or advertising, then these costs should be separated from the direct fixed costs that the segment managers can control.”
J. B. responded, “O.K., they had control over their production, distribution, and sales. So these costs should be controllable direct costs of the product lines2. But wait a minute, the interns have no control over their own salaries. I control that. So keep the salaries within the calculations of the segment margins, but separate them from the controllable direct fixed costs.”
THE USEFULNESS OF CONTROLLABLE SEGMENT MARGINS. Karen modified her spreadsheet program by separating the direct fixed costs of each product line ($60,000 and $90,000 in Exhibit 20-9) into those that were controllable by the managers and those that were not. Her new report is shown in Exhibit 20-11. The fixed selling expenses within each product were separated from the salaries of the accounting interns (that were journalized and posted to individual product line administrative expense accounts within the accounting system). Karen created a new subtotal, controllable segment margin. This can be used to evaluate the profit created from the activities under the control of the managers. Controllable segment margin includes only those activities for which the manager has decision-making responsibilities.
J. B. Fuller was impressed. “Based on this report, I think I should only give twice the bonus to the Tigerade intern. His decisions generated $50,000 toward covering common fixed costs and creating profits, while the Lions Crunch intern generated only $25,000 in controllable segment margin.”
Again Karen interrupted with a warning. “The segments may not be directly comparable. We have to guard against falling into the 'deadly parallel evaluation strategy' without first comparing their performance against their budgets. For example, using the controllable segment margins that actually resulted does not take into consideration differences between the two segments that are reflected in their budgets.
“We should not just automatically compare the actual results of each segment, nor should we compare only the actual performance of a segment against its previous year. Although this has been a common practice at Nulife, there is no guarantee that this year is comparable to last year. A number of strategic and environmental factors could make the actual results of one year completely different from the actual results of another year.
|
|
Tigeradea |
Lions Crunch |
Nulife Totals |
|||||
|
|
Per unitb |
% |
Totals |
Per unit |
% |
Totals |
% |
Totals |
|
Revenues |
$40 |
100% |
$360,000 |
$24 |
100% |
$240,000 |
100% |
$600,000 |
|
Less variable costs: Variable manufacturing costs |
25 |
63% |
225,250 |
6 |
25% |
60,000 |
47% |
285,250 |
|
Variable selling costs |
5 |
12% |
44,750 |
8 |
33% |
80,000 |
21% |
124,750 |
|
Total variable costs |
<30> |
<75%> |
<270,000> |
<14> |
<58%> |
<140,000> |
<68%> |
<410,000> |
|
Contribution margin |
$10 |
25% |
$ 90,000 |
$10 |
42% |
$100,000 |
32% |
$190,000 |
|
Less controllable direct fixed costs: Fixed manufacturing costs |
|
|
12,100 |
|
|
25,000 |
|
37,100 |
|
Fixed selling costs |
|
|
27,900 |
|
|
50,000 |
|
77,900 |
|
Total controllable direct fixed costs |
|
|
<40,000> |
|
|
<75,000> |
|
< 115,000> |
|
Controllable segment margin |
|
|
$ 50,000 |
|
|
$ 25,000 |
|
$ 75,000 |
|
Less uncontrollable direct fixed costs: Fixed administrative costs |
|
|
<20,000> |
|
|
<15,000> |
|
<35,000> |
|
Segment margin |
|
|
$ 30,000 |
|
|
$ 10,000 |
|
$40,000 |
|
Less common fixed costs |
|
|
|
|
|
|
|
<30,000> |
|
Net income |
|
|
|
|
|
|
|
$ 10,000 |
|
aSales volume for Tigerade = 9,000 cases; sales volume for Lions Crunch = 10,000 cases. bSee note b in Exhibit 20-9 concerning calculations of per unit and percentage amounts. |
For example, remember the manager of our gourmet health food product line at last year's bonus meeting? He argued that this line's profitability had increased substantially over the previous year and that he should receive a substantial bonus. However, the corporate controller pointed out that in the previous year, the manager's actual profits were below that year's master budget. Further, the difference between his actual and budgeted profits last year was even worse than in the previous year!
|
|
Master Budget (Volume = 10,000) |
Sales Volume Variance |
Flexible Budget (Volume = 9,000) |
Actual Profit Totals |
Flexible Budget Variances |
|||
|
|
Per unit |
Totals |
|
Per unit |
Totals |
|
|
|
|
|
|
(a) |
(b - a) |
|
(b) |
(c) |
(d)* |
|
|
Revenues |
$35 |
$350,000 |
|
$35 |
$315,000 |
$360,000 |
$45,000 |
F |
|
Less variable costs: Variable manufacturing costs |
26 |
260,000 |
|
26 |
234,000 |
225,250 |
8,750 |
F |
|
Variable selling costs |
5 |
50,000 |
|
5 |
45,000 |
44,750 |
250 |
F |
|
Total variable costs |
<31> |
<310,000> |
|
<31> |
<279,000> |
<270,000> |
9,000 |
F |
|
Contribution margin |
$ 4 |
$ 40,000 |
<$4,000> U |
$ 4 |
$36,000 |
$90,000 |
$54,000 |
F |
|
Less controllable direct fixed costs: Fixed manufacturing costs |
|
12,000 |
|
|
12,000 |
12,100 |
<100> U |
|
|
Fixed selling costs |
|
28,000 |
|
|
28,000 |
27,900 |
100 |
F |
|
Total controllable direct fixed costs |
|
<40,000> |
|
|
<40,000> |
<40,000> |
-0- |
|
|
Controllable segment margin |
|
$ -0- |
<$4,000> U |
|
<$4,000> |
$ 50,000 |
$54,000 |
F |
|
|
|
|
|
|
|
|
|
|
While year-to-year comparisons are important in measuring long-run continuous improvement, these comparisons should be between the annual budgets of the segment. Annual budget-to-budget comparisons are important for moving toward world-class status. Budget-to-actual comparisons for a particular time period (such as July or the year) are just as important, though, in measuring short-run operating performance.” Karen prepared a spreadsheet program to compare July's budgeted and actual performance for each product line manager. Only the Tigerade report is illustrated in Exhibit 20-12.
PROFIT VARIANCE ANALYSIS. Karen's report includes only those activities that are controllable by the segment manager. In other words, the income statement ends with controllable segment margin. She felt this was important
|
Exhibit 20 -13 Detailed Tigerade Profit Variance Report |
|||
|
|
Spending |
Usage |
Totals |
|
Sales variances: Sales volume variance |
|
|
<$ 4,000>% |
|
Sales price variance |
|
|
45,000 |
|
Total sales variances |
|
|
$41,000 |
|
Selling and administrative expenses variances: Variable costs |
$ 250 |
|
250 |
|
Fixed costs |
100 |
|
100 |
|
Total S & A variances |
$ 350 |
|
$ 350 |
|
Production costs variances: Direct materials |
<4,000> |
<$3,000> |
<7,000> |
|
Direct labor |
8,750 |
5,000 |
13,750 |
|
Variable overhead |
1,250 |
750 |
2,000 |
|
Fixed overhead |
<100> |
n/a |
< 100> |
|
Total production variances |
$5,900 |
$2,750 |
$ 8,650 |
|
Variance totals |
|
|
$50,000 |
|
|
|
|
|
Note: Favorable variances are positive amounts, unfavorable variances are negative amounts.
Tigerade monthly controllable segment margin = (CMU x Volume) - Controllable direct fixed costs
For the master budget sales quota of 10,000 cases of Tigerade:
Tigerade monthly controllable segment margin = ($4 per case x 10,000 cases) - $40,000= $0
For the actual sales volume of 9,000 cases, the flexible budget profit is:
Tigerade monthly controllable segment margin = ($4 per case x 9,000 cases) - $40,000 = <$4,000>
Because the sales volume variance explains the difference between planned and actual profits due to selling a different volume than budgeted, it is shown between the master budget and the flexible budget in Exhibit 20-12. It is also reported as the first sales variance in Exhibit 20-13.
The flexible budget variances (the last column in Exhibit 20-12) are the differences between the flexible budget amounts and the actual results. Actual sales revenues were $45,000 greater than budgeted for this volume (9,000 cases). This is due to the actual sales price being higher than the budgeted sales price. The difference between planned and actual profits due to a difference in budgeted and actual sales prices is captured in the sales price variance:
Sales price variance = Actual sales volume X (Actual sales price - Budgeted sales price)
= 9,000 cases X ($40 per case - $35 per case)
= $45,000 favorable
In interpreting this variance to J. B. Fuller, Karen explained that if sales price increases $5 per unit, then CMU will increase $5. For 9,000 cases, contribution margin and profits will then increase $45,000 over budget.
After explaining the sales variances, Karen moved to the selling and administrative expenses variances. She calculated spending variances by just subtracting the actual costs from the flexible budget costs. Although the variances were favorable in July, they were insignificant, representing only 0.5 percent of the flexible budget amounts [$350 - ($45,000 + $28,000)]. She then concluded with the production cost variances. These are summarized in the last section of Exhibit 20-13. Their detailed calculations, in total dollars, per unit, and as a percentage of standard, are presented in Exhibit 8-12.
J. B. Fuller had only one more question. “Why wasn't the FOH volume variance reported in either Exhibit 20-12 or 20-13?” This was a little hard for Karen to explain, so she began with the following calculations:
FOH volume variance = FOH standard cost X (Actual volume - Budgeted volume)
= $1.20 per case X (9,000 cases - 10,000 cases)
= <$1,200> unfavorable
Other fixed costs volume variance = Other fixed standard costs X (Actual volume - Budgeted volume)
= $2.80 per case X (9,000 cases - 10,000 cases)
= <$2,800> unfavorable
From Tigerade's standard cost card (Exhibit 8-11), the sales price needs to be marked up $1.20 (the FOH standard cost) above variable costs to provide sufficient contribution margin to pay for the total FOH. This assumes that 10,000 cases of Tigerade will be sold. Also assuming 10,000 cases of sales volume, the sales price will have to be marked up another $2.80 ($28,000 / 10,000 cases) to cover the other fixed selling and administrative costs. In total, Tigerade's sales price needs to be $4.00 higher than its variable cost. In other words, it has to generate a $4.00 CMU to cover fixed costs and target profit (which was budgeted at zero) if 10,000 cases are sold.
But 10,000 cases were not sold. The lost contribution margin from lower actual sales is captured in the sales volume variance. The $4.00 CMU used in the formula includes $1.20 for FOH and $2.80 for other fixed costs. Therefore, the FOH volume variance is already included in the sales volume variance. This is why Karen reported it as not applicable (n/a) in Exhibit 20-13.
J.B. now understood the need for profit variance analysis when evaluating managers' performance. Before he could decide on bonuses, he asked Karen to prepare a similar analysis for Lions Crunch.
LEARNING OBJECTIVE 4
Identify the relevant profit elements for the add-or-drop decision, and describe how' product life cycle analysis and the growth/share matrix are used.
The Add-or-Drop Decision
The add-or-drop decision deals with whether to add, drop, or continue a particular product, line of products, enterprise segment, or service. Both qualitative and quantitative factors must be considered when making such decisions. Ultimately, however, any decision to add or drop a product, product line, department, or territory is going to center on the impact the decision will have on overall enterprise profits.
CONSIDERING QUALITATIVE FACTORS. The decision to add or drop a product, product line, segment, or service is often complicated by various marketing considerations. Many enterprises believe they are obligated to carry a range of sizes, colors, styles, flavors, or related items. These marketing factors can outweigh persuasive quantitative data to the contrary.
Often certain products are sold at a loss (based on full costs) in order to attract customers. For example, a shoe store may sell socks at $1 a pair to attract customers to the store in the hope of selling shoes at regular price. In some enterprises, these “loss leaders” are considered an integral part of marketing strategy. These qualitative issues represent legitimate factors that management accountants must consider.
CONSIDERING QUANTITATIVE FACTORS. If the question involves dropping a product, service, or segment, then only the fixed costs that can be avoided by dropping the item are subtracted from that item's contribution margin. If the result is positive, then the item should be kept (or added) because this amount increases the profits of the enterprise. The Computerworld case on the next page demonstrates this analysis.
Direct fixed costs are directly traceable to each product line, but they may or may not be avoided if the product line is dropped. All or part of these costs may be sunk costs that will continue even if the product line is dropped. Indeed, this is the situation at Computerworld because a large portion of the direct fixed costs for office supplies is depreciation on display racks and cases. Moreover, managers of the office supplies product line will be kept on the payroll even if the product line is dropped, although some employees who specialize in office supplies will be discharged. In Computerworld's case, the $16,000 in direct fixed costs is composed of the following items (in thousands):
|
Cost Item |
Avoidable |
Unavoidable |
|
Depreciation of display racks and cases |
|
$ 7 |
|
Salaries of managers |
|
4 |
|
Salaries of discharged employees |
$5 |
|
|
Total direct fixed costs |
$ 5 |
$11 |
The common fixed costs of $18,000 cannot be avoided by dropping the office supplies product line, because they are composed of store rent and general management salaries that will continue even if office supplies are dropped. .
|
INSIGHTS & APPLICATIONS Computerworld's Product Line Cost Analysis Computerworld is a small retail chain that sells personal computers, peripherals such as printers, software packages, and office supplies. Management of Computerworld is concerned about the loss in the office supplies line as reported on the functional form, absorption costing-based income statement used for financial reporting. |
Common fixed costs of $18,000 were allocated to it, resulting in a reported loss of $4,000.' Several managers have recommended that to improve the company's overall net manage-income, office supplies must be dropped. The management accountant for Computerworld explained that the decision rests on what costs can be avoided to offset the loss in contribution margin if the office supplies product line is dropped. She went on to tell them that both direct fixed costs and common fixed costs must be considered. Data (in thousands of dollars) on these four product lines for the past month are as follows: |
The company originally expected that some of the common fixed administrative costs could be avoided, such as reducing the accounting staff, but upon further investigation, this does not appear likely. Therefore, the common fixed costs are unavoidable regardless of the decision with respect to office supplies.
If Computerworld drops the office supplies product line, the company's overall net income will decrease by $25,000 each month. Computerworld will lose $30,000 in contribution margin and only avoid (save) $5,000 in direct fixed costs
|
|
PCs |
Peripherals |
Software packages |
Office supplies |
Totals |
|
Sales |
$800 |
$200 |
$400 |
$300 |
$1,700 |
|
Variable costs |
<500> |
<100> |
<250> |
<270> |
<1,120> |
|
Contribution margin |
300 |
100 |
150 |
30 |
580 |
|
Direct fixed costs |
<150> |
<40> |
<70> |
<16> |
<276> |
|
Segment margin |
$150 |
$ 60 |
$ 80 |
$ 14 |
$ 304 |
|
|
|
|
|
|
|
SUPPLEMENTARY METHODS USED IN THE ADD-OR-DROP DECISION. Two supplementary methods are available that can help in making the add-or-drop decision:
• Product life cycle analysis
• Growth/share matrix
Using Product Life Cycle Analysis
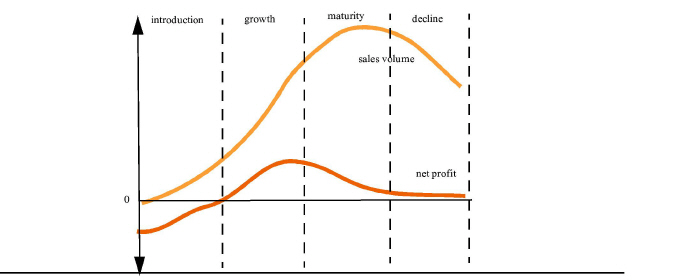
Product life cycle analysis is a useful aid to managers who must determine how to allocate scarce resources to products or product lines in a manner that will maximize enterprise profitability. 3 A graph of sales volume and net profit at various stages of the product life cycle is presented in Exhibit 20-14.
|
Managers can use the product life cycle graph to monitor product profitability and to drop products when they become unprofitable. In the maturity and decline stages, it is important to determine if other products will contribute more per dollar of cost. At some point during the decline stage, management may decide to hasten the product's decline so that cash can be generated to support products that will sustain the enterprise's profitability in the long run4. A good example is Intel's efforts in 2005 to supplant its less profitable 386 microprocessor with the 486 chip, although the 386 was nowhere near the end of its life cycle. In 2008, Intel introduced the Pentium, to replace the 486 microprocessor. There are many examples of this in recent business history.
Using the Growth/Share Matrix
The growth/share matrix is based on the following assumptions
• Cash flow is a measure of business success.
• Cash use is a function of market growth.
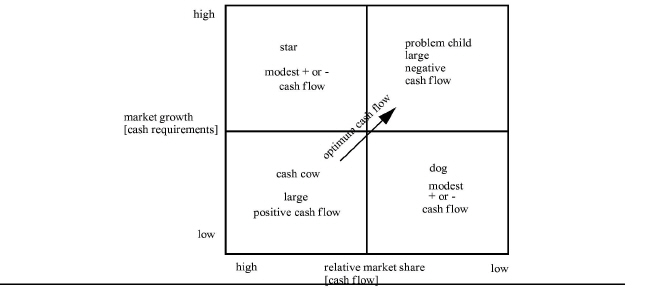
• Cash generation is a function of the product's market share. The result is a growth/share matrix like the one illustrated in Exhibit 20-15. Each quadrant describes a different type of product with fundamentally different cash flow positions and specific characteristics. Each type of product requires a specific management strategy:
• Cash cows. Because of their high market share, these products generate more cash than is required by the low-growth market in which they operate. These products provide the main source of cash and earnings to the enterprise and can be used to fund other developing products, such as in the Lotus example on the next page. The arrow in Exhibit 20-15 demonstrates how proceeds from cash cows are used to support problem children.
• Stars. These products generate a large gross cash flow, but most of the cash is used to support their high growth rate. As growth slows, stars become cash cows. These products represent the future of the company.
• Problem children. These products generate little cash because of their low market share. At the same time, they require large amounts of cash to support their high growth rate. The company must decide whether to try to achieve a high market share for these products by turning them into stars and ultimately cash cows or to drop them altogether.
• Dogs. These products neither generate nor require much cash. Because of their low market share and low growth, dogs offer little opportunity for future profits. Generally, the most effective decision is to drop these products.
Preparing product profitability reports that show cash flows is one method that is used to validate the positioning of products on the growth/share matrix. The management accountant plays a significant role in this process.:
|
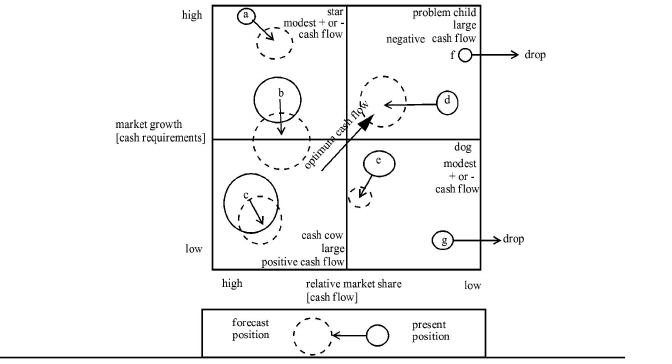
The growth/share matrix can also be expanded to show both the present and future positions of each product as determined by product life cycle analysis and the marketing strategy of the enterprise. For example, Exhibit 20-16 highlights the following strategies for products A through G:
• Aggressively support newly introduced product A to ensure dominance
• Continue present strategies for products B and C to ensure maintenance of market share
• Gain share of market for product D by investing in acquisitions
• Narrow and modify the range of models of product E to focus on one segment
• Drop products F and G5
Segmented Income Statements and Performance Evaluation in Summary
In summary, a high-quality profit management system will include the separation of direct from common fixed costs in segmenting profit center income statements. Subtracting the direct fixed costs from a segment's contribution margin creates a new subtotal called “segment margin.” The segment margin is a useful measure of segment profitability.
|
However, the segment margin cannot be used in deciding whether to continue or discontinue the segment. Consideration has to be given to the avoidable costs involved in this decision. Not all direct fixed costs are avoidable. Some of the fixed assets, and the depreciation expense they create, may continue to be used. If so, then these future costs are not different between the alternatives to continue or discontinue the segment. If they are not differential costs, then they are not relevant to this decision6. Analogously, if some of the people currently employed within this segment will be reassigned (instead of terminated), then their labor costs are not relevant to this decision.
|
INSIGHTS & APPLICATIONS Taking Care of the Cash Cow By the mid-1090s Lotus Development Corporation had pumped over $100 million into a groupware product called Notes, which is designed to improve communication among users. by 1995 Lotus had not made much of a return on its Notes investment. Key employees have left, unconvinced that the company's future lies with Notes rather than its cash cow, the Lotus 1-2-3 spreadsheet. At that time Lotus 1-2-3 generated two-thirds of the company's revenue. |
Lotus was totally dependent on 1-2-3 profits to fund research and development for other products. But today, Lotus Notes® is hailed as a breakthrough product that allowed people to access, track, share, and organize information throughout the enterprise. It is now owned by IBM and is a premier bib business product. Lotus managers said the company shifted toward Notes realizing it couldn't maintain growth in a mature, competitive spreadsheet market. Now, of course Lotus 1 2 3 does not exist, however it is an iconic product that migrated through the different phases described in this chapter. |
Consideration should also be given to whether any common fixed costs will change if a segment is dropped. Sometimes corporate support services can be downsized if less services are now needed. These cost savings become relevant to this decision. Finally, in making the add-or-drop decision, supplemental analyses such as the product life cycle graph and the growth/share matrix may be helpful.
When evaluating the performance of a segment manager, the direct fixed costs within a segment need to be broken down into those that are controllable and those that are uncontrollable. The subtotal controllable segment margin that results from subtracting only the controllable direct fixed costs from the segment's contribution margin is useful for evaluating the performance of the profit center manager. However, proper performance evaluation requires the comparison of actual results against the master budget. Therefore, profit variances need to be calculated and reported to those responsible for them. Exhibit 20-17 summarizes the steps in preparing and using segmented income statements.
|
To prepare the segmented income statement: 1. Identify the allocation of common fixed costs and remove it from the segment. 2. Using only the direct fixed costs of a segment, calculate its segment margin. 3. Break down the direct fixed costs into controllable direct fixed costs versus uncontrollable direct fixed costs. 4. Using only the controllable direct fixed costs, calculate a new subtotal called the controllable segment margin. |
|
Using the segmented income statement in decision making: 1. Use the segment margin to measure segment profitability. 2. To evaluate the performance of the segment manager, use the controllable segment margin. This should be compared against the master budget, with profit variances reported. 3. When making a decision about adding or dropping segments: a. Adjust the segment margin by changing the direct fixed costs to the avoidable direct fixed costs. The result is the segment margin lost by dropping the segment. b. Prepare graphical analyses such as the growth/share matrix and the product life cycle graph. |
EVALUATING INVESTMENT CENTER PROFITABILITY
LEARNING OBJECTIVE 5
Calculate profit performance measures for investment center managers.
Investment center managers are also responsible for profit management. Thus, segmented income statements are the first step in evaluating the profitability of investment centers and their managers. At this level of an enterprise's management hierarchy, however, asset investment responsibilities should be included in the analysis. Two commonly used financial measures of asset profitability are:
• Return on investment (ROI)
• Residual income (RI)
Return on Investment
Return on investment (ROI) (also called return on assets) is comparable to an interest rate on a savings account. If one dollar is invested in a savings account for one year and earns six cents in interest, then this account's simple interest rate is 6 percent. The return earned on this one-dollar investment is 6 percent.
A very common technique in reporting profits is to calculate profits as a percentage of sales. Many profit center managers relate to sayings such as, “My profit margin last month was 15 percent.” In other words, each dollar of sales returned 15 cents in net income. Investment center managers, concerned with asset investments, relate to returns (profits) measured against assets instead of sales revenues. ROI is computed as follows:
ROI = (Investment center net income) / (Investment center assets)
For the one-dollar savings account's interest rate calculation:
ROI = $0.06 per year / $1.00 = 6%
While ROI is a useful measure of the rate of return on investments, it can provide even more meaningful information if it is decomposed into its two component ratios. Profit margin is income divided by sales revenues. It is a short-term measure of operating efficiency, evaluating how much profit is generated from a dollar of sales. Asset turnover ratio is revenues divided by assets. It is a longer-term measure of the effectiveness of asset usage. This ratio provides a measure of how effective a dollar investment is in creating sales revenues. When multiplied together, these two ratios yield ROI:
|
|
Profit margin |
|
Asset turnover |
|
|
Investment center net income |
x |
Investment center sales |
|
ROI = |
Investment center sales |
|
Investment center assets |
Notice that the investment center's total sales revenue is the denominator of the first ratio and the numerator of the second. Mathematically, the two ratios can be reduced to ROI. From a performance evaluation perspective, though, each component ratio provides important information. The profit margin focuses on the rate of earnings generated by each sales dollar. Asset turnover focuses on the use of assets and indicates the rate at which sales are being generated for each dollar invested.
This decomposition also focuses attention on how investment center managers can improve their ROI:
• By increasing sales
• By reducing costs
• By reducing assets
For example, Exhibit 20-18 reports the ROIs for the two Magna Corporation investment centers previously illustrated in Exhibit 20-5. Although the Eastern and Western Divisions have the same profit margins, the Eastern Division's asset turnover is larger than the Western Division's (1.25 times compared to 0.80 times). In interpreting these ratios to upper management, the management accountant would explain that each dollar invested in the Eastern Division generates $1.25 in sales revenues and each dollar of sales contributes $0.20 in profits. For the Western Division, each dollar invested generates only $0.80 in sales, although this division also yields $0.20 in profits from each dollar of sales. Obviously, the Eastern Division uses its assets more effectively, resulting in an ROI of 25 percent compared to the Western Division's ROI of 16 percent.
These ratios help focus managerial attention on the areas where ROI can be improved. Should the investment center manager look first to the income statement for operating improvements? An actual profit margin below the master budget profit margin signals this investigation. Should the manager look instead to the balance sheet for areas to improve in asset management? A lower than budget asset turnover ratio signals this course of action. Areas of investigation are summarized in Exhibit 20-19. To improve profits on sales, the manager might investigate whether the sales prices for products are set too low. Maybe the sales mix contained too many products with low CM ratios. If there are no problems with sales price and mix, the managers should investigate costs and cost variances.
|
R0I = Profit margin x Asset turnover |
|
|
|
|
(Net income / Sales) x (Sales / Assets) |
|||
|
|
$100,000 |
x |
$500,000 |
|
Eastern Division ROI = |
$500,000 |
$400,000 |
|
|
|
= 20% X 1.25 times |
||
|
|
= 25% |
|
|
|
|
|
|
|
|
|
$140,000 |
x |
$700,000 |
|
Western Division ROI = |
$700,000 |
$875,000 |
|
|
|
= 20% X 0.80 times |
||
|
|
= 16% |
|
|
In investigating asset turnover, is actual sales volume less than budgeted? If actual sales volume is not the cause of a low ROI, maybe the investment in assets, both in mix and amount, should be rethought. For example, accounts receivable collections may be improved, lowering the average balance owed the division. Similarly, investments in inventories (RMI, WIP, and FGI) might be reduced as part of a program moving toward JIT production and delivery.
WHAT SHOULD BE INCLUDED IN NET INCOME? In designing a high-quality responsibility accounting system, the management accountant must consider which items to include in the segment's ROI calculations. For example, the net income figure used could be the absorption costing-based segment profit, segment margin, segment margin before taxes and interest, or controllable segment margin. The most appropriate figure for evaluating the performance of the manager would include only the revenues and costs over which he or she has control. For example, taxes would not be included unless the manager is responsible for tax planning. Costs allocated from corporate headquarters would also be omitted.
|
Exhibit 20 -19 Areas to Investigate When ROI is Less Than Budgeted |
|
|
Profit Margin lower than expected? |
Asset Turnover Ratio lower than expected? |
|
Sales price variance' |
Sales price variances |
|
Sales volume variance' |
Sales volume variances |
|
Manufacturing cost variances |
Inventory turnover ratio |
|
Selling and administrative expenses cost variances |
Accounts receivable turnover ratio |
|
CM ratio and sales mix' |
Current (or quick) ratio |
|
|
•Age of fixed assets and depreciation methods used |
|
a. Sales variances affect both the denominator of profit margin and the numerator of the asset turnover ratio. b. For multiple product divisions, a CM ratio below budget may be due to a problem with sales mix. |
|
WHICH ASSETS SHOULD BE INCLUDED IN THE BASE? Possible alternatives to consider in selecting the base are total assets, total active or employed assets, total assets minus current liabilities, total assets minus total liabilities, fixed assets, or some combination or modification of these. As a general rule, the asset base should include those asset and liability accounts over which the manager has control and responsibility.
For example, if the manager has responsibility for the incurrence and payment of current liabilities and for managing other items that make up working capital, then total assets less current liabilities may provide the most suitable base. A manager who does not have any control over incurrence and payment of creditors would want to exclude all liabilities from the base and use total assets instead. For another example, if a manager has no control over accounts receivable, it should not be included in the asset base.
Consideration should also be given to the purpose of the segment's assets. To illustrate, maybe a building is vacant and is being held for future expansion. Should the building be included in the asset base, the investment center manager might be motivated to sell it to reduce the ROT denominator. No earnings would be lost, and the investment center's ROI would increase. Thus, excluding idle assets from the asset base deters such potentially dysfunctional behavior. Of course, if there are no plans for the idle building, the proper decision might be to sell it.
Another factor to consider is whether the asset base should consist of the beginning balance, ending balance, or an average of the assets for the time period. Use of either the beginning or ending balance may encourage managers to adjust the asset base at year-end. Moreover, this approach does not consider changes in assets during the period due to cyclical or seasonal fluctuations. Consequently, the asset base should represent a monthly or quarterly average. In more stable situations, a simple average may be sufficient (i.e., the asset base at the beginning of the period plus the asset base at the end of the period divided by two).
HOW TO VALUE ASSETS IN THE BASE. What dollar value should be assigned to assets? Three common choices are:
• Gross book value
• Net book value
• Current value
Gross book value and net book value are popular choices because these figures are easily obtained from the financial accounting database. However, neither gross book value nor net book value is completely satisfactory. The problem arises in comparing investment centers (such as the Eastern and Western Divisions in Exhibit 20-18). If one division is comprised of old assets with a lower gross book value and greater accumulated depreciation, then its ROI will be higher than a newer division with a large investment in assets and little accumulated depreciation. The older division's ROI will also be greater than the newer division's simply because there is less depreciation expense (so the numerator, net income, will be higher) and a lower gross or net investment (so the denominator will be lower).
To partially overcome this problem, current asset costs may be used in calculating ROI. The current value (also called replacement cost) is the amount required to replace the segment's assets. Using current cost is an attractive way to value assets because it represents an enterprise's investment in an investment center at the time the ROT is calculated. Current value is not widely used, however, because it is difficult to determine and is subject to dispute.
IS ROI A VALID PERFORMANCE MEASUREMENT? There is a need to rethink the way managers use summary financial performance measurements such as ROI to evaluate investment centers. If ROI is used, it should be used in conjunction with other financial and nonfinancial performance measurements. Otherwise, a fixation on improving the elements of one performance measurement while neglecting other activities can hurt the enterprise in both the short run and the long run.
Used alone, ROI can produce distorted information. For example, managers who retain older, mostly depreciated assets report much higher ROIs than managers who invest in new assets. Managers who are evaluated this way may not be inclined to invest in assets that would make the company more competitive.
ROI-based measurements enable executives to generate greater profits from financial activities than from managing their assets better. Although a full explanation of financial activities is beyond the scope of this text, these activities include the following:
• Financial accounting procedures, such as depreciation methods (e.g., straight-line versus declining-balance method) and inventory costing procedures (e.g., LIFO versus FIFO). Choosing a particular method based solely on its effect on net income is “cooking the books.” Management accountants can be placed in an ethical dilemma if they are instructed to use particular methods because of an investment center manager's desire to manipulate segment margin.
• Mergers and acquisitions
• Divestitures and spin-offs
• Debt swaps and discounted debt repurchases
• Sale-leaseback arrangements
• Leveraged buyouts
It is difficult to imagine that a focus on creating wealth through the rearrangement of ownership claims, rather than through managing tangible and intangible assets more effectively, will help enterprises survive as world-class competitors. The final and most damaging problem with ROI-based measures is the incentive they give managers to reduce expenditures on intangible investments, such as research and development, quality improvement, human resources, and customer relations. To reduce expenditures in these areas immediately improves ROI, but the long-term effect of such reductions may be disastrous7.
Of course, these problems can be avoided if the primary evaluation criteria are not based on comparisons between divisions (a deadly parallel evaluation) or on year-to-year actual profit comparisons within a segment. Proper performance evaluation should foremost be based on a comparison of budgeted performance against actual. One of the most important roles for the modern management accountant is in changing the traditional mentality that emphasizes comparing past and present performance. This mentality has led to the questioning of ROI as a valid performance metric. It has also led to the development of another financial measure, residual income.
Residual Income
Residual income (RI) is the net operating income that an investment center earns above some minimum rate of return on assets. For example, return to Exhibit 20-18 and assume that top management at Magna Corporation uses its average ROI of 15 percent as the minimum rate of return on Eastern and Western Division assets. The residual incomes for both divisions are calculated in Exhibit 20-20. Stated as a formula, residual income is: 1
RI = Net operating income - (Asset base X Minimum rate of return)
There are a number of choices for the minimum rate of return. Some companies use the weighted-average cost of capital, the overall corporate average ROI, or the incremental borrowing rate (interest rate) for the invested assets. Thus, it is often viewed as an imputed charge for the use of corporate funds for the assets of the segment. The minimum rate of return can also be changed from period to period consistent with market rate fluctuations or to adjust for risk.
|
|
Eastern Division |
Western Division |
|
Net operating income |
$100,000 |
$140,000 |
|
Less minimum rate of return: $400,000 X 15% |
<60,000> |
|
|
$875,000 X 15% |
|
<131,250> |
|
Residual income |
$ 40,000 $ |
8,750 |
The major advantage of RI as a performance measurement is that it gives consideration not only to a minimum rate of return on investment in assets, but also to the absolute size of the earnings generated by each division. Moreover, traditional management accounting theory argues that being measured by RI motivates managers to make profitable investments that would otherwise be rejected by managers evaluated with ROI.
To demonstrate this, suppose the manager of the Eastern Division has an opportunity to make an investment that will produce a ROI of 17 percent. The manager would probably reject the investment because she is already earning a rate of return of 25 percent. Because her performance is being measured by ROI, she will not be motivated to reduce her current rate of return. If Magna Corporation's average ROI is less than 17 percent, then rejecting this 17 percent ROI investment is a lost opportunity that would have benefited the total enterprise.
On the other hand, if the manager's performance is evaluated using RI, she will choose the investment because this will increase her RI.8 Thus, goal congruency is more likely to be achieved by using RI rather than ROI as an investment center performance measurement. However, this traditional theory is based on some questionable assumptions. As an illustration, consider the information in Exhibit 20-21.
Which Measure Better Motivates the Investment Center Manager?
Traditional theory argues that the Eastern Division manager will not wish to undertake this project in 2005 because her 2005 ROI will be lower than her division's 2004 ROI. The corporation wants this project, however, as 2005 corporate average ROI will increase (over 2004). Thus, the use of ROI to evaluate performance motivates the manager to make the opposite decision than corporate headquarters desires.
If the manager is evaluated with RI, she will want the project, congruent with corporate desires. The RI decision rule is to accept projects with a positive RI. Since this project's projected ROI is greater than the corporate average, it yields a positive RI.
|
Magna Corporation's Eastern Division |
|
|
Eastern Division Roi, 2004 |
25% |
|
Projected Roi On Investment Project For 2005 |
17% |
|
Corporate Average Roi, 2004 |
15% |
|
Investment Required In Project |
$1,000,000 |
|
Residual Income Calculation: income From Project ($1,000,000 X 17%) |
$170,000 |
|
Less Minimum Required By Magna ($1,000,000 X 15%) |
<$150,000> |
|
Residual Income (Investment X (Project Roi - Corporate Average Roi |
$ 20,000 |
|
1. Assume corporate headquarters will only support projects that will increase its overall average ROI. Thus, 15% is used as the “hurdle rate” in RI calculations. 2. A different version of the RI formula when the corporate average ROI is used as the RI hurdle rate is: Investment center assets x (Investment center ROI - Corporate average ROI) |
|
IMPLICIT ASSUMPTIONS SUPPORTING ROI OVER RI. Underlying this traditional argument are two implicit assumptions. One assumption is that the manager's performance is evaluated by comparing past and present ROIs. According to this assumption, the manager is motivated to reject the project out of fear that accepting it will lead to a lower 2005 ROI, as compared to the 2004 ROI, and thus to a “bad” evaluation.
Although there may be some descriptive validity to the assumption that current performance is compared against past performance, the modern management accountant should caution Magna management against assuming this method is optimal or even correct. Normatively, performance should be evaluated by comparing actual to planned (budgeted) performance. Cost center managers should be evaluated with cost variances, which compare standard costs against actual costs. Profit center managers should be evaluated by comparing pro forma income statements to actual income. Investment center managers should be evaluated by comparing budgeted and actual ROI (or RI).
If this is the best project the Eastern Division manager can find, she will budget a lower ROI for 2005 than the division obtained in 2004. Then, if the project's projected ROI is realized, a positive performance evaluation should result. In this case, the use of ROI or RI will not have any differential effect on the manager's planning decisions. Thus, it cannot be claimed (inferred) that RI is better than ROI in motivating investment center planning decisions.
The second assumption is that managers do not “see through” the accounting numbers in identifying an investment's effect on corporate profitability and ROI, and that they will not make investment decisions in the corporation's best interests. In other words, managers at this level are more motivated to improve their segment ROI than to improve the corporation's ROI.
Based upon common sense, this behavior should not be expected. Managers who have reached this level of the organization see through the accounting conventions used to evaluate performance and are highly motivated to make decisions in the best interests of the corporation. Thus, concern that a manager will not accept the 17 percent project if evaluated with ROI, but will accept it if evaluated with RI, has no basis if the manager is highly motivated to make corporate goal-congruent decisions. Again, the claim that RI leads to better planning (capital budgeting) decisions is not supported.
ALTERNATIVE BEHAVIORAL ASSUMPTIONS. Assume investment center managers are highly motivated to make goal-congruent decisions regardless of the accounting numbers used in their performance evaluations. Does it make any difference whether ROI or RI is used? According to one argument, practically attainable standards should be budgeted and used in evaluating cost center managers because these managers are not highly enough motivated to respond to ideal standards. At the investment center manager level, though, ideal standards are more consistent with their high levels of motivation. This argument may lead to the conclusion that ROI is better than RI because it is the tougher standard. For example, returning to Exhibit 20-2 1, the tougher standard would be to tell the manager to search for projects that beat her ROI rather than projects that generate positive RI.
Assume the organization wants an accounting measure of performance that supports the manager's motivation to search for the best projects possible. RI is not consistent with this goal as it provides a minimum hurdle rate. It is easier for the manager to find an investment project that clears the 15 percent RI hurdle than to search for projects that can improve her existing 25 percent ROI.
Before concluding that ROI is a better evaluation technique than RI, though, consider the situation presented in Exhibit 20-22. In this situation, the Western Division's ROI is less than the corporate average. Here, the tougher standard is RI. ROI is not consistent with the goal of supporting the manager's search for the best project because he could accept this 12 percent project, which would increase his ROI but lower the corporate average.
The corporation's goal in choosing an accounting technique for performance evaluation is to use the method that best supports a manager's search for the most profitable investment projects, whether or not the manager shares this motivation. If the divisional ROI is above the corporate average, then ROI is the tougher (ideal) standard. If, conversely, the divisional ROI is lower than the corporate average, then RI becomes the tougher standard. Thus, neither ROI nor RI is optimal. Choosing the method most consistent with corporate goals requires a comparison of divisional ROI to the corporate average.
Assuming that managers at this level of the organization are highly and intrinsically motivated, the following “warnings” are offered in conclusion:
• While financial measures of performance will always be important, they should not be the sole measures used in evaluating investment center managers. Some of the nonfinancial measures presented in Part III of this text are at least equally important at this level of the organization.
• Investments are long-run decisions. The use of short-run financial measures such as ROI and RI may inappropriately focus attention on the immediate payoffs (effects on first- and second-year profits) rather than long-run continuous improvements. The discounted cash flow and capital budgeting techniques described in Part V of this text may be more relevant planning, control, and evaluation measures than ROI and RI.
When choosing short-run financial measures, be careful not to choose a method that can demotivate the managers. ROI may be a better evaluation metric for divisions with ROIs greater than the corporate average. RI, on the other hand, may be better for divisions with ROIs less than the corporate average.
In their movement toward world-class status, some companies are reengineering their organizations. Along with this, their responsibility accounting systems are measuring financial and nonfinancial activities. The Kyocera Corporation example illustrates one such attempt.
|
Magna Corporation's Western Division |
|
|
Western Division ROI, 2004 |
10% |
|
Projected ROT on investment project for 2005 |
12% |
|
Corporate average ROI, 2004 |
15% |
|
Investment required in project |
$1,000,000 |
|
Residual income calculation: Income from project ($1,000,000 X 12%) |
$120,000 |
|
Less minimum required by Magna ($1,000,000 X 15%) |
<$150,000> |
|
Residual income [Investment X (Project ROI - Corporate average ROI)] |
<$ 30,000> |
THE AMOEBA SYSTEM: A SPECIFIC KIND OF ORGANIZATIONAL SEGMENTATION
LEARNING OBJECTIVE 6
Discuss Kyocera's amoeba system and new organizational structures in American firms.
Kyocera Corporation is a Japanese manufacturing company that produces sophisticated ceramic materials, semiconductors, electronic equipment, optical precision instruments, and cameras. One secret of Kyocera's success is its profit management program. Kyocera instills a thorough profit management attitude in every employee. This management system is called the amoeba system.9
Features of the Amoeba System
Kyocera's smallest units are called “amoebas” because each performs similarly to the simple microorganism. An amoeba is a single cell, flexible in shape, that multiplies by cell division. Kyocera's “amoeba” is similarly flexible regarding work quantities. When it has a large amount of work or many kinds of tasks, it divides into smaller units. It moves from one section of the factory to another, breaking itself down when necessary. If factory work decreases, members of the amoeba join other amoebas or other nonfactory areas such as marketing or engineering.
The Kyocera amoeba is similar to a profit center in that it bears profit responsibility. To increase profits, amoebas use their own discretion when tackling cost reduction problems. Kyocera's amoeba system is a result of pursuing the merits of being small and simple. Generally, the smaller and simpler a unit, the more efficient and effective it is.
An amoeba is usually composed of 3 to 50 members. In the production area, the amoebas are divided according to each process of the production line. In marketing, they are assigned to each section of a particular product according to region.
Kyocera has some 400 amoebas, each controlled by a supervisory division. There are about 50 divisions controlled by a division headquarters. Exhibit 20-23 illustrates Kyocera's organizational structure.

|
How Amoebas Multiply, Disband, and Form New Units
Amoebas divide and break up in response to changes in the following:
• Output
• Worker's added value per hour
The following examples illustrate how an amoeba responds to typical situations:
• When output is low and the added value per labor hour is high, the amoeba must multiply. When the amoeba is too big, its mobility decreases, and it no longer has the advantages of being small and simple. The amoeba will then be divided or reduced in scale.
• When both output and added value per labor hour are high, the amoeba remains as it is.
• When output is high and the added value per labor hour is low, the amoeba must scale down its members or rearrange its organization. If this is still ineffective, the amoeba must disband.
• When both output and the added value per labor hour are low, the amoeba would be disbanded. This situation, however, has never happened at Kyocera.
Amoeba division is an everyday occurrence at Kyocera. When needed, a new amoeba is formed instantly. Under these conditions, neither age nor training is essential to become the head of an amoeba. What matters is the individual's ability to handle the job. If judged unsuitable, a head is replaced immediately. Also, the head does not necessarily make a higher wage than other amoeba members.
Transferring Products between Amoebas
At Kyocera, an amoeba adopts an independent profit system, even though it is small in scale. Satisfactory transfer prices (discussed in the next chapter) must be determined because they influence the performance of the amoebas. A transfer price is what a supply amoeba charges a buying amoeba for its product.
A number of amoebas produce the same or similar intermediate products (i.e., products that can be sold to external customers as is or used as a raw material by another amoeba to produce another product). The amoebas may trade the intermediate products that they produce among themselves at their discretion. Prices charged to the buying amoebas (i.e., the transfer price), quantity, delivery dates, and other conditions are negotiated by the amoebas involved. While one amoeba searches among the others for one to supply its needs most advantageously, other amoebas are doing the same. Amoebas are always on the lookout for a better buyer for their intermediate products.
The competition among amoebas is indeed keen. Each amoeba and its members strive to cut costs and improve the quality of their products. This internal competition is often sharper than Kyocera's competition with other companies. A buyer amoeba rejects any supplier amoeba's products that are even slightly higher in price or slightly lower in quality than it requires. Delivery delays are out of the question. This practice introduces external market conditions into the company's internal production system.
This environment of severe competition and negotiation achieves the following goals:
• Encourages amoeba members to produce better quality and lower cost products
• Makes amoeba members aware of the importance of sound profit management
• Teaches amoeba members about real market conditions
Amoebas are authorized to trade intermediate products with outside companies. When conditions (e.g., price, quality, and delivery) offered by supplying amoebas are unreasonable, the buying amoeba will search for a satisfactory external vendor. This means that amoeba members must be well informed not only about other amoebas' activities, but also about the external markets.
Evaluating Performance of Amoebas
Performance evaluation is viewed as a motivating tool to stimulate competition among the amoebas. It also indicates when to divide or disband an amoeba or form a new one. One important performance measure is added value per labor hour, illustrated in Exhibit 20-24.
The value added per labor hour is $64. This performance measurement is calculated daily, and the results officially announced. The results of the performance evaluations are used to improve future performance. Results are carefully reviewed, and policies for improving performance are discussed and decided.
I Downsizing and Outsourcing: An Amoeba System in Disguise
The trend in many American firms is downsizing, which involves moving away from hierarchical, vertically integrated enterprises toward leaner, more flexible organizations that outsource many activities and add temporary employees for specific activities and projects. Firms that do this are often called modular corporations. The process of adding temporary employees because of downsizing and outsourcing is similar to forming and disbanding amoebas.
|
Exhibit 20 -24 Added Value per Hour Calculated for an Amoeba |
|
|
The following data apply to Amoeba A: |
|
|
|
|
|
|
Total shipment = $100,000 |
|
|
Purchasing costs from other amoebas = $8,000 |
|
|
Purchasing costs from external vendors = $10,000 |
|
|
Total labor hours = 1,000 |
|
|
Amount paid to marketing = $12,000 |
|
|
Amount paid to general administration = $6,000 |
|
Step 1. Total output = Total shipment - Purchasing costs from other amoebas = $100,000 - $8,000 = $92,000 |
|
|
Step 2. Deduction of sales = Total output - (Purchasing costs from external vendors + Marketing costs + General administrative costs) = $92,000 - ($10,000 + $12,000 + $6,000) = $64,000 |
|
|
Step 3. Added value per labor hour = Deduction of sales/ Total labor hours = $64,000 / 1,000 DLhr = $64/DLhr |
|
SUMMARY OF LEARNING OBJECTIVES
The major goals of this chapter were to enable you to achieve six learning objectives:
Learning objective 1. Examine responsibility centers and state their purpose.
Responsibility centers are segments of an organization with a manager in charge of specified activities and certain financial factors. The purpose of RCs is to streamline decision making throughout the total enterprise. The manager is closely in tune with his or her RC and can therefore make more informed decisions. Also, by making decisions locally, time is not wasted waiting for decisions from corporate management. Thus, the creation of independent profit and investment centers often is part of a decentralization strategy.
Profit centers can be created by segmenting an organization along the lines of its business functions, product lines or services, and/or geographic regions. Often the responsibility accounting system will report on each segment in total, with subsidiary reports by subsegments within the responsibility center. For example, a profit center may be created for each major product line, with subsegmentation into individual products and then into regions for each product.
Delegating profit and investment responsibility to segments can create a number of competitive advantages, including more focused and timely decision making, improved managerial training, and increased motivation due in part to profit performance evaluations. The downside to RCs is that dysfunctional decisions may result if segment profitability is the primary measure for performance evaluation, and inappropriate segmentation techniques are used by the management accountant. Also, some services may be duplicated, increasing their total costs to the enterprise. Finally, upper management may be tempted to evaluate managers by comparing their results against each other, even though the characteristics of each segment are different.
The ICBIS plays an important role in minimizing the inherent conflicts between decentralized operations and the need for goal congruence. Many enterprises are down-sizing their ICBISs, by developing client/server systems through networking. These interoperable architectures attempt to optimize the mix of applications and hardware to meet the information needs of both corporate headquarters and local end users.
Learning objective 2. Relate responsibility centers and responsibility accounting system design to profit performance evaluation.
There are three financial factors:
• Cost
• Profit
• Investment
Thus, any RC, whether it is divided by business function, product or service line, or geographic region, can be further defined in terms of the financial factors for which the manager is responsible. A cost center manager is accountable only for costs. A profit center manager is accountable for costs and revenues. An investment center manager is accountable for costs, revenues, and investments.
In measuring financial performance, cost center managers are evaluated in terms of meeting standard costs. Profit center managers are evaluated by means of segmented income statements. Investment center managers are evaluated by return on investment (ROI) and residual income (RI).
Learning objective 3. Segment the profit center's income statement for segment and manager performance evaluation.
In evaluating the profitability of a profit center, a mini income statement should be created for it. Absorption costing techniques are not appropriate for this because they allocate all corporate “overhead” to the segments. Whether a segment continues or is discontinued will usually have no effect on these costs. Thus, they are not relevant to the calculation of the profits generated by the segment, which the enterprise can use to cover its common costs and to generate a profit goal for the overall organization.
A high-quality responsibility accounting system will use a contribution margin approach when preparing the segment's income statement. Fixed costs should be separated into those that are direct fixed costs of the segment and those that are common to the segments (e.g., corporate overhead costs). Only the direct fixed costs should be subtracted from the segment's contribution margin. The resulting profit measure is called the segment margin. It provides a valid measure of the segment's contribution to the corporation.
In evaluating the performance of the segment manager, the direct fixed costs should be subdivided into controllable and uncontrollable. Subtracting the controllable direct fixed costs from the segment's contribution margin yields a controllable segment margin for use in evaluating the manager's performance. The elements making up the controllable segment margin should then be compared against the master budget. Profit variances provide valuable information in assessing whether the manager achieved his or her profit goals.
Learning objective 4. Identify the relevant profit elements for the add-or-drop decision, and describe how product life cycle analysis and the growth/ share matrix are used.
Generally, as long as a profit center generates a positive segment margin, it is contributing to covering some of the common fixed costs of the enterprise. For example, a family shoe store sells men's, women's, and children's shoes. The men's shoe department reports the following data:
|
Sales |
$150,000 |
|
Less variable costs |
<100,000> |
|
Contribution margin |
50,000 |
|
Less direct fixed costs |
<60,000> |
|
Segment margin |
<$ 10,000> |
Although it might seem that overall profits would increase by $10,000 if men's shoes were dropped, this assumes that the $60,000 in direct fixed costs will disappear if this segment disappears. In other words, the management accountant must ask which of the direct fixed costs are avoidable (will disappear) if the segment is discontinued. Only the avoidable direct fixed costs should be subtracted from the contribution margin in calculating the segment margin lost from discontinuing this product line. In this case, if all of the direct fixed costs, such as the manager's salary, insurance, rent, utilities, display cabinets, and so forth, are not avoidable, the men's department should be continued.
|
INSIGHTS & APPLICATIONS Beware of Cost Allocations Chicken Delight, a producer of packaged Chicken Nuggets, purchased a machine to perform the packaging function. The machine, however, came in only one type and size. Chicken Delight ran the machine about two hours a day, which was enough to package all Chicken Nuggets. The machine stood idle for the other 22 hours. All the depreciation costs of the machine were assigned to Chicken Nuggets, and this product made a substantial profit. |
Then, Chicken Delight developed a new product called Chicken Crispies, which would not compete with Chicken Nuggets and could be packaged by the same machine.But when the cost accountant allocated part of the machine costs to the new product, it showed a loss. Consequently, management turned Chicken Crispies down, because the company had a policy that, “Any new product must generate a 30 percent profit.” Chicken Delight's total profit would have increased had it produced the new product. Nevertheless, the company rejected it. Such is the danger of cost allocations. |
Moreover, typically both quantitative and qualitative factors must be considered. For example, if the men's shoe department is discontinued, families that previously came to the shoe store for a complete line of shoes may go elsewhere.
The point of the above Chicken Delight example is that many costs are not avoidable, especially indirect costs that need to be allocated in order to be included in a product's cost. The management accountant must identify both the direct costs and the avoidable costs associated with an add-or-drop decision.
Product life cycle analysis helps management determine when a product or product line is ready for discontinuance. The growth/share matrix provides management with a perspective on which products should be supported and which ones should be dropped. Both can provide supplemental nonfinancial information that aids in the add-or-drop decision.
Learning objective 5. Calculate profit performance measures for investment center managers.
The return on investment (ROI) formula is widely used for evaluating the performance of an investment center because it summarizes, in one amount, many aspects of an investment center manager's responsibilities. ROI is calculated as the product of two ratios:
|
|
|
Profit margin |
|
Asset turnover |
|
|
= |
Investment center net income |
x |
Investment center sales |
|
ROI |
Investment center sales |
Investment center assets |
Profit margin provides information about the operational control decisions of the segment. It captures what has happened on the segment's income statement. Asset turnover measures how effectively the segment's assets are being used in generating sales. It relates balance sheet elements under the control of the manager to the sales it created by those assets.
When evaluating an investment center, the management accountant must decide which assets to include in the asset base and how they will be valued. For example, should assets over which the investment center manager has little control be included? Once included, should the assets be valued at gross book value, net book value, or current value? Should idle assets be included? Should liabilities be subtracted? How these questions are answered can affect the behavior of the investment center manager.
As an alternative to ROI, some organizations use residual income (RI) to measure investment center performance. RI is calculated as follows:
RI = Net operating income - (Asset base x Minimum rate of return)
Instead of providing a profit measure in terms of a rate (percentage), RI provides an absolute dollar amount above the minimum required by corporate headquarters. Traditionally, it has been argued that RI is better than ROI at motivating an investment center manager to make goal-congruent investment decisions. This argument, though, is based upon some questionable assumptions. Both ROI and RI can be effectively used to motivate investment center managers. At this level of the organization, however, both financial and nonfinancial performance measurements should be considered in properly evaluating managerial performance.
Learning objective 6. Discuss Kyocera's amoeba system and new organizational structures in American firms.
To make its operations more efficient and effective, Kyocera analyzed the strengths and weaknesses of conventional management systems, such as those using cost and profit RCs, and then developed an amoeba system. Kyocera also developed a performance evaluation method providing added value per labor hour. This performance evaluation method encourages amoebas to compete with one another, thereby reducing total costs of the entire enterprise. The successful application of the amoeba system has helped Kyocera enjoy a reputation as a very profitable company that produces high-quality products. Many American firms are downsizing (sometimes called “rightsizing”) and hiring temporary employees. This approach is similar to an amoeba system.
IMPORTANT TERMS
Add-or-drop decision A decision that deals with whether to add, drop, or continue a particular product, line of products, enterprise segment, or service.
Amoeba system A responsibility system in which segments of an enterprise are divided into organic, flexible units that have full cost and profit responsibilities.
Asset turnover ratio Segment sales revenues divided by segment assets. This ratio is one of two that make up ROI. It measures the usage (effectiveness) of segment assets in creating sales revenues.
Contribution margin-based income statement An income statement format that organizes costs by their behavior rather than by their function. It is used as the basis for segmenting the income statement in evaluating the profit performance of managers and segments.
Controllable segment margin The subtotal created by subtracting controllable direct fixed costs from contribution margin. It is used to evaluate the profit performance of a segment manager.
Cost center A responsibility center whose manager has control over the incurrence of costs, but has no control over the generation of revenues or the use of investment funds.
Flexible budget A budget prepared using the actual sales volume realized by a segment. It is used for comparing the effects of differences between actual sales prices and costs, and budgeted sales prices and costs on the profit goals of the segment.
Functional form, absorption costing-based income statement The income statement format used in financial reporting. All fixed costs are allocated (absorbed) by the segments and products of the organization.
Growth/share matrix A graphical presentation of the types of products within a segment in terms of their cash flow-generating capabilities. It is useful in making add-or-drop decisions.
Investment center A responsibility center whose manager has control over the incurrence of costs, the generation of revenues, and the deployment of investment funds.
Product life cycle analysis A technique that helps managers determine how to allocate scarce resources to products or product lines in a manner that will maximize enterprise profitability. It is useful in add-or-drop decisions.
Profit center A responsibility center whose manager has control over the incurrence of costs and the generation of revenues, but has no control over the use of investment funds.
Profit margin Segment income divided by segment revenues. This ratio measures the operational efficiency of a segment in creating profits and is one of the two ratios comprising ROI.
Profit variances Profit variances measure the difference between the master budget (pro forma income statement) and the actual profits of a segment. Profit variances include sales variances and cost variances.
Residual income (RI) A measure of an investment center's earnings in relation to the minimum rate of return required by the corporation. It is the segment margin remaining after providing the overall corporation with sufficient profits to cover its minimum required rate of return.
Responsibility accounting system Part of the accounting system that measures and reports on the performance of responsibility centers and their managers.
Responsibility center (RC) A segment of the organization in which a manager is held accountable for a specified set of activities and financial factors.
Return on investment (ROI) (return on assets) The ratio of earnings produced by an investment center to the investment in that center. It is usually calculated by dividing the center's earnings (net operating income) by its average investment in assets.
Sales price variance This sales variance measures the difference between budgeted contribution margin and actual contribution margin due to a difference in budgeted and actual sales prices.
Sales volume variance This sales variance measures the difference between budgeted and actual contribution margins due to a difference in the sales forecast and actual sales volume.
Segment margin A measure of the profitability of a segment. It is calculated by subtracting the direct fixed costs of a segment from its contribution margin.
Segmented income statement An income statement that reports the profitability of various segments within an organizational unit. The unit can be segmented by product line, business function, and/or geographic regions.
DEMONSTRATION PROBLEMS
DEMONSTRATION PROBLEM 1 Segmented income statements.
JB Trucking is a regional freight hauling firm in northern California and Nevada. For performance evaluation purposes the income statement is segmented into delivery areas. One area, Truckee Meadows, serves Reno, Nevada, and Lake Tahoe, California. Information about the January freight deliveries includes:
|
|
Reno |
Lake Tahoe |
|
Number of deliveries |
50 |
40 |
|
Delivery revenues |
$5,000 |
$8,000 |
|
Direct variable costs per delivery |
$50 |
$75 |
|
Controllable direct fixed costs |
$500 |
$1,500 |
|
Uncontrollable direct fixed costs |
$500 |
$800 |
|
Allocated common fixed costs |
$1,900 |
$3,100 |
Direct variable costs include fuel, oil, truck depreciation (per mile basis), and load weight fees. Controllable direct fixed costs include drivers' license fees, license plates, and truck registration fees. Uncontrollable direct fixed costs include monthly maintenance performed at JB Trucking's maintenance facility in Reno. The monthly maintenance is required by state law, and JB Trucking management performs this to control quality. The maintenance center is a profit center, as is each delivery area. Lake Tahoe costs are uniformly higher than Reno costs for three reasons:
• Each delivery run to Tahoe is much longer than within the Reno area. This increases the variable costs of fuel and depreciation.
• Deliveries to Tahoe require state license fees for both Nevada and California.
• Because Tahoe runs involve significantly more miles per delivery, maintenance is performed twice a month.
The common fixed costs allocated by the Truckee Meadows regional dispatchers office include dispatching, administration, and marketing (selling loads to customers) costs.
JB Trucking management is concerned about the functional form, absorption costing-based income statement used to report to external stakeholders. Both Reno and Lake Tahoe reported a net loss due to the heavy snowfall during the month. Deliveries also took longer because of the increased tourist traffic between Reno and Lake Tahoe.
Required:
a. Create a segmented income statement using a contribution margin format that can be used to evaluate the performance of each Truckee Meadows's delivery area and the drivers within each area.
b. Explain how common fixed costs are allocated to the segments, and describe the effect of this allocation on segment profitability.
SOLUTION TO DEMONSTRATION PROBLEM 1
a. Following is the segmented income statement for the Truckee Meadows region.
This format, often called a variable costing format on professional certification exams, identifies the controllable segment margin for driver performance evaluation, as well as the segment margin of each territory for segment evaluation.
|
|
|
Renoa |
|
|
Lake Tahoe |
|
Truckee Meadows |
|
|
|
Per unit' |
Percent |
Totals |
Per unit |
Percent |
Totals |
Percent |
Totals |
|
Revenues |
$100 |
100% |
$5,000 |
$200 |
100% |
$8,000 |
100% |
$13,000 |
|
Less variable costs |
<50> |
<50%> |
<2,500> |
<75> |
<37%> |
<3,000> |
<42%> |
<5,500> |
|
Contribution margin |
$50 |
50% |
$2,500 |
$125 |
63% |
$5,000 |
58% |
$7,500 |
|
Less controllable direct fixed costs |
|
<500> |
|
|
<1,500> |
|
<2,000> |
|
|
Controllable segment margin |
|
|
$2,000 |
|
|
$3,500 |
|
$5,500 |
|
Less uncontrollable direct fixed costs |
|
<500> |
|
|
<800> |
|
<1,300> |
|
|
Segment margin |
|
|
$1,500 |
|
|
$2,700 |
|
$4,200 |
|
Less common fixed costs |
|
|
|
|
|
|
|
<5,000> |
|
Net income |
|
|
|
|
|
|
|
<$800> |
|
a. Sales volume for Reno = 50 deliveries; sales volume for Lake Tahoe = 40 deliveries. b. See Exhibit 20-9 note b for calculations of per unit and percentage amounts. |
||||||||
b. Reno revenues ($5,000 of the $13,000 total for Truckee Meadows) represent 38% of total revenues for Truckee Meadows. Lake Tahoe revenues represent 62% of the total. Using the relative sales revenues to allocate common fixed costs, Reno is allocated $1,900 (38% of the $5,000), and Lake Tahoe is allocated $3,100 (62% of $5,000). Because these allocated amounts are greater than each segment margin by $400, each route shows a net loss of $400 on the income statement used for external financial reporting.
The real profit contributions of Reno and Lake Tahoe are both positive, as indicated by their segment margins of $1,500 and $2,700, respectively. However, the profit they generate for JB Trucking is even greater because the maintenance department is treated as a profit center and, thus, is probably billing maintenance charges at a price higher than its costs.
DEMONSTRATION PROBLEM 2 Calculating profit variances.
Elixir Corporation makes and sells two products, A and B. Following are relevant data for the month of May:
|
|
A |
B |
|
Budgeted sales price per unit |
$6.00 |
$10.00 |
|
Less variable costs per unit |
<3.00> |
<7.50> |
|
Budgeted CMU |
$3.00 |
$ 2.50 |
|
Budgeted sales in units |
300 |
200 |
|
Actual units sold |
240 |
270 |
|
Actual sales price per unit |
$6.00 |
$9.50 |
|
Actual CMU |
$3.00 |
$2.00 |
Required:
a. Calculate the sales volume variance.
b. Calculate the sales price variance.
c. Briefly explain to each manager the difference between master budget pro forma income and actual income for May due to sales activities.
SOLUTION TO DEMONSTRATION PROBLEM 2 a. Sales volume variances:
|
a. Sales volume variance |
= Budgeted CMU x (Actual volume - Budgeted volume) |
|
For product A: |
= $3.00 per unit x (240 units - 300 units) = <$180> unfavorable |
|
For product B: |
= $2.50 per unit x (270 units - 200 units) = $175 favorable |
|
b. Sales price variances: Sales price variance |
= Actual sales volume x (Actual sales price - Budgeted sales price) |
|
For product A: |
= 240 units x ($6.00 per unit - $6.00 per unit) = $0 |
|
For product B: |
= 270 units x ($9.50 per unit - $10.00 per unit) = <$135> unfavorable |
c. Actual profits for product A are less than budgeted profits by $180 because the sales forecast was not achieved. For product B, actual profit is greater than its master budget goal by $40. Apparently, the reduction in sales price of 50 cents from budget resulted in an increase in sales volume. The extra contribution margin generated from the additional volume was $40 more than the lost contribution margin due to the reduction in sales price.
DEMONSTRATION PROBLEM 3 ROI and residual income.
The Institute of Management Accountants has issued Statements on Management Accounting Number 4D, “Measuring Entity Performance,” to help management accountants deal with the issues associated with measuring entity performance. Managers can use these measures to evaluate their own performance or the performance of subordinates, to identify and correct problems, and to discover opportunities. A number of performance measures are available to assist managers in measuring achievement. To present a more complete picture of performance, it is strongly recommended that several of these performance measures be utilized and that they be combined with nonfinancial measures such as market share, new product development, and human resource utilization. The following commonly-used performance measures are derived from the traditional historical accounting system:
• Profit margin (percent)
• Asset turnover
• Return on the investment in assets
• Residual income
Required: For each of the performance measures identified above:
a. Describe how the measure is calculated.
b. Describe the information provided by the measure.
c. Explain the limitations of this information.
[CMA adapted]
SOLUTION TO DEMONSTRATION PROBLEM 3
a. Profit margin = Segment income / Segment revenues
Asset turnover = Segment revenues / Segment assets
Return on investment = Profit margin X Asset turnover
Residual income = Segment income - (Segment assets x Corporate minimum required rate of return)
b. Profit margin is a short-run measure of operating efficiency; it measures in percent-age terms the profit generated from a dollar of sales. Asset turnover is a measure of asset usage effectiveness. It shows how many dollars of sales are created by a dollar invested in this investment center. ROI is simply an interest rate. It shows what percentage of every dollar invested in the segment is returned to corporate headquarters as segment profit. Instead of measuring the segment's return to the parent company in terms of a percentage of the investment in it, RI provides this information in terms of an absolute dollar value.
c. A number of different amounts can be used in both the numerator and denominator of ROI For example, the net income figure can be the absorption costing-based segment profit, segment margin, segment margin before taxes and interest, or controllable segment margin. The asset base can include the segment's gross assets, net assets, or some subset of its assets. With respect to RI, the asset base and minimum required rate of return also can be based on a number of different values.
At times, the management accountant may be asked to choose a valuation technique to “cook the books,” allowing the investment center manager to look more favorable than might be appropriate. In accordance with the IMA's standards for ethical conduct, the management accountant should resist these temptations and choose the values that most accurately and fairly represent performance.
Many of the limitations concern the potential for dysfunctional decision-making behaviors. Ethically, the management accountant has a responsibility to make sure that if deadly parallel evaluations are used, the investment centers are truly comparable. Many of the problems that can result may be avoided if the management accountant remembers that, first and foremost, proper performance evaluation requires a comparison of budgeted to actual performance. Finally, proper performance evaluation should not overemphasize the importance of financial performance measures. At this level of the organization, many nonfinancial performance measures may be more relevant.
REVIEW QUESTIONS
20.1 What is the role of a responsibility accounting system within the accounting LAN?
20.2 What is the role of a responsibility accounting system within the performance evaluation-reward system of an enterprise?
20.3 Is a responsibility center the same thing as a segment? Explain.
20.4 Describe three ways of segmenting an enterprise by activities.
20.5 What are the advantages of decentralizing an enterprise into autonomous responsibility centers?
20.6 What are the disadvantages of decentralizing an enterprise into autonomous responsibility centers?
20.7 What are the three financial factors used to categorize responsibility centers?
20.8 For each of the three types of financial factors associated with responsibility centers, what should be output from the responsibility accounting system?
20.9 What motivational problems can result from overemphasizing cost variance minimization in performance evaluation?
20.10 What is a segmented income statement?
20.11 Why is controllability an important criterion for a high-quality responsibility accounting system?
20.12 What role does the master budgeting process play in controllability identification?
20.13 What are the pros and cons of allocating common corporate service costs to the enterprise's segments?
20.14 In reporting on profit center financial performance, what are the two goals of the responsibility accounting system?
20.15 What is the difference between a functional form, absorption costing-based income statement and a contribution margin-based income statement?
20.16 What problems are created by using a functional form, absorption costing-based income statement in evaluating performance?
20.17 How can using a contribution margin-based income statement overcome the problems identified in Question 20.16?
20.18 In a responsibility accounting system using a contribution margin-based income statement to evaluate profit center financial performance, costs are classified into which of the following categories?
a. Prime and conversion costs.
b. Direct and indirect costs.
c. Controllable and noncontrollable costs.
d. Variable and fixed costs.
20.19 Explain the most common method of allocating common fixed costs to segments. What problems are created by this method?
20.20 What is the first step in segmenting a profit center's income statement?
20.21 What purpose is served by creating the subtotal “segment margin”?
20.22 The direct fixed costs of the subsegments plus the fixed costs common to the subsegments equals which amount?
20.23 What has to be done to a segmented income statement if it is to be used in evaluating the performance of the profit center manager?
20.24 What is the purpose of creating the subtotal “controllable segment margin”?
20.25 Describe a deadly parallel performance evaluation strategy.
20.26 What type of comparisons should be made in evaluating long-run continuous improvement?
20.27 Why are year-to-year comparisons of actual profits not as relevant as year-to-year budget comparisons?
20.28 What two types of variances are included in profit variances?
20.29 Which two variances are included in sales variances?
20.30 Which variances make up cost variances?
20.31 What is a flexible budget and how is it related to a profit equation?
20.32 What information does a sales volume variance convey?
20.33 What is the informational value of a sales price variance?
20.34 Why wasn't the FOH volume variance included in the profit variance report shown in Exhibit 20-13?
20.35 Explain the add-or-drop decision.
20.36 Should any qualitative factors be considered in the add-or-drop decision?
20.37 What role do avoidable costs play in the add-or-drop decision? Why aren't direct fixed costs always relevant to this decision?
20.38 Explain the relevance of product life cycle analysis in deciding whether to add or drop products.
20.39 Explain the relevance of the growth/share matrix in deciding whether to add or drop products.
20.40 Explain in a simple, intuitively appealing manner what ROI is.
20.41 Which two financial ratios make up ROI?
20.42 What information is conveyed by each of the ratios in ROI?
20.43 Explain the relationship between asset turnover and profit margin in understanding ROI.
20.44 What dysfunctional behaviors might result from an overemphasis on ROI in investment center performance evaluation?
20.45 Which comparisons should be made to properly evaluate performance?
a. Actual results between divisions.
b. Year-to-year actual profit comparisons. c. Budget-to-actual for the time period.
20.46 How does RI differ from ROI?
20.47 When evaluating an investment decision, can RI be explained using ROI?
20.48 What is the traditional argument against using ROI? What is the traditional argument for using RI?
20.49 What are the two behavioral assumptions supporting the argument for using RI instead of ROI in investment decision making?
20.50 How can the use of ideal standards be justified in choosing an accounting measure of performance for the investment decision?
20.51 For which divisions should ROI be used as a hurdle rate in the investment decision? For which divisions should RI be used?
20.52 What is an amoeba?
20.53 Describe the “value added per labor hour” calculation.
CHAPTER-SPECIFIC PROBLEMS
These problems require responses based directly on concepts and techniques presented in the text.
20.54 Segmenting the income statement. This is a continuation of Demonstration Problem 1. The Lake Tahoe segment has two truck drivers. Prepare a segmented income statement with segment margins and controllable segment margins for each driver. The following information may be useful:
|
|
ALBERT |
GEORGE |
|
Number of deliveries |
25 |
15 |
|
Delivery revenues |
$3,875 |
$4,125 |
|
Direct variable costs per delivery |
$75 |
$75 |
|
Controllable direct fixed costs |
$750 |
$750 |
|
Uncontrollable direct fixed costs |
$400 |
$400 |
|
Allocated common fixed costs |
$1,598 |
$1,502 |
Required: Evaluate the performance of each truck driver.
20.55 Segmented income statement. [AICPA adapted] Stratford Corporation is a diversified company whose products are marketed both domestically and internationally. The company's major product lines are pharmaceutical products, sports equipment, and household appliances. At a recent meeting of Stratford's board of directors, there was a lengthy discussion on ways to improve overall corporate profitability without new acquisitions as the company is already heavily leveraged. The members of the hoard decided that they required additional financial information about individual corporate operations in order to target areas for improvement.
Dave Murphy, Stratford's controller, has been asked to provide additional data that would assist the board in its investigation. Stratford is not a public company and, therefore, has not prepared complete income statements by segment. Murphy has regularly prepared an income statement by product line through contribution margin. However, Murphy now believes that income statements prepared through operating income along both product lines and geographic areas would provide the directors with the required insight into corporate operations. Murphy has the following data available to him:
|
|
Product line |
|
||
|
|
Pharmaceutical |
Sports |
Appliances |
Total |
|
Production sales in units |
160,000 |
180,000 |
160,000 |
500,000 |
|
Average selling price per unit |
$8.00 |
$20.00 |
$15.00 |
|
|
Average variable manufacturing cost per unit |
$4.00 |
$9.50 |
$8.25 |
|
|
Average variable selling expense per unit |
$2.00 |
$2.50 |
$2.25 |
|
|
Fixed factory overhead excluding depreciation |
|
|
|
$500,000 |
|
Depreciation of plant and equipment |
|
|
|
$400,000 |
|
Administrative and selling expenses |
|
|
|
$1,160,000 |
Murphy had several discussions with the division managers for each product line and compiled the following information from these meetings:
The division managers concluded that Murphy should allocate fixed factory overhead on the basis of the ratio of the variable costs expended per product line or per geographic area to total variable costs.
Each of the division managers agreed that a reasonable basis for the allocation of depreciation on plant and equipment would be the ratio of units produced per product line or per geographic area to the total number of units produced.
There was little agreement on the allocation of administrative and selling expenses so Murphy decided to allocate only those expenses that were directly traceable to the segment being delineated; i.e., manufacturing staff salaries to product lines and sales staff salaries to geographic areas. Murphy used the following data for this allocation:
|
manufacturing staff |
sales staff |
|
|
|
Pharmaceutical Sports Appliances |
$120,000 140,000 80,000 |
United States Canada Europe |
$ 60,000 100,000 250,000 |
|
The division managers were to able to provide reliable sales percentages for their product lines by geographic |
|||
|
|
Percentage Of Unit Sales |
||
|
|
United States |
Canada |
Europe |
|
Pharmaceutical Sports Appliances |
40% 40 20 |
10% 40 20 |
50% 20 60 |
|
Using this information, Murphy prepared the following product line income statement: |
|||
|
|
Stratford Corporation Statement Of Income By Product Lines for The Fiscal Year Ended April 30, 2005 |
|
|
||
|
|
Product Lines |
||||
|
|
Pharmaceutical |
Sports |
Appliances |
Unallocated |
Total |
|
Sales in units |
160,000 |
180,000 |
160,000 |
|
|
|
Sales |
$1,280,000 |
$3,600,000 |
$2,400,000 |
|
$7,280,000 |
|
Variable manufacturing and selling costs |
960,000 |
2,160,000 |
1,680,000 |
|
4,800,000 |
|
Contribution margin |
$ 320,000 |
$1,440,000 |
$ 720,000 |
|
$2,480,000 |
|
Fixed costs: Fixed factory overhead |
$ 100,000 |
$ 225,000 |
$ 175,000 |
|
$ 500,000 |
|
Depreciation |
128,000 |
144,000 |
128,000 |
|
400,000 |
|
Administrative and selling expense |
120,000 |
140,000 |
80,000 |
$820,000 |
1,160,000 |
|
Total fixed costs |
$ 348,000 |
$ 509,000 |
$ 383,000 $ |
820,000 |
$2,060,000 |
|
Operating income (loss) |
$ <28,000> |
$ 931,000 |
$ 337,000 |
$<820,000> |
$ 420,000 |
Required:
a. Prepare a segmented income statement for Stratford Corporation based on the company's geographic areas of sales. The statement should be in good form and show the operating income for each segment.
b. As a result of the information disclosed by both segmented income statements (by product line and by geographic area), recommend areas where Stratford Corporation should focus its attention in order to improve corporate profitability.
20.56 Absorption costing versus contribution margin. The Maalox Company produces a single product. Data from the company's records for 19X4 operations are as follows:
|
Projected unit sales |
3,800 |
|
|
Units to be produced |
4,000 |
|
|
Beginning inventory, finished goods |
-0- |
|
|
Estimated ending inventory, finished goods |
200 |
|
|
Selling price per unit |
$20 |
|
|
Variable costs per unit: |
|
|
|
Direct materials |
$4 |
|
|
Direct labor |
1 |
|
|
Variable manufacturing overhead |
2 |
|
|
Variable selling and administrative |
2 |
$9 |
|
Fixed costs for 19X4: Fixed manufacturing overhead |
|
$16,000 |
|
Fixed selling and administrative |
|
$20,000 |
Required:
a. Compute the manufacturing cost per unit using the absorption costing method.
b. Prepare an income statement suitable for external financial reporting.
c. Prepare an income statement using the contribution margin approach.
d. Assume that sales remain at 3,800 units as projected, but production equals sales. Prepare two income statements based on this assumption, one prepared using absorption costing and the other using the contribution margin approach.
20.57 Discussing a performance evaluation system. Darmen Corporation is one of the major producers of prefabricated houses in the home building industry. The corporation consists of two divisions: (1) Bell Division, which acquires the raw materials to manufacture the basic house components and assembles them into kits, and (2) the Cornish Division, which takes the kits and constructs the homes for final home buyers. The corporation is decentralized, and the management of each division is measured by its income and return on investment.
Bell Division assembles seven separate house kits using raw materials purchased at the prevailing market prices. The seven kits are sold to Cornish for prices ranging from $45,000 to $98,000. The prices are set by Darmen's corporate management using prices paid by Cornish when it buys comparable units from outside sources. The smaller kits with the lower prices have become a larger portion of the units sold because the final house buyer is facing prices that are increasing more rapidly than personal income. The kits are manufactured and assembled in a new plant just purchased by Bell this year. The division had been located in a leased plant for the past four years.
All kits are assembled upon receipt of an order from the Cornish Division. When the kit is completely assembled, it is loaded immediately on a Cornish truck. Thus, Bell Division has no finished goods inventory.
The Bell Division's accounts and reports are prepared on an actual cost basis. There is no budget, and standards have not been developed for any product. A factory overhead rate is calculated at the beginning of each year. The rate is designed to charge all overhead to the product each year. Any under- or over-applied overhead is allocated to the cost of goods sold account and work-in-process inventories.
Bell Division's annual report is presented next. This report forms the basis of the evaluation of the division and its management by corporate management.
|
Bell Division |
||||
|
Performance for Report The Year Ended December 31, 20x6 |
||||
|
|
|
Increase Or <Decrease> From 20x5 |
||
|
|
20x5 |
20x6 |
Amount |
Percent change |
|
Summary data Net income ($000 omitted) |
$34,222 |
$31,573 |
$2,649 |
8.4 |
|
Return on investment |
37% |
43% |
<6>% |
<14.0> |
|
Kits shipped (units) |
2,000 |
2,100 |
<100> |
<4.8> |
|
Production data (in units) Kits started |
2,400 |
1,600 |
800 |
50.0 |
|
Kits shipped |
2,000 |
2,100 |
<100> |
<4.8> |
|
Kits in process at year-end |
700 |
300 |
400 |
133.3 |
|
Increase <decrease> in kits in process at year-end |
400 |
<500> |
- |
|
|
Financial data ($000 omitted) Sales |
$138,000 |
$162,800 |
$<24,800> |
<15.2> |
|
Production costs of units sold: Raw material |
32,000 |
40,000 |
<8,000> |
<20.0> |
|
Labor |
41,700 |
53,000 |
<I1,300> |
<21.3> |
|
Factory overhead |
29,000 |
37,000 |
<8,000> |
<21.6> |
|
Cost of units sold |
102,700 |
130,000 |
<27,300> |
<21.0> |
|
Other costs: Corporate charges for personnel services |
228 |
210 |
18 |
8.6 |
|
Accounting services |
425 |
440 |
<15> |
<3.4> |
|
Financing costs |
300 |
525 |
<225> |
<42.9> |
|
Total other costs |
953 |
1,175 |
<222> |
<18.9> |
|
Adjustments to income: Un-reimbursed fire loss |
- |
52 |
<52> |
<100.0> |
|
Raw material losses due to improper storage |
125 |
- |
125 |
- |
|
Total adjustments |
125 |
52 |
73 |
140.4 |
|
Total deductions |
103,778 |
131,227 |
<27,449> |
<20.9> |
|
Division income |
$ 34,222 $ |
31,573 |
$ 2,649 |
8.4 |
|
Division investment |
$ 92,000 $ |
73,000 |
$ 19,000 |
26.0 |
|
Return on investment |
37% |
43% |
<6>% |
<14.0> |
Additional information regarding corporate and division practices is as follows:
• The corporate office does all the personnel and accounting work for each division.
• The corporate personnel costs are allocated on the basis of the number of employees in the division.
• The accounting costs are allocated to the division on the basis of total costs excluding corporate charges
• The division administration costs are included in factory overhead.
• The financing charges include a corporate imputed interest charge on division assets and any divisional lease payments.
• The division investment for the return on investment calculation includes division inventory and plant and equipment at gross book value.
Required:
a. Discuss the value of the annual report presented for the Bell Division in evaluating the division and its management in terms of:
1. The accounting techniques employed in the measurement of division activities.
2. The manner of presentation.
3. The effectiveness with which it discloses differences and similarities between years.
b. Present specific recommendations you would make to the management of Darmen Corporation to improve its accounting and financial reporting system.[CMA adapted]
20.58 Discussing budgets and responsibility accounting.[CMA adapted] The Argon County Hospital is located in the county seat. Argon County is a well-known summer resort area. The county population doubles during the vacation months (May-August), and hospital activity more than doubles during these months. The hospital is organized into several departments. Although it is a relatively small hospital, its pleasant surroundings have attracted a well-trained and competent medical staff.
An administrator was hired a year ago to improve the business activities of the hospital. Among the new ideas he has introduced is responsibility accounting. This program was announced along with quarterly cost reports supplied to department heads. Previously, cost data were presented to department heads infrequently. The following are excerpts from the announcement and the report received by the laundry supervisor:
The hospital has adopted a “responsibility accounting system.” From now on you will receive quarterly reports comparing the costs of operating your department with budgeted costs. The reports will highlight the differences (variations) so you can zero in on the departure from budgeted costs (this is called “management by exception”). Responsibility accounting means you are accountable for keeping the costs in your department within the budget. The variations from the budget will help you identify what costs are out of line, and the size of the variation will indicate which ones are the most important. Your first quarterly report accompanies this announcement.
|
Argon performance Report-laundry |
July-September County Hospital budget |
20x3 actual |
Department <Over> under budget |
Percent <Over> under budget |
|
Patient-days |
9,500 |
11,900 |
<2,400> |
<25> |
|
Pounds of laundry processed |
125,000 |
156,000 |
<31,000> |
<25> |
|
Costs: Laundry labor |
$ 9,000 |
$12,500 |
$<3,500> |
<39> |
|
Supplies |
1,100 |
1,875 |
<775> |
<70> |
|
Water, water heating and softening |
1,700 |
2,500 |
<800> |
<47> |
|
Maintenance |
1,400 |
2,200 |
<800> |
<57> |
|
Supervisor's salary |
3,150 |
3,750 |
<600> |
<19> |
|
Allocated administration costs |
4,000 |
5,000 |
<1,000> |
<25> |
|
Equipment depreciation |
1,200 |
1,250 |
<50> |
<4> |
|
|
$21,550 |
$29,075 |
$<7,525> |
<35> |
Administrator's comments: Costs are significantly above budget for the quarter. Particular attention needs to be paid to labor, supplies, and maintenance.
The annual budget for 20X3 was constructed by the new administrator. Quarterly budgets were computed as one-fourth of the annual budget. The administrator compiled the budget from analysis of the prior three years' costs. The analysis showed that all costs increased each year, with more rapid increases between the second and third year. He considered establishing the budget at in average of the prior three years' costs, hoping that the installation of the system would reduce costs to this level. However, in view of the rapidly increasing prices, he finally chose 20X2 costs less 3 % for the 20X3 budget. The activity level, measured by patient-days and pounds of laundry processed, was set at the 20X2 volume, which was approximately equal to the volume of each of the past three years.
Required:
a. Comment on the method used to construct the budget.
b. What information should be communicated by variations from budgets?
c. Does the report effectively communicate the level of efficiency of this department? Give reasons for your answer.
20.59 Discussing responsibility accounting and budgeting.[CMA adapted] Family Resorts Inc., is a holding company for several vacation hotels in the northeast and mid-Atlantic states. The firm originally purchased several old inns, restored the buildings, and upgraded the recreational facilities. Vacationing families have been receptive to the inns because they offer many services for children and allow parents time for themselves. Since the completion of the restorations ten years ago, the company has been profitable.
Family Resorts has just concluded its annual meeting of regional and district managers. This meeting is held each November to review the results of the previous season and to help the managers prepare for the upcoming year. Prior to the meeting, the managers have submitted proposed budgets for their districts or regions, as appropriate. These budgets have been reviewed and consolidated into an annual operating budget for the entire company. The 2005 budget has been presented at the meeting and was accepted by the managers.
To evaluate the performance of its managers, Family Resorts uses responsibility accounting. Therefore, the preparation of the budget is given close attention at headquarters. If major changes need to be made to the budgets submitted by the managers, all affected parties are consulted before the changes are incorporated. Following are two pages from the budget booklet that all managers received at the meeting:
|
Family Resorts, Inc. Responsibility Summary ($000 Omitted) |
|
|
Reporting unit: Family Resorts Responsible person: President |
|
|
Mid-Atlantic Region |
$605 |
|
New England Region |
365 |
|
Unallocated costs |
< 160> |
|
Income before taxes |
$810 |
|
Reporting unit: New England Region Responsible person: Regional manager |
|
|
Vermont |
$200 |
|
New Hampshire |
140 |
|
Maine |
105 |
|
Unallocated costs |
<80> |
|
Total contribution |
$365 |
|
Reporting unit: Maine District Responsible person: District manager |
|
|
Harbor Inn |
$80 |
|
Camden Country Inn |
60 |
|
Unallocated costs |
<35> |
|
Total contribution |
$105 |
|
Reporting unit: Harbor Inn Responsible person: Innkeeper |
|
|
Revenue |
$600 |
|
Controllable costs |
<455> |
|
Allocated costs |
<65> |
|
Total contribution |
$ 80 |
|
|
Family Resorts, Inc. Condensed Operating Budget Maine District For The Year Ended December 31, 2005 ($000 Omitted) |
|
|
|
||||||
|
|
Region |
New England Region |
Maine District Inns |
|||||||
|
|
Family Resorts |
Mid-atlantic |
New England |
Not allo-cateda |
Vermont |
New Hampshire |
Maine |
Not allocatedb |
Harbor |
Camden Country |
|
Net sales |
$7,900 |
$4,200 |
$3,700 |
|
$1,400 |
$1,200 |
$1,100 |
|
$600 |
$500 |
|
Cost of sales |
4,530 |
2,310 |
2,220 |
|
840 |
720 |
660 |
|
360 |
300 |
|
Gross margin |
$3,370 |
$1,890 |
$1,480 |
|
$ 560 |
$ 480 |
$ 440 |
|
$240 |
$200 |
|
Controllable expenses: Supervisory expense |
$ 240 |
$ 130 |
$ 110 |
|
$ 35 |
$ 30 |
$ 45 |
$ 10 |
$ 20 |
$ 15 |
|
Training expense |
160 |
80 |
80 |
|
30 |
25 |
25 |
|
15 |
10 |
|
Advertising expense |
500 |
280 |
220 |
$ 50 |
55 |
60 |
55 |
15 |
20 |
20 |
|
Repairs and maintenance |
480 |
225 |
255 |
|
90 |
85 |
80 |
|
40 |
40 |
|
Total controllable expenses |
$1,380 |
$ 715 |
$ 665 |
$ 50 |
$ 210 |
$ 200 |
$ 205 |
$ 25 |
$ 95 |
$ 85 |
|
Controllable contribution |
$1,990 |
$1,175 |
$ 815 |
$<50> |
$ 350 |
$ 280 |
$ 235 |
$<25> |
$145 |
$115 |
|
Expenses controlled by others: Depreciation |
$ 520 |
$ 300 |
$ 220 |
$ 30 |
$ 70 |
$ 60 |
S 60 |
$ 10 |
$ 30 |
$ 20 |
|
Property taxes |
200 |
120 |
80 |
|
$ 30 |
30 |
20 |
|
to |
10 |
|
Insurance |
300 |
150 |
150 |
|
50 |
50 |
50 |
|
25 |
25 |
|
Total expenses controlled by others |
$1,020 |
$ 570 |
$ 450 |
$ 30 |
$ 150 |
$ 140 |
$ 130 |
$ 10 |
$ 65 |
$ 55 |
|
Total contribution |
$ 970 |
$ 605 |
$ 365 |
$<80> |
$ 200 |
$ 140 |
$ 105 |
$<35> |
$ 80 |
$ 60 |
|
Unallocated costs |
160 |
|
|
|
|
|
|
|
|
|
|
Income before taxes |
$ 810 |
|
|
|
|
|
|
|
|
|
|
aUnallocated expenses include a regional advertising campaign and equipment used by the regional manager. bUnallocated expenses include a portion of the district manager's salary, district promotion costs, and the district manager's car. Unallocated costs include taxes on undeveloped real estate, headquarters expense, legal fees, and audit fees. |
Required:
a. Responsibility accounting has been used effectively by many companies, both large and small.
1. Define responsibility accounting.
2. Discuss the benefits that accrue to a company using responsibility accounting.
3. Describe the advantages of responsibility accounting for the managers of a firm.
b. Family Resorts, Inc.'s budget was accepted by the regional and district managers. Based on the facts presented, evaluate the budget process employed by Family Resorts by addressing the following:
1. What features of the budget preparation may lead to managers adopting and supporting the budget process?
2. What features of the budget presentation shown here are likely to snake the budget attractive to managers?
3. What recommendations, if any, could be made to the budget preparers to improve the budget process? Explain your answer.
20.60 Explaining the purposes and behavioral aspects of a responsibility accounting system. [CMA adapted] Kelly Petroleum Company has a large oil and natural gas project in Oklahoma. The project has been organized into two production centers (Petroleum Production and Natural Gas Production) and one service center (Maintenance). Additional information about the Maintenance Center follows:
Maintenance Center activities and scheduling. Don Pepper, Maintenance Center manager, has organized his maintenance workers into work crews that serve the two production centers. The maintenance crews perform preventive maintenance and repair equipment both in the field and in the central maintenance shop.
Pepper is responsible for scheduling all maintenance work in the field and in the central shop. Preventive maintenance is performed according to a set schedule established by Pepper and approved by the production center managers. Breakdowns are given immediate priority in scheduling so that downtime is minimized. Thus, preventive maintenance occasionally must be postponed, but every attempt is made to reschedule it within three weeks.
Preventive maintenance work is the responsibility of Pepper. However, if a significant problem is discovered during preventive maintenance, the appropriate production center supervisor authorizes and supervises the repair after checking with Pepper.
When a breakdown in the field occurs, the production centers contact Pepper to initiate the repairs. The repair work is supervised by the production center supervisor. Machinery and equipment sometimes need to be replaced while the original equipment is repaired in the central shop. This procedure is followed only when the time to make the repair in the field would result in an extended interruption of operations. Replacement of equipment is recommended by the maintenance work crew supervisor and approved by a production center supervisor.
Routine preventive maintenance and breakdowns of automotive and mobile equipment used in the field are completed in the central shop. All repairs and maintenance activities taking place in the central shop are under the direction of Pepper.
Maintenance Center accounting activities. Pepper has records identifying the work crews assigned to each job in the field, the number of hours spent on the job, and the parts and supplies used on the job. In addition, records for the central shop (jobs, labor hours, parts and supplies) have been maintained. However, this detailed maintenance information is not incorporated into Kelly's accounting system.
Pepper develops the annual budget for the Maintenance Center by planning the preventive maintenance that will be needed during the year, estimating the number and seriousness of breakdowns, and estimating the shop activities. He then bases the labor, parts, and supply costs on his plans and estimates and develops the budget amounts by line item. Because the timing of the breakdowns is impossible to plan, Pepper divides the annual budget by 12 to derive the monthly budget.
All costs incurred by the work crews in the field and in the central shop are accumulated monthly and then allocated to the two production cost centers based upon the field hours worked in each production center. This method of cost allocation has been used on Pepper's recommendation because he believed that it was easy to implement and understand. Furthermore, he believed that it was impossible to incorporate a better allocation system into the monthly report due to the wide range of salaries paid to maintenance workers and the fast turnover of materials and parts.
The November cost report provided by the Accounting Department is as follows:
|
|
Oklahoma project Maintenance Center Cost Report For The month of November 20x4 ($000 omitted) |
|
||
|
|
budget |
actual |
petroleum production |
Natural gas production |
|
Shop hours |
2,000 |
1,800 |
- |
- |
|
Field hours |
8,000 |
10,000 |
6,000 |
4,000 |
|
Labor, electrical |
$ 25.0 |
$ 24.0 |
$ 14.4 |
$ 9.6 |
|
Labor, mechanical |
30.0 |
35.0 |
21.0 |
14.0 |
|
Labor, instrumentation |
18.0 |
22.5 |
13.5 |
9.0 |
|
Labor, automotive |
3.5 |
2.8 |
1.7 |
1.1 |
|
Labor, heavy equipment |
9.6 |
12.3 |
7.4 |
4.9 |
|
Labor, equipment operation |
28.8 |
35.4 |
21.2 |
14.2 |
|
|
Budget |
Actual |
Petroleum Production |
Natural Gas Production |
|
Labor, general |
15.4 |
15.9 |
9.6 |
6.3 |
|
Parts |
60.0 |
86.2 |
51.7 |
34.5 |
|
Supplies |
15.3 |
12.2 |
7.3 |
4.9 |
|
Lubricants and fuels |
3.4 |
3.0 |
1.8 |
1.2 |
|
Tools |
2.5 |
3.2 |
1.9 |
1.3 |
|
Accounting and dataprocessing |
1.5 |
1.5 |
0.9 |
0.6 |
|
Totals |
$213.0 |
$254.0 |
$152.4 |
$101.6 |
Production center managers' concerns. Both production center managers have been upset with the method of cost allocation. Furthermore, they believe the report is virtually useless as a cost control device. Actual costs always seem to deviate from the monthly budget, and the proportion charged to each production center varies significantly from month to month. Maintenance costs have increased substantially since 2002, and the production managers believe that they have no way to judge whether such an increase is reasonable. The two production managers, Pepper, and representatives of corporate accounting have met to discuss these concerns. They concluded that a responsibility accounting system could be developed to replace the current system. In their opinion, a responsibility accounting system would alleviate the production managers' concerns and accurately reflect the activity of the Maintenance Center.
Required:
a. Explain the purposes of a responsibility accounting system, and discuss how such a system could resolve the concerns of the production center managers of Kelly Petroleum Company.
b. Describe the behavioral advantages generally attributed to responsibility accounting systems that the management of Kelly Petroleum Company should expect if the system is effectively introduced for the Maintenance Center.
c. Describe a report format for the Maintenance Center that would be based on a responsibility accounting system, and explain which, if any, of the Maintenance Center's costs should be charged to the two production centers.
20.61 Discontinuance decision. [CMA adapted] Condensed monthly operating income data for Cosmo, Inc. for November 20X4 is presented below. Additional information regarding Cosmo's operations follows the statement.
|
|
Total |
Mallstore |
Townstore |
|
Sales |
$200,000 |
$80,000 |
$120,000 |
|
Less variable costs |
<116,000> |
<32,000> |
<84,000> |
|
Contribution margin |
$ 84,000 |
$48,000 |
$ 36,000 |
|
Less direct fixed costs |
<60,000> |
<20,000> |
<40,000> |
|
Store segment margins |
$ 24,000 |
$28,000 |
<$ 4,000> |
|
Less common fixed costs |
<10,000> |
<4,000> |
<6,000> |
|
Operating income |
$ 14,000 |
$24,000 |
<$ 10,000> |
• One-fourth of each store's direct fixed costs would continue through December 31, 20X5, if either store were closed.
• Cosmo allocates common fixed costs to each store on the basis of sales dollars.
• Management estimates that closing the Town Store would result in a 10% decrease in Mall Store sales, while closing the Mall Store would not affect Town Store sales.
• The operating results for November 20X4 are representative of all months.
Required:
a. If Cosmo closed the Town Store, what would be the monthly increase (decrease) in Cosmo's operating income during 20X5?
b. Cosmo is considering a promotional campaign at the Town Store that would not affect the Mall Store. Increasing annual promotional costs at the Town Store by $60,000 would increase Town Store's sales by 10%. What would be the monthly increase (decrease) in Cosmo's operating income during 20X5 if this campaign is undertaken?
c. One-half of Town Store's dollar sales are from items sold at variable cost to attract customers to the store. Cosmo is considering dropping these items, a move that would reduce the Town Store's direct fixed costs by 15% and result in a loss of 20% of the remaining Town Store's sales volume. This change would not affect the Mall Store. If Cosmo dropped the items sold at variable cost, what would be the monthly increase (decrease) in Cosmo's operating income during 20X5?
20.62 Growth/share matrix. The market growth/share classifications can be depicted in the following manner:
Problem children are products that promise high growth rates but have relatively small market shares, such as new products that are similar to their competitors. Stars are high-growth, high-market share products that tend to mature into cash cows. Cash cows are slow-growing established products that can be “milked” for cash to help the stars and problem children and to introduce new products. The dogs are low-growth, low-market share items that are candidates for elimination. Understanding where a product falls within this market growth/share matrix is important when deciding which products to keep and which ones to drop.
Required: Discuss the applicability or nonapplicability of using a growth/share matrix in deciding whether to keep or drop products.
20.63 Add-or-drop decision. The Sklar Company carries three products. Sales and cost information for the preceding month for each separate product line and for the company in total follows:
|
|
|
Products |
||
|
|
Totals |
A |
B |
C |
|
Sales |
$310,000 |
$160,000 |
$90,000 |
$60,000 |
|
Less variable costs |
<112,000> |
<50,000> |
<30,000> |
<32,000> |
|
Contribution margin |
$198,000 |
$110,000 |
$60,000 |
$28,000 |
|
Less fixed costs: Salaries |
$ 54,000 |
$ 30,000 |
$14,000 |
$10,000 |
|
Depreciation |
12,000 |
5,000 |
4,000 |
3,000 |
|
Utilities |
7,000 |
4,000 |
2,000 |
1,000 |
|
Advertising |
22,000 |
10,000 |
6,000 |
6,000 |
|
Rent |
26,000 |
15,000 |
7,000 |
4,000 |
|
Insurance |
8,000 |
4,000 |
2,000 |
2,000 |
|
Administrative |
42,000 |
22,000 |
12,000 |
8,000 |
|
Total fixed costs |
<171,000> |
<90,000> |
<47,000> |
<34,000> |
|
Net income (loss) |
$ 27,000 |
$ 20,000 |
$13,000 |
<$ 6,000> |
Product C shows a net loss of $6,000 for the month. Management believes that dropping product C would cause profits in the company as a whole to improve. Tim Sandifer, the management accountant, has been asked to analyze the situation and present his findings next Monday.
Tim gathers the following facts:
• Salaries are paid to employees working directly in each product line area. All of the employees working in the product C area would be discharged if the product line is dropped.
• Depreciation represents depreciation on fixtures and equipment that were customized for each product line. Their resale value is very small.
• Utilities represent costs for the entire company. The amount charged to each product line represents an allocation based on square feet of floor space occupied.
• Rent represents an amount paid for the entire building that houses the company. It is allocated to the product lines on a basis of square feet of floor space occupied. The monthly rent of $26,000 is fixed under a long-term lease agreement.
• Insurance represents the amount of premium paid within each of the product lines.
• Administrative costs are allocated to the product lines on the basis of sales dollars. Total administrative costs will not change if product C is dropped.
Required:
a. Identify those costs that are avoidable and those costs that are not avoidable if product C is dropped.
b. Determine how dropping product C will affect the overall profits of the company.
c. Explain to management why they should either retain product C or drop it.
20.64 Calculating ROI and RI. Selected data from Calumet Company's accounting records reveal the following:
|
Sales |
$500,000 |
|
Average invested capital |
$200,000 |
|
Net income |
$40,000 |
|
Imputed interest rate |
10% |
|
Capital turnover |
3.0 |
Required:
a. Calculate the return on investment (ROI)
b. Calculate the residual income (RI)
20.65 Calculating ROI and RI. [CMA adapted] Raddington Industries produces tool and die machinery for manufacturers. The company expanded vertically in 19X4 by acquiring one of its suppliers of alloy steel plates, Reigis Steel Company. In order to manage the two separate businesses, the operations of Reigis are reported separately as an investment center.
Raddington monitors its divisions on the basis of both unit contribution and return on average investment (ROI), with investment defined as average operating assets employed. Management bonuses are determined on ROI. All investments in operating assets are expected to earn a minimum return of 11 before income taxes.
Reigis's cost of goods sold is considered to be entirely variable while the division's administrative expenses are not dependent on volume. Selling expenses are a mixed cost with 40% attributed to sales volume. Reigis's ROI has ranged from 11.8% to 14.7% since 19X4. During the fiscal year ended November 30, 19X9, Reigis contemplated a capital acquisition with an estimated ROI of 11, 5 %; however, division management decided against the investment because it believed that the investment would decrease Reigis's overall ROI.
The 19X9 operating statement for Reigis follows. The division's operating assets employed were $15,000,750 at November 30, 19X9, a 5% increase over the 19X8 year-end balance.
|
Reigis Steel Division Operating Statement for The Year Ended November 30, 19x9 ($000 Omitted) |
|
|
|
Sales Revenue |
|
$25,000 |
|
Less Expenses: Cost Of Goods Sold |
$16,500 |
|
|
Administrative Expenses |
3,955 |
|
|
Selling Expenses |
2,700 |
23,155 |
|
Income From Operations Before Income Taxes |
|
$ 1,845 |
Required:
a. Calculate the unit contribution for Reigis Steel Division if 1,484,000 units were produced and sold during the year ended November 30, 19X9.
b. Calculate the following performance measures for 19X9 for the Reigis steel Division:
1. Pretax return on average investment in operating assets employed (ROI).
2. Residual income (RI) calculated on the basis of average operating assets employed.
c. Explain why Reigis management would have been more likely to accept' the contemplated capital acquisition if RI rather than ROI had been used as a performance measurement.
d. The Reigis Steel Division is a separate investment center within Raddington Industries. Identify several items that Reigis should control if it is to be evaluated fairly by either the ROI or RI performance measurement.
20.66 Ethical considerations. Investment center managers are often subjected to substantial pressures to meet or exceed a target ROl. In some situations, managers are able to achieve the target ROI by “cooking the books.”
Required:
a. Define “cooking the books” and list ways that it can be performed.
b. Discuss the ethical ramifications of not adhering to ethical accounting policies and procedures.
c. Discuss the pros and cons of exerting pressures on investment center managers to meet or exceed a target ROI.
20.67 Calculating ROI and RI and comparing their results. Lawton Industries has manufactured prefabricated houses for over 20 years. The houses are constructed in sections to be assembled on customers' lots.
Lawton expanded into the precut housing market in 20X0 when it acquired Presser Company, one of its suppliers. In this market, various types of lumber are precut into the appropriate lengths, banded into packages, and shipped to customers' lots for assembly. Lawton decided to maintain Presser's separate identity and, thus, established the Presser Division as an investment center of Lawton.
Lawton uses return on average investment (ROI) as a performance measure with investment defined as operating assets employed. Management bonuses are based in part on ROI. All investments in operating assets are expected to earn a minimum return of 15% before income taxes.
Presser's ROl has ranged from 19.3% to 22.1 % since it was acquired in 20X0. Presser had an investment opportunity in 20X5 that had an estimated ROl of 18%. Presser's management decided against the investment because it believed the investment would decrease the division's overall ROI.
The 20X5 operating statement for Presser Division follows. The division's operating assets employed were $12,600,000 at the end of 20X5, a 5% increase over the 20X4 year-end balance.
|
Presser Division Operating Statement for The Year Ended December 31, 20X5 ($000 Omitted) |
|
|
|
Sales revenue |
|
$24,000 |
|
Cost of goods sold |
|
15,800 |
|
Gross profit |
|
$ 8,200 |
|
Operating expenses: Administrative |
$2,140 |
|
|
Selling |
3,600 |
5,740 |
|
income from operations before income taxes |
|
$ 2,460 |
Required:
a. Calculate the following performance measures for 20X5 for the Presser Division of Lawton industries:
1. Return on average investment in operating assets employed (ROI).
2. Residual income calculated on the basis of average operating assets employed.
b. Would the management of Presser Division have been more likely to accept the investment opportunity in 20X5 if RI had been used as a performance measure instead of ROI? Explain your answer.
c. The Presser Division is a separate investment center within Lawton Industries. Identify the items Presser must control if it is to be evaluated fairly by either the ROI or RI performance measure.
20.68 Contribution margin volume variance. The following information is available for the Mitchelville Products Company for the month of July:
|
|
Flexible budget |
Actual |
|
Units |
4,000 |
3,800 |
|
Sales revenue |
$60,000 |
$53,200 |
|
Variable manufacturing costs |
$16,000 |
$19,000 |
|
Fixed manufacturing costs |
$15,000 |
$16,000 |
|
Variable selling and administrative expense |
$8,000 |
$7,600 |
|
Fixed selling and administrative expense |
$9,000 |
$10,000 |
Required: Calculate the contribution margin volume variance for July. [CMA adapted]
20.69 Sales price variance. Actual and budgeted information about the sales of a product for June are as follows:
|
|
Actual |
Budget |
|
Units |
8,000 |
10,000 |
|
Sales revenue |
$92,000 |
$105,000 |
Required: Calculate the sales price variance for June.
THINK-TANK PROBLEMS
Although these problems are based on chapter material, reading extra material, reviewing previous chapters, and using creativity may be required to develop workable solutions.
20.70 Converting from absorption costing to variable costing. The Daniels Tool & Die Corporation has been in existence for a little over three years; sales have been increasing each year as Daniels builds a reputation. The company manufactures dies to its customers' specifications; as a consequence, it uses a job order cost system. Factory overhead is applied to the jobs based on direct labor hours, utilizing the absorption costing method. Over- or underapplied overhead is treated as an adjustment to cost of goods sold. The company's income statements for the last two years are as follows:
|
Daniels Tool & Die Corporation 19x6-19x7 Comparative Income Statements |
19x6 |
19x7 |
|
Sales |
$840,000 |
$1,015,000 |
|
Cost of goods sold: Finished goods, 1/1 |
25,000 |
18,000 |
|
Cost of goods manufactured |
548,000 |
657,600 |
|
Total available |
$573,000 |
$ 675,600 |
|
Finished goods, 12/31 |
18,000 |
14,000 |
|
Cost of goods sold before overhead adjustment |
$555,000 |
$ 661,600 |
|
Underapplied factory overhead |
36,000 |
14,400 |
|
Cost of goods sold |
$591,000 |
$ 676,000 |
|
Gross profit |
$249,000 |
$ 339,000 |
|
Selling expenses |
82,000 |
95,000 |
|
Administrative expenses |
70,000 |
75,000 |
|
Total operating expenses |
152,000 |
170,000 |
|
Operating income |
$ 97,000 |
$ 169,000 |
|
|
Daniels Tool & Die Corporation inventory balance |
||
|
|
1/1/x6 |
12/31/x6 |
12/31/x7 |
|
Raw material |
$22,000 |
$30,000 |
$10,000 |
|
Work-in-process: Costs |
$40,000 |
$48,000 |
$64,000 |
|
Direct labor hours |
1,335 |
1,600 |
2,100 |
|
Finished goods: Costs |
$25,000 |
$18,000 |
$14,000 |
|
Direct labor hours |
1,450 |
1,050 |
820 |
Daniels used the same predetermined overhead rate (POR) in applying overhead to production orders in both 19X6 and 19X7. The rate was based on the following estimates:
Fixed factory overhead $25,000 Variable factory overhead $155,000 Direct labor hours 25,000 Direct labor costs $150,000
In 19X6 and 19X7, actual direct labor hours expended were 20,000 and 23,000, respectively. Raw materials put into production were $292,000 in 19X6 and $370,000 in 19X7. Actual fixed overhead was $37,400 for 19X7 and $42,300 for 19X6, and the planned direct labor rate was the direct labor rate achieved.
For both years, all of the reported administrative costs were fixed, while the variable portion of the reported selling expenses results from a commission of 5% of sales revenue.
Required:
a. For the year ended December 31, 19X7, prepare a revised income statement for Daniels Tool & Die Corporation utilizing the variable costing method. Be sure to include the contribution margin on your statement.
b. Prepare a numerical reconciliation of the difference in operating income between Daniels Tool & Die Corporation's 19X7 income statement prepared on the basis of absorption costing and the revised 19X7 income statement prepared on the basis of variable costing.
c. Describe both the advantages and disadvantages of using variable costing. [CMA adapted]
20.71 Reporting operating costs by segments. The Scent Company sells men's toiletries to retail stores throughout the United States. For planning and control purposes, the Scent Company is organized into 12 geographic regions with two to six territories within each region. One salesperson is assigned to each territory and has exclusive rights to all sales made in that territory. Merchandise is shipped from the manufacturing plant to the 12 regional warehouses, and the sales in each territory are shipped from the regional warehouse. National headquarters allocates a specific amount at the beginning of the year for regional advertising.
The net sales for the Scent Company for the year ended September 20, 19X4, totaled $10 million. Costs incurred by national headquarters for national administration, advertising, and warehousing are:
|
National administration |
$250,000 |
|
National advertising |
125,000 |
|
National warehousing |
175,000 |
|
|
$550,000 |
The results of operations for the South Atlantic Region for the year ended September 30, 19X4, are as follows:
|
Scent Company South Atlantic Region Statement Of Operations for The Year Ended September 30, 19x4 |
||
|
Net Sales |
|
$900,000 |
|
Costs and expenses: Advertising fees |
$ 54,700 |
|
|
Bad debt expense |
3,600 |
|
|
Cost of sales |
460,000 |
|
|
Freight-out |
22,600 |
|
|
Insurance |
10,000 |
|
|
Salaries and employee benefits |
81,600 |
|
|
Sales commissions |
36,000 |
|
|
Supplies |
12,000 |
|
|
Travel and entertainment |
14,100 |
|
|
Wages and employee benefits |
36,000 |
|
|
Warehouse depreciation |
8,000 |
|
|
Warehouse operating costs |
15,000 |
|
|
Total costs and expenses |
|
753,600 |
|
Territory contribution |
|
$146,400 |
The South Atlantic Region consists of two territories-Green and Purple. The salaries and employee benefits consist of the following items:
|
Regional vice president |
$24,000 |
|
Regional marketing manager |
15,000 |
|
Regional warehouse manager |
13,400 |
|
Sales personnel (one for each territory with each receiving the same base salary) |
15,600 |
|
Employee benefits (20%) |
13,600 |
|
|
$81,600 |
The sales personnel receive a base salary plus a 4% commission on all items sold in their territory. Bad debt expense has averaged 0.4% of net sales in the past. Travel and entertainment costs are incurred by sales personnel calling upon their customers. Freight-out is a function of the quantity of goods shipped and the distance shipped. Thirty percent of the insurance is expended for protection of the inventory while it is in the regional warehouse, and the remainder is incurred for the protection of the warehouse. Supplies are used in the warehouse for packing the merchandise that is shipped. Wages relate to the hourly paid employees who fill orders in the warehouse. The warehouse operating costs account contains such costs as heat, light, and maintenance.
The following cost analyses and statistics by territory for the current year are representative of past experience and are representative of expected future operations:
|
|
|
By Territory |
|
|
Cost Analysis |
Green |
Purple |
Total |
|
Sales |
$300,000 |
$600,000 |
$900,000 |
|
Cost of sales |
$184,000 |
$276,000 |
$460,000 |
|
Advertising fees |
$21,800 |
$32,900 |
$54,700 |
|
Travel and entertainment |
$6,300 |
$7,800 |
$14,100 |
|
Freight-out |
$9,000 |
$13,600 |
$22,600 |
|
Units sold |
150,000 |
350,000 |
500,000 |
|
Pounds shipped |
210,000 |
390,000 |
600,000 |
|
Sales personnel miles travelled |
21,600 |
38,400 |
60,000 |
Required:
a. The top management of Scent Company wants the regional vice presidents to present their operating data in a more meaningful manner. Therefore, management has requested that the regions separate their operating costs into the fixed and variable components of order getting, order filling, and administration. The data are to be presented in the following format:
|
|
Territory Costs |
|
||
|
|
Green |
Purple |
Regional Costs |
Total Costs |
|
Order getting Order filling Administration |
|
|
|
|
Using management's suggested format, prepare a schedule that presents the costs for the region by territory with the costs separated into variable and fixed categories by order getting, order filling, and administrative functions.
b. Suppose the top management of Scent Company is considering splitting the Purple Territory into two separate territories (Red and Blue). From the data that have been presented, identify what data would be relevant to this decision (either for or against), and indicate what other data you would collect to aid top management in its decision. [CMA adapted]
20.72 Segment reporting and ethical considerations. Pittsburgh-Walsh Company (PWC) is a manufacturing company whose product line consists of lighting fixtures and electronic timing devices. The Lighting Fixtures Division assembles units for the upscale and mid-range markets. The Electronic Timing Devices Division manufactures instrument panels that allow electronic systems to be activated and deactivated at scheduled times for both efficiency and safety purposes. Both divisions operate out of the same manufacturing facilities and share production equipment.
PWC's budget for the year ending December 31, 19X0, is as follows:
|
Pittsburgh-Walsh Company Budget For The year Ended December 31, 19x0 ($000) |
||||
|
|
Lighting Fixtures |
|
|
|
|
|
Upscale |
Mid-range |
Electronic timing Devices |
Totals |
|
Sales |
$1,440 |
$770 |
$800 |
$3,010 |
|
Variable expenses: Cost of goods sold |
720 |
439 |
320 |
1,479 |
|
Selling and administrative |
170 |
60 |
60 |
290 |
|
Contribution margin |
550 |
271 |
420 |
1,241 |
|
Fixed overhead expenses |
140 |
80 |
80 |
300 |
|
Segment margin |
410 |
191 |
340 |
941 |
|
Common fixed expenses: Overhead |
48 |
132 |
120 |
300 |
|
Selling and administrative |
1 1 |
31 |
28 |
70 |
|
Net income (loss) |
$ 351 |
$ 28 |
$192 |
$ 571 |
The budget was prepared on a business segment basis under the following guide-lines:
• Variable expenses are directly assigned to the incurring division.
• Fixed overhead expenses are directly assigned to the incurring division.
• Common fixed expenses are allocated to the divisions on the basis of units produced that bear a close relationship to direct labor. Included in common fixed expenses are costs of the corporate staff, legal expenses, taxes, staff marketing, and advertising.
• The production plan is for 8,000 upscale fixtures, 22,000 mid-range fixtures, and 20,000 electronic timing devices.
PWC established a bonus plan for division managers that requires them to meet the budget's planned net income by product line, with a bonus increment if the division exceeds the planned product line net income by 10% or more.
Shortly before the year began, the CEO, Jack Parkow, suffered a heart attack and retired. After reviewing the 19X0 budget, the new CEO, Joe Kelly, decided to close the lighting fixtures mid-range product line by the end of the first quarter and use the available production capacity to grow the remaining two product lines. The marketing staff advised that electronic timing devices could grow by 40% with increased direct sales support. Increases above that level and increased sales of upscale lighting fixtures would require expanded advertising expenditures to increase consumer awareness of PWC as an electronics and upscale lighting fixture company. Kelly approved the increased sales support and advertising expenditures to achieve the revised plan. Kelly advised the divisions that for bonus purposes the original product line net income objectives must be met, but he did allow the Lighting Fixtures Division to combine the net income objectives for both product lines for bonus purposes.
Prior to the close of the fiscal year, the division controllers were furnished with preliminary actual data for review and adjustment, as appropriate. These preliminary year-end data reflect the revised units of production amounting to 12,000 upscale fixtures, 4,000 mid-range fixtures, and 30,000 electronic timing devices and are as follows:
|
Pittsburgh-walsh Company Preliminary Actuals for The Year Ended December 31, 19x0 ($000) |
||||
|
|
Lighting Fixtures |
Electronic timing Devices |
|
|
|
|
Upscale |
Mid-range |
Totals |
|
|
Sales |
$2,160 |
$140 |
$1,200 |
$3,500 |
|
Variable expenses: Cost of goods sold |
1,080 |
80 |
480 |
1,640 |
|
Selling and administrative |
260 |
11 |
96 |
367 |
|
Contribution margin |
820 |
49 |
624 |
1,493 |
|
Fixed overhead expenses |
140 |
14 |
80 |
234 |
|
Segment margin |
680 |
35 |
544 |
1,259 |
|
Common fixed expenses: Overheads |
78 |
27 |
195 |
300 |
|
Selling and administrative |
60 |
20 |
150 |
230 |
|
Net income (loss) |
$ 542 |
$<12> |
$ 200 |
$ 729 |
The controller of the Lighting Fixtures Division, anticipating a similar bonus plan for 19X1, is contemplating deferring some revenues into the next year on the pretext that the sales are not yet final, and accruing in the current year expenditures that will be applicable to the first quarter of 19X1. The corporation would meet its annual plan, and the division would exceed the 10% incremental bonus plateau in the year 19X0 despite the deferred revenues and accrued expenses contemplated.
Required:
a.
1. Outline the benefits that an organization realizes from segment reporting.
2. Evaluate segment reporting on a variable cost basis versus an absorption cost basis.
b.
1. Segment reporting can be developed based on different criteria. What criteria must be present for division management to accept being evaluated on a segment basis?
2. Why would the management of the Electronics Timing Devices Division be unhappy with the current reporting, and how should the reporting be revised to gain their acceptance?
c. Explain why the adjustments contemplated by the controller of the Lighting Fixtures Division are unethical by citing the specific standard of competence, confidentiality, integrity, and/or objectivity from the Standards of Ethical Conduct for Management Accountants. [CMA adapted]
20.73 Identifying responsibilities and evaluating performance. Sarah Johnson was hired on July 1, 2002, as assistant general manager of the Botel Division of Staple, Inc. It was understood that she would be elevated to general manager of the division on January 1, 2004, when the then current general manager retired, and Johnson was duly promoted as planned. In addition to becoming acquainted with the division and the general manager's duties, Johnson was specifically charged with the responsibility for developing the 2003 and 2004 budgets. As general manager in 2004, she was, obviously, responsible for the 2005 budget.
Staple is a multiproduct company that is highly decentralized. Each division is quite autonomous. The corporation staff approves division-prepared operating budgets but seldom makes major changes in them. The corporation staff actively participates in decisions requiring capital investment (for expansion or replacement) and makes the final decisions. The division management is responsible for implementing the capital program. The major method used by Staple to measure division performance is contribution return on division net investment. The budgets that follow were approved by the corporation. Revision of the 2005 budget is not considered necessary even though 2004 actual departed from the approved 2004 budget.
|
Botel Division ($000) |
|||||
|
|
Actual |
Budget |
|||
|
Accounts |
2002 |
2003 |
2004 |
2004 |
2005 |
|
Sales |
$1,000 |
$1,500 |
$1,800 |
$2,000 |
$2,400 |
|
Less division variable costs: Material and labor |
250 |
375 |
450 |
500 |
600 |
|
Repairs |
50 |
75 |
50 |
100 |
120 |
|
Supplies |
20 |
30 |
36 |
40 |
48 |
|
Less division managed costs: Employee training |
30 |
35 |
25 |
40 |
45 |
|
Maintenance |
50 |
55 |
40 |
60 |
70 |
|
Less division committed costs: Depreciation |
120 |
160 |
160 |
200 |
200 |
|
Rent |
80 |
100 |
110 |
140 |
140 |
|
Total |
600 |
830 |
871 |
1,080 |
1,223 |
|
Division net contribution |
$ 400 |
$ 670 |
$ 929 |
$ 920 |
$1,177 |
|
Division investment: Accounts receivable |
100 |
150 |
180 |
200 |
240 |
|
Inventory |
200 |
300 |
270 |
400 |
480 |
|
Fixed assets |
1,590 |
2,565 |
2,800 |
3,380 |
4,000 |
|
Less accounts and wages payable |
<150> |
<225> |
<350> |
<300> |
<360> |
|
Net investment |
$1,740 |
$2,790 |
$2,900 |
$3,680 |
$4,360 |
|
Contribution return on net investment |
23% |
24% |
32% |
25% |
27% |
Required:
a. Identify Sarah Johnson's responsibilities under the management and measurement program described above.
b. Appraise Sarah Johnson's performance in 2004.
c. Based upon your analysis, what changes would you recommend to the president in the responsibilities assigned to managers or in the measurement methods used to evaluate division management? [CMA adapted]
20.74 Explaining unfavorable variance between budgeted and actual contribution margin. Funtime Inc. manufactures video game machines. Market saturation and technological innovations have caused pricing pressures that have resulted in declining profits. To stem the slide in profits until new products can be introduced, top management has turned its attention to both manufacturing economies and increased production. To realize these objectives, an incentive program has been developed to reward production managers who contribute to an increase in the number of units produced and effect cost reductions.
The production managers have responded to the pressure of improving manufacturing in several ways that have resulted in increased completed units over normal production levels. The video game machines are put together by the Assembly Group, which requires parts from both the Printed Circuit Boards (PCB) and the Reading Heads (RH) groups. To attain increased production levels, the PCB and RH groups began rejecting parts that previously would have been tested and modified to meet manufacturing standards. Preventive maintenance on machines used in the production of these parts has been postponed with only emergency repair work being performed to keep production lines moving. The Maintenance Department is concerned that there will be serious breakdowns and unsafe operating conditions.
The more aggressive Assembly Group production supervisors have pressured maintenance personnel to attend to their machines at the expense of other groups. This has resulted in machine downtime in the PCB and RH groups, which, when coupled with demand for accelerated parts delivery by the Assembly Group, has led to more frequent parts rejections and increased friction among departments.
Funtime operates under a standard cost system. The standard costs for video game machines are as follows:
|
|
Standard Cost Per Unit |
||
|
Cost Item |
Quantity |
Cost |
Total |
|
Direct materials: Housing unit |
1 |
$20 |
$ 20 |
|
Printed circuit boards |
2 |
15 |
30 |
|
Reading heads |
4 |
10 |
40 |
|
Direct labor: Assembly Group |
2 hours |
8 |
16 |
|
PCB group |
1 hour |
9 |
9 |
|
RH group |
1.5 hours |
10 |
15 |
|
Variable overhead |
4.5 hours |
2 |
9 |
|
Total standard cost per unit |
|
$139 |
|
Funtime prepares monthly performance reports based on standard costs. The following is the contribution report for May 19X4, when production and sales both reached 2,200 units:
|
|
Funtime, Inc. Contribution Report For The Month Of May 19x4 |
|
|
|
|
Budget |
Actual |
Variance |
|
Units |
2,000 |
2,200 |
200 F |
|
Revenue |
$400,000 |
$440,000 |
$40,000 F |
|
Variable costs: Direct materials |
180,000 |
220,400 |
<40,400> U |
|
Direct labor |
80,000 |
93,460 |
<13,460> U |
|
Variable overhead |
18,000 |
18,800 |
<800> U |
|
Total variable costs |
278,000 |
332,660 |
<54,660> U |
|
Contribution margin |
$122,000 |
$107,340 |
<$14,660> U |
Funtime's top management was surprised by the unfavorable contribution to overall corporate profits in spite of the increased sales in May. Jack Rath, cost accountant, was assigned to identify and report on the reasons for the unfavorable contribution results as well as the individuals or groups responsible. After review, Rath prepared the following usage report:
|
Funtime, Inc. Usage report for The Month of May 19x4 |
||
|
Cost Item |
Quantity |
Actual Cost |
|
Direct materials: Housing units |
2,200 units |
$ 44,000 |
|
Printed circuit boards |
4,700 units |
75,200 |
|
Reading heads |
9,200 units |
101,200 |
|
Direct labor: Assembly |
3,900 hours |
31,200 |
|
Printed circuit boards |
2,500 hours |
23,760 |
|
Reading heads |
3,500 hours |
38,500 |
|
Variable overhead |
9,900 hours |
18,800 |
|
Total variable cost |
|
$332,660 |
Rath reported that the PCB and RH groups supported the increased production levels but experienced abnormal machine downtime, causing workers to be idle and necessitating the use of overtime to keep up with the accelerated demand for parts. The idle time was charged to direct labor. Rath also reported that the production managers of these two groups resorted to parts rejections, as opposed to testing and modification procedures formerly applied. Rath determined that the Assembly Group met management's objectives by increasing production while using lower than standard hours.
Required:
a. For May 19X4, Funtime's labor rate variance was $5,660 unfavorable, and the labor efficiency variance was $200 favorable. By using these two variances and calculating the following variances, prepare an explanation of the $14,660 unfavorable variance between budgeted and actual contribution margin during May 19X4.
1. Materials price variance.
2. Materials quantity (usage) variance.
3. Variable overhead efficiency variance.
4. Variable overhead spending variance.
5. Contribution margin volume variance.
b.
1. Identify and briefly explain the behavioral factors that may promote friction among the production managers and between the production managers and the maintenance manager.
2. Evaluate Jack Rath's analysis of the unfavorable contribution results in terms of its completeness and its effects on the behavior of the production groups. [CMA adapted]
20.75 Evaluating the budget process and return on assets for planning and control. Clarkson Company is a large multidivision firm with several plants in each division. A comprehensive budgeting system is used for planning operations and measuring performance. The annual budgeting process starts in August, five months prior to the beginning of the fiscal year. At this time, the division managers submit proposed budgets for sales, production and inventory levels, and expenses. Capital expenditure requests also are formalized at this time. The expense budgets include direct labor and all overhead items that are separated into fixed and variable components. Direct materials are budgeted separately in developing the production and inventory schedules.
The expense budgets for each division are developed from its plants' results, as measured by the percentage variation from an adjusted budget in the first six months of the current year and a target expense reduction percentage established by the corporation.
To determine plant percentages, the plant budget for the just completed half-year period is revised to recognize changes in operating procedures and costs outside the control of plant management (e.g., labor wage rate changes, product style changes, and so forth). The difference between this revised budget and the actual expenses is the controllable variance and is expressed as a percentage of the actual expenses. This percentage is added (if unfavorable) to the corporate target expense reduction percentage. A favorable plant variance percentage is subtracted from the corporate target. If a plant had a 2 % unfavorable controllable variance and the corporate target reduction was 4%, the plant's budget for the next year should reflect costs approximately 6% below this year's actual costs.
Next year's final budgets for the corporation, the divisions, and the plants are adopted after corporate analysis of the proposed budgets and a careful review with each division manager of the changes made by corporate management. Division profit budgets include allocated corporate costs, and plant profit budgets include allocated division and corporate costs.
Return on assets is used to measure the performance of divisions and plants. The asset base for a division consists of all assets assigned to the division, including its working capital, and an allocated share of corporate assets. For plants, the asset base includes the assets assigned to the plant plus an allocated portion of the division and corporate assets. Recommendations for promotions and salary increases for the executives of the divisions and plants are influenced by how well the actual return on assets compares with the budgeted return on assets.
The plant managers exercise control only over the cost portion of the plant profit budget because the divisions are responsible for sales. Only limited control over the plant assets is exercised at the plant level.
The manager of the Dexter Plant, a major plant in the Huron Division, carefully controls his costs during the first six months so that any improvement appears after the target reduction of expenses is established. He accomplishes this by careful planning and timing of his discretionary expenditures.
During 2004, the property adjacent to the Dexter Plant was purchased by Clarkson Company. This expenditure was not included in the 2004 capital budget. Corporate management decided to divert funds from a project at another plant since the property appeared to be a better long-term investment.
Also during 2004, Clarkson Company experienced depressed sales. In an attempt to achieve budgeted profit, corporate management announced in August that all plants were to cut their annual expenses by 6%. In order to accomplish this expense reduction, the Dexter Plant manager reduced preventive maintenance and postponed needed major repairs. Employees who quit were not replaced unless absolutely necessary. Employee training was postponed whenever possible. The raw materials, supplies, and finished goods inventories were reduced below normal levels.
Required:
a. Evaluate the budget procedure of Clarkson Company with respect to its effectiveness for planning and controlling operations.
b. Is the Clarkson Company's use of return on assets to evaluate the performance of the Dexter Plant appropriate? Explain your answer.
c. Analyze and explain the Dexter Plant manager's behavior during 2004. [CMA adapted]
20.76 Evaluating ROA as a single performance measurement. The Motor Works Division of Roland Industries is located in Fort Wayne, Indiana. A major expansion of the division's only plant was completed in April 20X4. The expansion consisted of an addition to the existing building, additional new equipment, and the replacement of obsolete and fully depreciated equipment that was no longer efficient or cost-effective.
Donald Futak became the manager of the Motor Works Division, effective May 1, 20X4. Futak had a brief meeting with John Poskey, vice president of operations for Roland industries, when he assumed the division manager position. Poskey told Futak that the company employed return on gross assets (ROA) for measuring performance of divisions and division managers. Futak asked whether any other performance measures were ever used in place of or in conjunction with ROA. Poskey replied, “Roland's top management prefers to use a single performance measure. There is no conflict when there is only one measure. Motor Works should do well this year now that it has expanded and replaced all of that old equipment. You should have no problem exceeding the division's historical rate. I'll check back with you at the end of each quarter to see how you are doing.”
Poskey called Futak after the first quarter results were complete because the Motor Works' ROA was considerably below the historical rate for the division. Futak told Poskey at that time that he did not believe that ROA was a valid performance measure for the Motor Works Division. Poskey indicated that he would get back to Futak. Futak did receive perfunctory memorandums after the second and third quarters, but there was no further discussion on the use of ROA. Now Futak has received the following memorandum:
May 24, 20X5
TO: Donald Futak, Manager-Motor Works Division
FROM: John Poskey, Vice President of Operations
SUBJECT: Division Performance
The operating results for the fourth quarter and for our fiscal year ended on April 30 are now complete. Your fourth quarter return on gross assets was only 9%, resulting in a return for the year of slightly under 11%. I recall discussing your low return after the first quarter and reminding you after the second and third quarters that this level of return is not considered adequate for the Motor Works Division.
The return on gross assets at Motor Works has ranged from 15% to 18% for the past five years. An 11% return may be acceptable at some of Roland's other divisions, but not at a proven winner like Motor Works-especially in light of your recently improved facility.
I would like to meet with you at your office on Monday, June 3, to discuss ways to restore Motor Works' return on gross assets to its former level. Please let me know if this date is acceptable to you.
Futak is looking forward to meeting with Poskey. He knows the division's ROA is below the historical rate, but the dollar profits for the year are greater than prior years. He plans to explain to Poskey why he believes return on gross assets is not an appropriate performance measure for the Motor Works Division. He also plans to recommend that ROA be replaced with three measures-dollar profit, receivables turnover, and inventory turnover. These three measures would constitute a set of multiple criteria that would be used to evaluate performance.
Required:
a. On the basis of the relationship between John Poskey and Donald Futak, as well as the memorandum from Poskey, identify apparent weaknesses in the performance evaluation process of Roland Industries. Do not include in your answer any discussion on the use of return on assets (ROA) as a performance measure.
b. From the information presented, identify a possible explanation of why Motor Works Division's ROA declined in the fiscal year ended April 30, 20X5.
c. Identify criteria that should be used in selecting performance measures to evaluate operating managers.
d. If John Poskey does agree to use multiple criteria for evaluating the performance of the Motor Works Division as Donald Futak has suggested, discuss whether the multiple criteria of dollar profit, receivables turnover, and inventory turnover would be appropriate. [CMA adapted]
20.77 Eliminating dysfunctional behavior. Wright Company employs a computerbased data processing system for maintaining all company records. The present system was developed in stages over the past five years and has been fully operational for the last 24 months.
When the system was being designed, all department heads were asked to specify the types of information and reports they would need for planning and controlling operations. The Systems Department attempted to meet the specifications of each department head. Company management specified that certain other reports be prepared for department heads. During the five years of systems development and operations, there have been several changes in the department head positions due to attrition and promotions. The new department heads often requested additional reports according to their specifications. The Systems Department complied with all of these requests. Reports were discontinued only upon request by a department head, and then only if it was not a standard report required by top management. As a result, few reports were in fact discontinued. Consequently, the data processing system was generating a large quantity of reports each reporting period.
Company management became concerned about the quantity of information that was being produced by the system. The Internal Audit Department was asked to evaluate the effectiveness of the reports generated by the system. The audit staff determined early in the study that more information was being generated by the data processing system than could be used effectively. They noted the following reactions to this information overload:
1. Many department heads would not act on certain reports during periods of peak activity. The department head would let these reports accumulate with the hope of catching up during a subsequent lull.
2. Some department heads had so many reports that they either did not act at all upon the information or made incorrect decisions because they misused the information.
3. Frequently, report data would indicate a need for action, but nothing would be done until the department head was reminded by someone who needed the decision. These department heads did not appear to have developed a priority system for acting on the information produced by the data processing system.
4. Department heads often would develop the information they needed from alternative, independent sources, rather than utilizing the reports generated by the data processing system. This was often easier than trying to search among the reports for the needed data.
Required:
a. Indicate, for each of the observed reactions, whether they are functional or dysfunctional behavioral responses. Explain your answer in each case.
b. Assuming one or more of the responses were dysfunctional, recommend procedures the company could employ to eliminate the dysfunctional behavior and to prevent its recurrence. [CMA adapted]