Chapter 24 : Capital Project Implementation Management
Learning Objectives
After studying this chapter, you should be able to:
1. Describe the Gantt chart and its use.
2. Use the program evaluation and review technique (PERT) as a project management and modeling tool.
3. Explain why an implementation audit is conducted.
4. Discuss the reason for conducting a postimplementation audit, and describe the tools used in conducting such an audit.
Introduction
The capital projects selected in the second stage of the capital budgeting methodology are built by a contractor; purchased from a vendor, such as a manufacturer of production equipment; or developed internally, such as an information system with various hardware (e.g., computers and telecommunications equipment) being purchased from vendors. In any case, the actual development and implementation of such projects often takes months or years to complete and requires sound project management. The aim of the project manager is threefold:
• To coordinate people and activities
• To keep the project progressing on schedule
• To control project costs
According to some authorities, projects that are completed on time but over budget are 140 percent more profitable than projects that are completed on budget but six months late. For this reason, some companies and government entities give early-completion bonuses to project teams or contractors that complete their projects ahead of schedule. Consequently, accurately estimating a project's completion date and completing the project on or before that date are a vital part of project management.1
There are several professional designations directed at project management. The oldest and most well known is the PMP (Project Management Professional) designation offered by the Project Management Institute (PMI, www.pmi.org). The PM designation includes extensive coursework and 5 years of full-time project management experience!
There are a number of tools that can be used to help project management. One of the most recent is an extension of PERT called the “Critical Chain” method. Although it is beyond the scope of this chapter, those of you interested in project management should take a look at it. This chapter begins by describing two popular project management tools used by project managers:
• Gantt chart
• Program evaluation and review technique (PERT)2
Next, the process of auditing a capital project while it is being developed is examined. The last section of the chapter treats postimplementation auditing, the fourth and final phase of the capital budgeting methodology.
GANTT CHART
LEARNING OBJECTIVE 1
Describe the Gantt chart and its use.
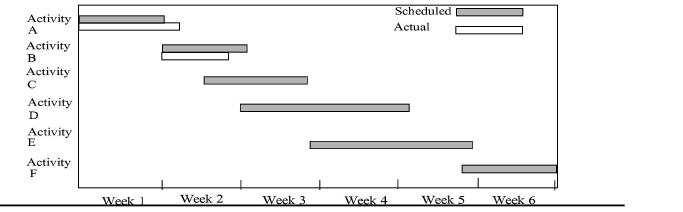
The Gantt chart, named after its developer Henry Gantt, is a bar chart that shows activities (also called tasks or phases) on the left side and units of time (e.g., days, weeks, and months) across the top or bottom, as shown in Exhibit 24-1. The letter “C” at the end of the “Actual” bar means that the activity is complete.
How to Construct a Gantt Chart
Gantt charts are simple to construct and use. To develop a Gantt chart, the project is divided into logical activities, and the start and completion times are estimated for each activity. Then, a bar chart is prepared showing each activity as a horizontal bar along a time scale. The bar representing each activity runs from the start date to the completion date for that activity.
|
INSIGHTS & APPLICATIONS How Big Is It? The International Falls, Minnesota, capital project is so large that it's hard to comprehend. The building that houses the new paper machine is almost three football fields long and as tall as an eight-story building; the paper machine itself is over two football fields long.The equipment and materials for the entire expansion—about 1.5 million separate pieces, which would have filled tractor-trailers lined up for almost 20 miles—came from suppliers in 41 U.S. states and eight foreign countries. Huge amounts of materials were required to complete the project: • Concrete—enough for 409 miles of sidewalk • Steel—10,800 tons (enough to make over 14,000 mid-size automobiles) |
• Pipe-70 miles with almost 30,000 valves, fittings, and inserts • Wiring-663 miles (equivalent to almost 10,000 miles of household extension cord)
Similarly, huge amounts of power and materials are used to run the paper machine and the associated pulp production facilities: • Horsepower- 70,000 horsepower (enough to power 800 automobiles) • Steam-enough to heat about 50,000 average homes each day • Water-28 million gallons a day (enough to supply 47,000 homes per day) • Wood chips-300,000 cubic feet a day (would make a pile that is 1 foot wide, 1 foot high, and 57 miles long) a |
|
aAdapted from “World-Class Act,” Insight (Boise, Idaho: Published by the Corporate Communications Department for Boise Cascade, May 1991), pp. 2 and 3. |
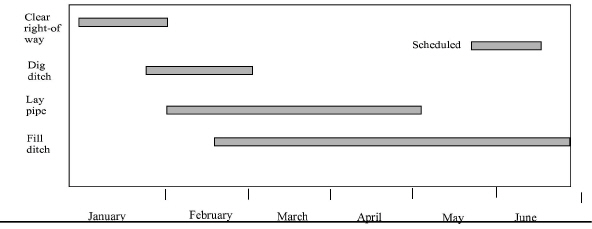
Interstate Gas Company's capital project calls for a pipeline to be laid from a source of natural gas to plant A. A Gantt chart for this project is illustrated in Exhibit 24-2. Once the pipeline project begins, the Gantt chart will be used to compare estimated performance against actual performance to determine whether the pipeline project is ahead of, behind, or on schedule
|
Advantages of the Gantt Chart
An important advantage of the Gantt chart is its simplicity. People can quickly and easily comprehend a schedule for the entire project. The chart forces the project manager to think ahead and define activities. As the project progresses, actual completion times can be compared to estimated times. This project management tool requires no special devices or mathematics and can be used on small projects as well as large ones.
|
INSIGHTS & APPLICATIONS Help for Managing Projects Project management tools provide the power to maximize the capital budgeting methodology and move capital projects forward effectively and efficiently. Computerized project management tools automate scheduling to maintain peak efficiency throughout the project life cycle. Using work planning features, project managers can customize the work plan online, set tracking levels, and indicate task responsibilities. |
Window-based packages make project management tools such as Gantt and PERT (program evaluation and review technique) charts easy to view and manipulate. Mike Brown, a manager at Walt Disney, credits project management software with saving the day for a significant project that involved downsizing a mainframe application. “The project would have fallen apart if we hadn’t watched it like a hawk,” says Brown. “Our staff found that a user-friendly project management package made the difference in getting the system completed on time.”a |
|
aAdapted from Lance B. Eliot, “Off-the-Shelf Help for Downsizing Jobs,” Corporate Computing, p. 30. |
|
Activities |
Estimated time |
|
|
|
Start |
Complete |
|
•Clear right-of-way |
January 1 |
February 1 |
|
•Dig ditch |
January 15 |
March 1 |
|
•Lay pipe |
January 31 |
April 30 |
|
•Fill ditch |
February 15 |
June 30 |
|
||
Program Evaluation And Review Technique
LEARNING OBJECTIVE 2
Use the program evaluation and review technique (PERT) as a project management and modeling tool.
The program evaluation and review technique (PERT) is used to estimate, schedule, and manage a network of interdependent project activities. It is especially useful for managing large-scale, complex projects. In the past, PERT was more sophisticated than Gantt, because it incorporated probabilities, identified critical activities, and showed interdependencies among all activities. Today, computer-based Gantt systems include similar features.
Introducing Key Terms
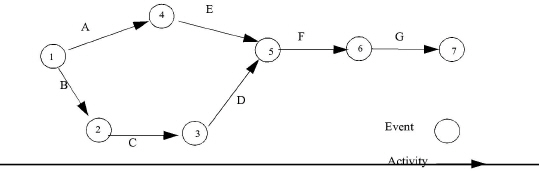
Before presenting the steps for building a PERT network, it is necessary to introduce some key terms. To aid in visualizing these terms, a generic PERT network is displayed in Exhibit 24-3.
|
An event, represented by a circle, indicates either the beginning or completion of an activity. An activity (also called a task), represented by an arrow, is the work and resources necessary to go from one event to the next. Before an event can begin, all activities flowing into it must be completed. Events in the network are numbered so that the event representing the completion of an activity always has a larger number than the event representing the beginning of the activity. Some authorities designate events by letters instead of numbers. Both identification systems produce the same results, and the text and problems in this chapter will use both systems.
The project is not complete until all the activities are completed. Before a given activity can begin, other activities must be completed.3 These predecessor activities take on several forms, as shown in Exhibit 24-4. Note that activities that must occur consecutively are linked in a series, while activities that occur simultaneously are linked in parallel.
|
Activity A must be completed before Activity B can begin. Events 1 and 2 represent the beginning and completion of Activity A. Events 2 and 3 represent the beginning and completion of Activity B. |

|
|
Activities A and B must be completed before Activity C can begin. Events 1 and 3 represent the beginning and completion of Activity A. Events 2 and 3 represent the beginning and completion of Activity B. |

|
|
Activity A must be completed before Activity B or C can begin. Events 1 and 2 represent the beginning and completion of Activity A. |

|
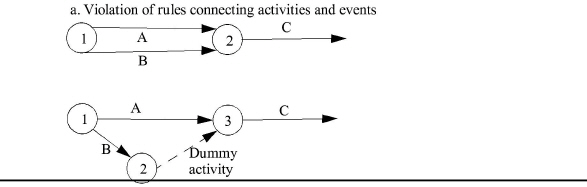
An activity can be represented by only one arrow, and two events can be connected by only one activity. These rules are violated in Exhibit 24-5a Activities A and B are both predecessors of activity C, and both can begin at the same time. But events 1 and 2 cannot be connected by more than one activity. By using a dummy activity, which takes zero time and is indicated by a dashed arrow, both A and B can be represented as predecessor activities of activity C. The network in Exhibit 24-5b ensures that event 3 cannot begin until both activities A and B are completed. With these key terms in mind, we are now ready to describe the steps for building a PERT network.
|
Steps for Building a PERT Network
Building a PERT network involves a five-step process:
Step 1. Identify and list activities.
Step 2. Determine the proper sequence of activities and activities that can be performed simultaneously.
Step 3. Build the basic PERT network.
Step 4. Calculate expected activity times.
Step 5. Find the critical path.
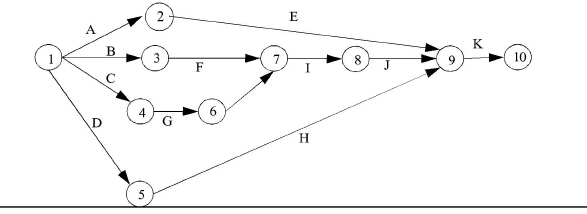
STEP 1: IDENTIFY AND LIST ACTIVITIES. The activities involved in development and implementation of a new information systems project are listed in Exhibit 24-6.
|
Activity code |
Activity description |
Immediate predecessor activity |
|
A |
Setting documentation standards |
- |
|
B |
Designing software |
- |
|
C |
Preparing site |
- |
|
D |
Selecting additional personnel |
- |
|
E |
Preparing documentation |
A |
|
F |
Coding software |
B |
|
G |
Installing equipment |
C |
|
H |
Training personnel |
D |
|
I |
Testing software |
F, G |
|
J |
Testing total system |
I |
|
K |
Converting system |
E, J, H |
STEP 2: DETERMINE THE PROPER SEQUENCE OF ACTIVITIES AND ACTIVITIES THAT CAN BE PERFORMED SIMULTANEOUSLY. The last column in Exhibit 24-6 contains the immediate predecessor activities. For example, preparing documentation should not begin before the documentation standards have been set, coding of software cannot start until the software has been designed, and so forth. Several activities may be performed simultaneously, however. For example, software can be designed while documentation standards are being set.
STEP 3: BUILD THE BASIC PERT NETWORK. Now that the activity codes and immediate predecessor activities have been established and activities that can be performed simultaneously have been identified, a basic PERT network can be constructed. The basic network is shown in Exhibit 24-7.
STEP 4: CALCULATE EXPECTED ACTIVITY TIMES. The expected activity time is the estimated duration that an activity will take. To calculate the expected activity time, the project manager and his or her staff will provide three time estimates for each activity:
• Optimistic time, which is an estimate of the activity's duration under the most favorable conditions
• Pessimistic time, which is an estimate of the activity's duration under the least favorable conditions
• Most likely time, which is an estimate of the activity's duration under normal conditions
|
The purpose in making these three time estimates is to use them to calculate a single weighted-average time for each activity, using the following formula:
Te = (O + 4M + P) / 6
where:
• T = Expected activity time
• O = Optimistic time estimate
• P = Pessimistic time estimate
• M = Most likely time estimate
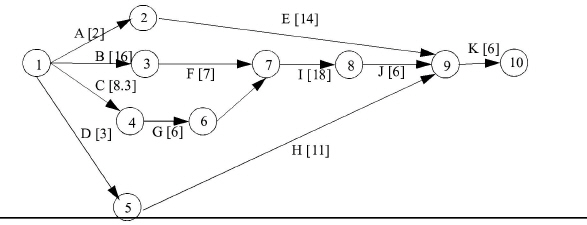
This formula is used to calculate the expected activity times in Exhibit 24-8. The beginning and ending events of each activity have been numbered to aid identification. Remember that the number of the ending event must be larger than the number of the beginning event. This convention allows the activities to be identified by an ordered pair of numbers. For example, activity B could be identified as activity 1, 3. In some computer-based PERT systems, this is the conventional way of identifying activities. The expected activity times are included in the PERT network shown in Exhibit 24-9.
|
|
Events |
Estimated times |
|
|||
|
Activity code |
Begin |
End |
Optimistic (O) |
Most likely (M) |
Pessimistic (P) |
activity Expected time (Te) |
|
A |
1 |
2 |
1 |
2 |
3 |
2 |
|
B |
1 |
3 |
8 |
15 |
28 |
16 |
|
C |
1 |
4 |
5 |
9 |
9 |
8.3 |
|
D |
1 |
5 |
1 |
3 |
5 |
3 |
|
E |
2 |
9 |
6 |
14 |
22 |
14 |
|
F |
3 |
7 |
4 |
7 |
10 |
7 |
|
G |
4 |
6 |
4 |
6 |
8 |
6 |
|
Dummy |
6 |
7 |
0 |
0 |
0 |
0 |
|
H |
5 |
9 |
5 |
10 |
21 |
11 |
|
I |
7 |
8 |
10 |
16 |
34 |
18 |
|
J |
8 |
9 |
4 |
6 |
8 |
6 |
|
K |
9 |
10 |
4 |
6 |
8 |
6 |
|
|
|
LT(2) -2 =31 |
|
|
LT(1) = min |
LT(3) - 16 = 0 |
= 0 |
|
LT(4) - 8.3 = 8.7 |
||
|
|
LT(5) - 3 = 33 |
|
Now that ET (i) and LT (i) have been calculated, the activities that have slack time and those that have zero slack time can be determined. Total slack (TS) for any activity is the maximum amount of time the activity can be delayed without affecting the completion time of the project. Subtracting ET (i) from LT (i) will give the total slack allowable for any activity, calculated as:
TS (i) = LT (i) - ET (i)
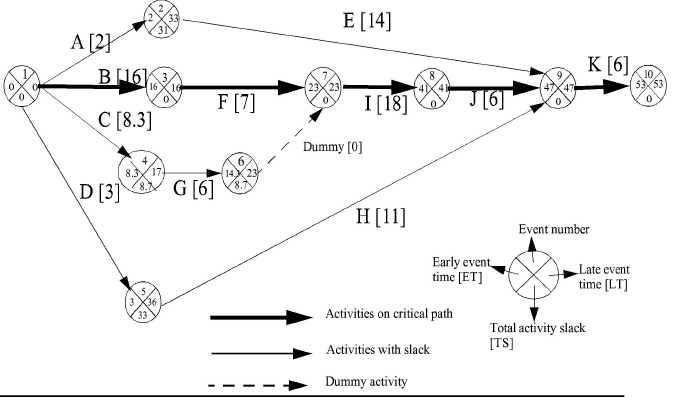
If an activity has zero TS, any delay in starting or completing the activity will delay the completion of the project. For example, increasing the duration of an activity with zero TS by four weeks will increase the length of the project by four weeks. Such an activity is critical to the on-time completion of the project. Therefore, the critical path is composed of critical activities. Exhibit 24-10 shows the critical path of the PERT network.
|
Activities that are not on the critical path have a certain amount of slack; that is, they may be started later and still allow the project, as a whole, to proceed on schedule. An activity's TS can be used as a measure of the flexibility in the duration of the activity. For example, activity A can take up to 31 days longer than its scheduled duration of 2 days without delaying the completion of the project.
An activity's free slack (FS) is the maximum amount of time the activity can be delayed without delaying the start of the next activity. Free slack will only occur on noncritical activities and will never exceed total slack.
Suppose the occurrence of event i, or the duration of activity (i, j), is delayed by k units. Then, the earliest that event J can occur is ET(i) + Te(i, j) + k. Thus, if ET(i) + Te(i, j) + k <= ET(j), or k <= LT(j) - ET(i) - Te(i, j), then event j is not delayed. If event j is not delayed, no other activities will be delayed beyond their earliest possible starting times. Therefore:
|
|
FS (i, j) |
= |
LT(j) |
- ET(i) |
- Te(i, j) |
|
|
|
Activity A: |
FS(1, 2) |
= |
33 |
- 0 |
- 2 |
= |
31 |
|
Activity C: |
FS(1, 4) |
= |
17 |
- 0 |
- 8.3 |
= |
8.7 |
|
Activity D: |
FS(1, 5) |
= |
36 |
- 0 |
- 3 |
= |
33 |
|
Activity E: |
FS(2, 9) |
= |
47 |
- 2 |
- 14 |
= |
31 |
|
Activity G: |
FS(4, 6) |
= |
23 |
- 8.3 |
- 6 |
= |
8.7 |
|
Activity H: |
FS (5, 9) |
= |
47 |
- 3 |
- 11 |
= |
3 3 |
Probability Concepts with PERT
PERT assumes that the time needed to perform each activity is a random variable described by a probability distribution. The time distribution that PERT assumes for an activity is a beta distribution. The mean, standard deviation (0'), and variance (or), respectively, of the time for activity Z can be calculated by the following approximation formulas:
Te(Z)= (O+4M+P) / 6
 (Z) = Standard deviation = (P-O) / 6, or
 (Z) = Variance =
  or,
or, 
The expected completion time of the project is the sum of all the expected activity times along the critical path. The expected time to complete the information systems project has already been calculated as 53 weeks. The calculations of the standard deviation and variance of each activity on the critical path are shown in Exhibit 24-11.
The variance of project completion ( ), which is the sum of the variances of the activities along the critical path, is estimated to be 28.99. The project manager can now make probabilistic statements about the completion time of the project. For example, the project manager may want to know the probability that the project will be completed in 50 days or less; that is: P(T1, < 50). Standardizing Tp to the Z statistic, the equation is:
|
Z= (Desired time - Expected time) / Standard deviation |
|
= (50 - 53) / 5.38 |
|
= -3.00 / 5.38 |
|
= -0.5576 |
Z equals the number of standard deviations from the mean. Using the standard normal distribution table in Exhibit 24-12, the probability of completing the project in 50 weeks is approximately 29 percent; that is, the area to the left of Z = -0.5576 is about 0.2900 (1.0000 - 0.7100).

|
To find the area under the normal curve, you must know how many standard deviations that point is to the right of the mean. Then, the area under the normal curve can be read directly from the normal table. For example, the total area under the normal curve for a point that is 1.60 standard deviations to the right of the mean is .94520. If Z equals - 1.60, the area to the left of Z equals -1.60 is .05480, or 1 - .94520 = .05480.
|
Z |
.00 |
.01 |
.02 |
.03 |
0.04 |
.05 |
.06 |
.07 |
.08 |
.09 |
|
.0 |
.5000 |
.5040 |
.5080 |
.5120 |
.5160 |
.5199 |
.5239 |
.5279 |
.5319 |
.5359 |
|
.1 |
.5398 |
.5438 |
.5478 |
.5517 |
.5557 |
.5596 |
.5636 |
.5675 |
.5714 |
.5753 |
|
.2 |
.5793 |
.5832 |
.5871 |
.5910 |
.5948 |
.5987 |
.6026 |
.6064 |
.6103 |
.6141 |
|
.3 |
.6179 |
.6217 |
.6255 |
.6293 |
.6331 |
.6368 |
.6406 |
.6443 |
.6480 |
.6517 |
|
.4 |
.6554 |
.6591 |
.6628 |
.6664 |
.6700 |
.6736 |
.6772 |
.6808 |
.6844 |
.6879 |
|
.5 |
.6915 |
.6950 |
.6985 |
.7019 |
.7054 |
.7088 |
.7123 |
.7157 |
.7190 |
.7224 |
|
.6 |
.7257 |
.7291 |
.7324 |
.7357 |
.7389 |
.7422 |
.7454 |
.7486 |
.7517 |
.7549 |
|
.7 |
.7580 |
.7611 |
.7642 |
.7673 |
.7704 |
.7734 |
.7764 |
.7794 |
.7823 |
.7852 |
|
.8 |
.7881 |
.7910 |
.7939 |
.7967 |
.7995 |
.8023 |
.8051 |
.8078 |
.8106 |
.8133 |
|
.9 |
.8159 |
.8186 |
.8212 |
.8238 |
.8264 |
.8289 |
.8315 |
.8340 |
.8365 |
.8389 |
|
1.0 |
.8413 |
.8438 |
.8461 |
.8485 |
.8508 |
.8531 |
.8554 |
.8577 |
.8599 |
.8621 |
|
1.1 |
.8643 |
.8665 |
.8686 |
.8708 |
.8729 |
.8749 |
.8770 |
.8790 |
.8810 |
.8830 |
|
1.2 |
.8849 |
.8869 |
.8888 |
.8907 |
.8925 |
.8944 |
.8962 |
.8980 |
.8997 |
.9015 |
|
1.3 |
.9032 |
.9049 |
.9066 |
.9082 |
.9099 |
.9115 |
.9131 |
.9147 |
.9162 |
.9177 |
|
1.4 |
.9192 |
.9207 |
.9222 |
.9236 |
.9251 |
.9265 |
.9279 |
.9292 |
.9306 |
9319 |
|
1.5 |
.9332 |
.9345 |
.9357 |
.9370 |
.9382 |
.9394 |
.9406 |
.9418 |
.9492 |
.9441 |
|
1.6 |
.9452 |
.9463 |
.9474 |
.9484 |
.9495 |
.9505 |
.9515 |
.9525 |
.9535 |
.9545 |
|
1.7 |
.9554 |
.9564 |
.9573 |
.9582 |
.9591 |
.9599 |
.9608 |
.9616 |
.9625 |
.9633 |
|
1.8 |
.9641 |
.9649 |
.9656 |
.9664 |
.9671 |
.9678 |
.9686 |
.9693 |
.9699 |
.9706 |
|
1.9 |
.9713 |
.9719 |
.9726 |
.9732 |
.9738 |
.9744 |
.9750 |
.9756 |
.9761 |
.9767 |
|
2.0 |
.9772 |
.9778 |
.9783 |
.9788 |
.9793 |
.9798 |
.9803 |
.9808 |
.9812 |
.9817 |
|
2.1 |
.9821 |
.9826 |
.9830 |
.9834 |
.9838 |
.9842 |
.9846 |
.9850 |
.9854 |
.9857 |
|
2.2 |
.9861 |
.9864 |
.9868 |
.9871 |
.9875 |
.9878 |
.9881 |
.9884 |
.9887 |
.9890 |
|
2.3 |
.9893 |
.9896 |
.9898 |
.9901 |
9904 |
.9906 |
.9909 |
.9911 |
.9913 |
.9916 |
|
2.4 |
.9918 |
.9920 |
.9922 |
.9925 |
.9927 |
.9929 |
.9931 |
.9932 |
.9934 |
.9936 |
|
2.5 |
.9938 |
.9940 |
.9941 |
.9943 |
.9945 |
.9946 |
.9948 |
.9949 |
.9951 |
.9952 |
|
2.6 |
.9953 |
.9955 |
.9956 |
.9957 |
.9959 |
.9960 |
.9961 |
.9962 |
.9963 |
.9964 |
|
2.7 |
.9965 |
.9966 |
.9967 |
9968 |
.9969 |
.9970 |
.9971 |
.9972 |
.9973 |
.9974 |
|
2.8 |
.9974 |
.9975 |
9976 |
.9977 |
.9977 |
.9978 |
.9979 |
.9979 |
.9980 |
.9981 |
|
2.9 |
.9981 |
.9982 |
.9982 |
.9983 |
.9984 |
.9984 |
.9985 |
.9985 |
.9986 |
.9986 |
|
3.0 |
.9987 |
.9987 |
.9987 |
.9988 |
.9988 |
.9989 |
.9989 |
.9989 |
.9990 |
.9990 |
|
3.1 |
.9990 |
.9991 |
.9991 |
.9991 |
.9992 |
.9992 |
.9992 |
.9992 |
.9993 |
.9993 |
|
3.2 |
.9993 |
.9993 |
.9994 |
.9994 |
.9994 |
.9994 |
.9994 |
.9995 |
.9995 |
.9995 |
|
3.3 |
.9995 |
.9995 |
.9995 |
.9996 |
.9996 |
.9996 |
.9996 |
.9996 |
.9996 |
.9997 |
|
3.4 |
.9997 |
.9997 |
.9997 |
.9997 |
.9997 |
.9997 |
.9997 |
.9997 |
.9997 |
.9998 |
For another example, the project manager may ask, “What is the probability that activity 1 can be completed by week 45?” The following variances are associated with the pertinent critical path activities:
|
ACTIVITY |
|
|
B |
11.11 |
|
F |
1.00 |
|
I |
16.00 |
|
Total |
28.11 |


= 4.00 / 5.30
= 0.7547
The area under the normal curve for Z = 0.7547 is approximately 0.7750. Therefore, the probability that activity I will be completed by week 45 is 77.5 percent.
Crashing The Project
Frequently, the project manager will be required to complete the project in a time that is less than the normal critical path. For example, Kumar Davishar, project manager, is charged with the responsibility of constructing a bridge in less time than was originally estimated. To do this, Kumar will have to expand the project's resources by taking such steps as initiating overtime work, leasing additional equipment, and hiring more employees. This process is referred to as crashing.4
|
|
*Note: This is the time for a fully crashed A-E-G path. |
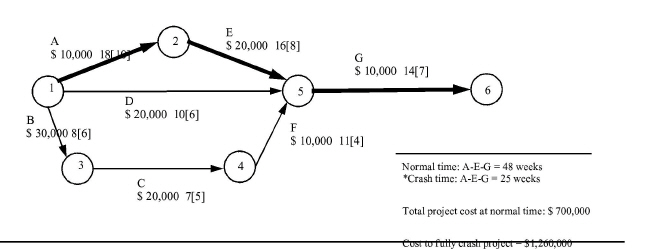
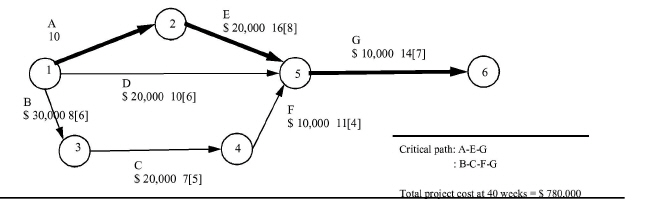
The PERT network for building the bridge is shown in Exhibit 24-13. The total cost at normal time for this project is $700,000. The normal time (in weeks) for each activity appears first, followed by the fully crashed time in parentheses. Below the activity codes are the incremental costs of crashing the activity; that is, the crash cost per week. For example, activity A can be reduced by 8 weeks at a cost of $10,000 per week, which means that crashing activity A fully would add $80,000 to the total project cost.
|
What if Kumar Davishar wants to know the least-cost schedule to complete the project in 40 weeks, 45 weeks, or any other time frame between 48 and 25 weeks? To reduce the total project time, the time needed to complete the critical path must also be reduced.
|
Kumar also wants to do this at the lowest possible cost. Thus, he should choose the activity on the critical path that has the least cost of crashing Activities A and G both cost $10,000 per week to crash. In case of a tie, the activity that can reduce the project duration by the greatest amount should be chosen, in this case activity A. Now activity A is fully crashed from 18 weeks to 10 weeks. This adds $80,000 to the project cost ($10,000 x 8 weeks), giving a total project cost of $780,000 ($700,000 + $80,000)..
|
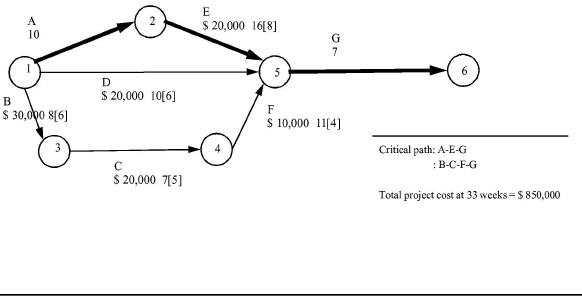
The-network is redrawn in Exhibit 24-14 to represent the crashing of activity A. The crashing of activity A has not only reduced the previous critical path, A-E-G, to 40 weeks, but it has made path B-C-F-G critical as well, with a total duration of 40 weeks. This is an example of how noncritical activities can become critical when activities are crashed.
|
Now activity G is the only activity that can reduce the project time alone. Therefore, it is chosen to crash next, from 14 weeks to 7 weeks, at a cost of $70,000 ($10,000 x 7 weeks). The new network with a project time of 33 weeks and a total project cost of $850,000 ($780,000 + $70,000) is presented in Exhibit 24-15.
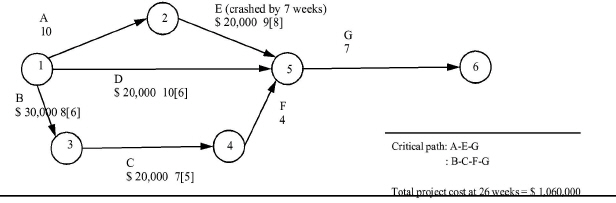
Because activity F has the lowest crash cost remaining, it is chosen to crash next. In addition, activity E is the only activity remaining on path A-E-G that has not been crashed. Crashing activity F (7 weeks) and partially crashing activity E (7 of the possible 8 weeks) increases the total project cost by $210,000 ($10,000 x 7 weeks and $20,000 x 7 weeks). The project time is reduced to 26 weeks, with a total project cost of $1,060,000. The resulting network is illustrated in Exhibit 24-16. Note that crashing activity E fully is not worthwhile because doing so would reduce critical path A-E-G to 25 weeks while critical path B-C-F-G remains at 26 weeks.
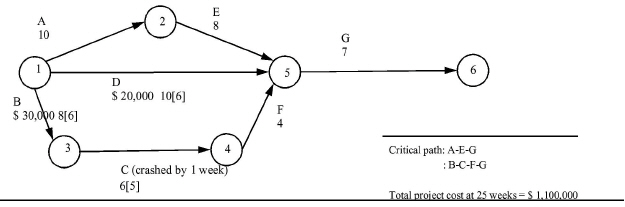
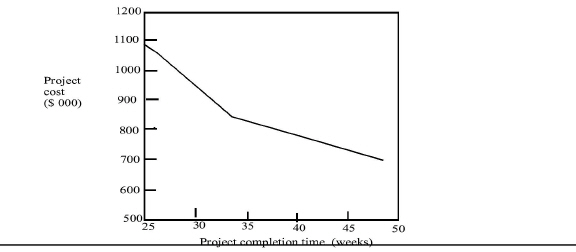
Fully crashing activity E becomes worthwhile, however, if critical path B-C-F-G can be reduced by one week. This can be accomplished by partially crashing activity C, which has the lowest crash cost. Thus, the final step is to crash activity E completely and partially crash activity C. This step costs $40,000 ($20,000 x 1 week and $20,000 x 1 week), making the total project cost of the crashed project $1,100,000, which is $160,000 ($1,260,000 - $1,100,000) less than crashing all the activities, as presented in Exhibit 24-13. Exhibit 24-17 illustrates the final network. Crashing activity B or D or crashing activity C further will not reduce project time. The results of the analysis are graphed in Exhibit 24-18, which shows the cost of crashing for any project completion time between a normal and a fully crashed schedule.
|
Project Modeling
When dealing with capital projects, it is normally best to assume that if something can go wrong, it will. Project modeling means planning for problems and working out in advance what could go wrong and developing a solution. Then, when a problem arises, the project manager can react quickly and effectively. By providing what-if analysis, a project modeling system lets project managers examine the effect of alternative courses of action before they have to make a decision.
Project modeling increases the effectiveness of project management by allowing the project manager to pose a number of what-if probabilities, which are vital to validating project estimates. Such an approach can provide managers with estimated completion dates and costs as well as confidence levels for their predictions. With today's increases in desktop computing power, it is fairly easy to employ calculation-intensive project modeling.
Monte Carlo Simulation
One of the popular models used in project modeling and risk analysis is Monte Carlo Simulation. The Monte Carlo Simulation model calculates multiple possible scenarios by randomly selecting a number from within a given range and applying it to the project modeling system. In this way, random behavior may be added to otherwise deterministic models to simulate the uncertainty in real-world situations. The Monte Carlo Simulation-based project model is run a great many times. The variance of the probability distribution of the results is determined as well as the average performance. Managers can thereby estimate the likelihood of achieving various completion dates or costs.
To run a Monte Carlo Simulation model, project managers provide four pieces of data:
• Earliest completion date the project can have
• Latest completion date the project can have
• Expected completion date of the project
• A probability distribution curve selected from a range of curve options
Monte Carlo Simulation can be applied to cost estimates in a similar manner. By providing the project modeling system with lowest and highest costs as well as the target budget, managers can use the simulations to determine the likelihood of achieving hoped-for costs.
Selecting a Distribution Curve
As might be expected, the project manager's choice of a distribution curve will have a strong influence on a Monte Carlo Simulation-based project modeling system. Although an endless number of possible distribution curves exist, the following two are dominant:
• Normal distribution curve
• Triangular distribution curve
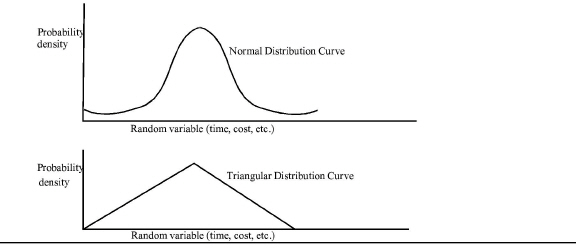
These distribution curves are illustrated in Exhibit 24-19.
The normal distribution curve has a bell shape that is symmetric about its mean. Probabilities of anticipated time and cost outcomes increase exponentially as these variables approach their expected values, or means.
A triangular distribution curve is a simplified version of a normal distribution curve. Once again, probability increases as the variables approach their mean. But rather than increasing exponentially, triangular distribution probability increases linearly from either extreme to the mean.
|
Few guidelines exist to help project managers decide which distribution curve to use for a specific project. Therefore, the best approach is to apply various curves to similar projects that have been completed and observe which curve provides the greatest level of accuracy in matching those times and costs. If historical data are missing, a “best guess” regarding a distribution curve type is the only option. Experience will eventually dictate which curve type is most appropriate.'
Running the Iterations
A second factor influencing the accuracy of Monte Carlo Simulations is the number of iterations the project modeling system performs. As a general rule, the more iterations, the more accurate the results will be. In general, between 100 and 5,000 iterations must be performed to obtain optimum results.
Monte Carlo Simulation in Practice
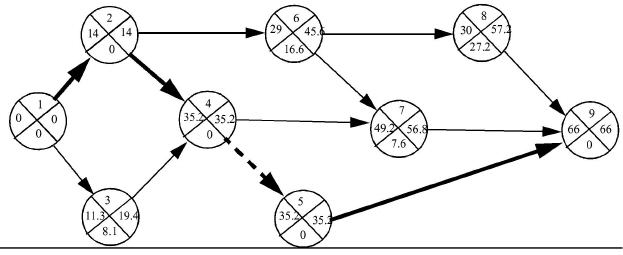
Cynthia Kemp, senior project engineer for Hi-Vac Industries, has developed a PERT network to assist in managing the construction of a new assembly line. This PERT network and its tasks are illustrated in Exhibit 24-20. Note that Cynthia has calculated the variance,  , for each activity as well as the expected time, Te. The critical path is indicated by a bold line.
Although Cynthia's PERT diagram could have been created by hand, she decided to use a project management software package to prepare the diagram. By doing so, Cynthia saved time and effort in entering project task information; she only needed to enter it once. The project management software package then allowed her to ask any number of what-if questions regarding project time and cost with just a few keystrokes. She could, for example, crash one or more tasks to see how the network's critical path would change. Or she could ask the computer to determine the least costly way to crash the network by five days.
|
|
|
Expected |
Variance |
|
Expected |
Variance |
|
|
Task |
Time (Te) |
|
Task |
Time (Te) |
|
|
A |
Design line layout |
14.0 days |
16.00 |
H Dummy task |
0.0 days |
0.00 |
|
B |
Prepare equipment list |
11.3 |
4.00 |
I Print documentation |
1.0 |
0.00 |
|
C |
Prepare building interior |
21.2 |
38.00 |
J Run wiring simulation |
11.2 |
4.70 |
|
D |
Install false floor & ceiling |
15.3 |
1.78 |
K Draw wiring schematic |
14.0 |
8.17 |
|
E |
Write documentation |
15.0 |
32.10 |
L Install equipment |
30.8 |
6.25 |
|
F |
Acquire equipment |
15.8 |
6.25 |
M Install wiring & plumbing |
9.2 |
0.70 |
|
G |
Install air ductwork |
13.2 |
10.04 |
N Conduct training |
8.8 |
0.70 |
|
||||||


Cynthia's project management system integrates Monte Carlo Simulation with the package's PERT features. Ed, the plant manager, wants Cynthia to run such a simulation. He feels that by iterating the PERT network with randomly selected task times, the resulting project schedule will more accurately reflect actual conditions.
Cynthia loads her PERT data into the Monte Carlo module. The software asks her to enter parameters that define the probability distribution from which random values will be selected. She enters values for earliest, latest, and expected times for completion of the project. Cynthia is not sure what type of probability distribution to use or the number of iterations to run. Ed suggests using a normal distribution curve and running 1,000 iterations. He feels different distributions and iteration counts can be used in future projects until sufficient experience is gained to make a more educated choice. Cynthia makes the appropriate selections and runs the simulations.
|
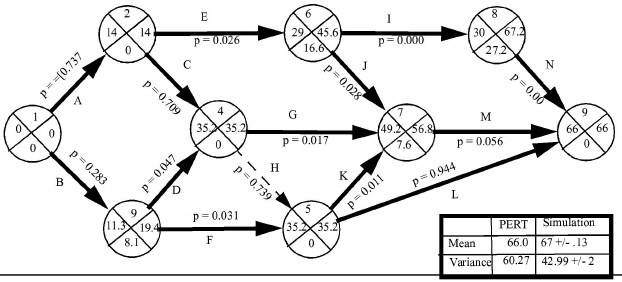
The Monte Carlo Simulation takes about 15 minutes to run on Cynthia's computer. Exhibit 24-21 shows the software's output, a PERT network identical to the one in Exhibit 24-20. The PERT mean (expected) time of 66 days and variance of 60.27 are tabulated next to the results of the Monte Carlo Simulation. The PERT estimate of the project mean was low (optimistic) by only 1.5 percent [((67.00 - 66.00) - 67.00) x 100), but the estimated variance was too high by 42 percent [((60.27 - 42.39) - 42.39) x 100). In this case, this discrepancy was due to a considerable amount of slack along subcritical paths at each PERT event. Subcritical paths are paths that, while not actually critical, require nearly as much time as the critical path. If there is a large amount of slack along these paths, the probability of one of them actually becoming critical is relatively low, and the variance will be overstated by PERT, as in this case.
Finally, Cynthia gets one more type of information from the Monte Carlo Simulation output. Each task arrow now includes the probability of that task becoming part of the critical path. As an example, activity A shows a probability of 0.737, or 73.7 percent. This means that out of the 1,000 iterations run during the simulation, the critical path included activity A 737 times. On the other hand, activity K, with a probability of 0.011, fell onto the critical path only 11 times out of 1,000 simulation runs. These probabilities can help Cynthia's team concentrate on the tasks that are most likely to affect the completion time of the project.
The Implementation Audit
LEARNING OBJECTIVE 3
Explain why an implementation audit is conducted.
The implementation audit is a systematic review of capital projects conducted during the development and implementation stage of the capital budgeting methodology. Such audits have three purposes:
• Assessing performance and resolving problems before they surface
• Identifying opportunities for improvement
• Providing recommendations so that corrective action can be taken
Consequently, an implementation audit involves a great deal of fact-finding and analysis while the project is under development and implementation. If problems are identified at an early stage, the likelihood of the project being implemented on time, falling within budget, and meeting user requirements is increased substantially.
Conducting the Implementation Audit
As part of its fact-finding and analysis, an implementation audit makes use of a wide variety of methods. The following methods are most commonly used:
• Interviewing
• Observing
• Inspecting documented deliverables
INTERVIEWING. Interviewing is an exchange of information between the management accountant and the project manager (and others, such as project team members). It is a prime way to gather facts. Both open-ended and closed-ended questions may be used during the interview.
|
INSIGHTS & APPLICATIONS A Project That Needed Implementation Auditing from the Beginning There were beginning to be signs that development of the hot line project was out of control. About nine months into the project, Jan Massey of Whirlpool asked to see a project plan, but IBM couldn't provide one. She was stunned. “How do you develop a system without a plan?” she asked. That was nothing compared with what happened next. About a year-and-a-half after the project was initiated, IBM was supposed to deliver the key component of the project-the kernel, as Whirlpool calls it. |
Up to a month before it was supposed to be delivered, Whirlpool was told it would be on time. It wasn't. An executive at Whirlpool, at this point, wanted to kill the project. But based on assurances that the project would be closely monitored by Jan Massey, the project was given a reprieve. The crisis passed and Whirlpool's hot line project was finally implemented. Both IBM and Whirlpool officials acknowledge their flaws. “In tackling another project of this size, I would have to tell a customer, 'Don't trust us completely, please,”' says Bob Essig, IBM account manager for the Whirlpool project. “Unless both sides work together, you'll never have a win-win situation. Whirlpool should have had a co-project-manager from the beginning. One-sided equations never work.”a |
|
aAdapted from Jeffrey Rothfeder, “Crossed Wires,” Corporate Computing, December 1992, pp. 158-165. |
Open-ended questions are neutral and nonrestrictive. They give interviewees considerable freedom in answering questions and encourage them to disclose information previously unknown to the management accountant. “What are your feelings about using encryption devices in the new LAN project?” is an example of an open-ended question.
Closed-ended questions are specific and give the management accountant more control over the direction and progress of the interview. Closed-ended questions are limiting, however, in that they usually obtain only the information they ask for and do not invite interviewees to open up and reveal relevant information that the management accountant has not anticipated. “Should we use diskless workstations on the new LAN?” is an example of a closed-ended question. Closed-ended questions should never be leading or loaded, such as “Shouldn't we use diskless workstations on the new LAN?” “You agree with this report format, don't you?”
OBSERVING. Physical observation of the development and implementation of a capital project can be a useful way of identifying possible inefficiencies, delays, or problems. Observing permits the management accountant to determine what is being done, how it is being done, who does it, when it is done, how long it takes, where it is done, and why it is done. As Yogi Berra said: “You can observe a lot by watching.” Examples of problems found by observing include poor cable installation procedures (e.g., kinks or sharp bends in cable, cable placed too close to power wiring), idle equipment on a construction project, excessive redesign work, and inability to schedule and coordinate work.
INSPECTING DOCUMENTED DELIVERABLES. Documented deliverables provide information about the development and progress of the new project. For example, the work performed on a systems design proposal during a particular time period will be represented by a documented deliverable. In information systems development, documented deliverables are required when a stage in the systems development methodology is achieved. In a construction project, documented deliverables are prepared that include information on the cost and progress of the project to date.
Inspecting (sometimes called walk-throughs) these documented deliverables can uncover a host of inconsistencies and problems. For example, inspection of a systems design documented deliverable may reveal a number of design errors. Since most systems problems are caused by poor design, it is imperative that the systems design be thoroughly inspected before moving on to other stages, especially before converting to operations. Uncovering errors after the system is converted to operations is far more costly than discovering them earlier.
By inspecting the results of PERT networks or Gantt charts, management accountants can track a project's progress and cost. If, for example, a project's activity on the critical path is delayed ten days, then the schedule will slip ten days unless resources from slack activities are allocated to the critical activity. PERT also monitors actual costs against budgeted costs to check for cost over-runs.
Preparing the Implementation Audit Report
The implementation audit report is usually an action document that requires immediate attention. Therefore, its quick preparation and distribution to top management or some other designated recipient (e.g., a steering committee) are imperative. If the implementation audit report is delayed, it may be out-of-date by the time it is issued. Moreover, the opportunity to take corrective action may be restricted or gone altogether.
Normally, an exit conference with the auditee should be held to discuss the findings of the audit and suggested recommendations before the final version of the implementation audit report is prepared and distributed. Not only does such a meeting enhance the management accountant's rapport with the auditee, but it can also improve the overall quality of the audit report since misinterpretations and unreasonable recommendations are unlikely to go unchallenged. If an auditee disagrees with the audit report language, revisions can be made. The auditee should also be given a chance to provide written comments for inclusion in the audit report. For an example of how to prepare an implementation audit report, see the Highland Manufacturing case on the next page.
Auditing a capital project's progress continuously enables management to allocate resources more effectively, change tactics or strategies, or revise policies to bring a project that is off course back on track. In some instances, however, implementation audit results may indicate that the best decision is to scrap a particular project. If original estimates are substantially off and the project has no hope of achieving its estimated benefits, the cost of discontinuing the project may be less than the cost of investing additional resources to transform a boondoggle project into a success.
The Postimplementation Audit
LEARNING OBJECTIVE 4
Discuss the reason for conducting a postimplementation audit, and describe the tools used in conducting such an audit.
Whereas an implementation audit monitors capital projects while they are under development and implementation, a postimplementation audit reviews capital projects after they have been implemented to determine if they have lived up to their earlier estimates. The postimplementation audit analyzes what went right and what went wrong.
|
INSIGHTS & APPLICATIONS Implementation Auditing of a New ICBIS for Highland Manufacturing Company After performing net present value analysis, Highland Manufacturing selected a new integrated computer-based information system (ICBIS) to be developed and implemented for better integration of users throughout the company. The development costs are estimated to be $5,830,000. Joel Milam, management accountant at Highland, was chosen to audit the development and implementation of the new ICBIS. The project began July1, 2004. As of July 15, 2004, a number of missteps had occurred. “Was a systems plan prepared before the ICBIS was approved for development and implementation?” asked Joel. |
“No, we were assigned to the project with very little guidance,” said Shirley McGovern, project team leader. “I understand that it's budgeted at $5,830,000, but we’re really starting from scratch as far as the development is concerned.” “Have you prepared a schedule and assigned your team members to specific activities?” asked Joel. “No, not yet,” said Shirley. “Do you plan to follow a systems development methodology?” Joel asked. “Yes,” Shirley responded. “What do you think about using a project management software package that provides you with the ability to break down activities and schedule them?” asked Joel. “I really believe that such a system would help us throughout the development and implementation of this project,” said Shirley. “I have to prepare my first implementation audit report and submit it to the systems steering committee the first of next week,” said Joel. “I'll prepare the first draft and go over it with you tomorrow. Should you want to include any comments, you are welcome to do so.” Joel's report is presented in Exhibit 24-22. |
Purpose of the Postimplementation Audit
A sound postimplementation audit completes the life cycle of the capital budgeting methodology for a particular project. It compares actual results to original estimates made in the first stage of the capital budgeting methodology to point out variances.
A comparison will help management evaluate the reliability of estimates of costs and benefits given in support of a capital project. People requesting projects may be biased in favor of the projects they request. Such bias may result in overly optimistic estimates. People providing unreliable estimates should be required to explain major variances. Knowing in advance that postimplementation audits will be conducted may cause project sponsors and estimators to be more careful in developing their estimates.
Thus, postimplementation audits offer several benefits:
• Detecting strengths and weaknesses throughout the capital budgeting methodology
• Suggesting modifications to improve capital budgeting performance
• Identifying individuals who submit overly optimistic or pessimistic estimates
• Helping to avoid the same mistakes on similar future projects
Conducting the Postimplementation Audit
Normally, the postimplementation audit is conducted six months to one year after the capital project becomes operational. At this point, the capital project under audit has had time to settle into a somewhat normal operating pattern. The audit will usually continue periodically (e.g., once a year) over the life of the capital project.
|
Exhibit 24-22 Implementation Audit Report for the New ICBIS |
|
|
Project: |
Integrated computer-based information system |
|
Date of report: |
07/21/04 |
|
Period covered: |
07/01/04 thru 07/15/04 |
|
|
|
|
Purpose: |
To determine whether management has reasonable assurance that the project will be developed and implemented on time and within budget. Additionally, audit tasks will be performed to ensure that the project is being developed in compliance with management standards and policies and that user requirements are being met. |
|
Scope: |
• To assess overall development and implementation of the project in order to: |
|
|
• Determine whether a proper systems development methodology is being followed and documented deliverables are being produced |
|
|
• Ascertain whether proper security and accounting controls are being built into the system as it is being developed |
|
|
• Judge the adequacy of testing procedures |
|
|
• Review request for proposals (RFP) submitted to computer vendors |
|
|
• Analyze proposals from computer vendors |
|
|
• Monitor conversion procedures |
|
|
• Evaluate training programs for users |
|
Audit work performed: |
We have audited the activities of the project team. Our audit was conducted during the period from July 1, 2004 through July 15, 2004, and consisted of: • Interviews with the project team leader • Observations of project team activity • Inspection of the capital budget • Comparison of the capital budget to actual results |
|
General evaluation: |
The project began July 1, 2004. To date, missteps have occurred due to the lack of a systems plan and uncertainty about which activities should be performed and in what sequence. Present arrangements for systematically scheduling and controlling the project are unsuitable. Serious breakdowns have occurred, and they will continue unless corrective action is taken immediately. |
|
Recommendation: |
We recommend that a project management software package he acquired. Such a project management system will formalize a plan and schedule, coordinate activities, help control time and cost, and produce documented deliverables. A critical path of the project will be determined and closely monitored. |
|
Comments by auditee: |
I have reviewed the recommendation and other contents of this audit report and agree with its contents. |
|
|
|
|
Signed: |
|
|
Shirley McGovern Project leader |
|
|
Signed: |
|
|
Joel Milam Management accountant |
|
|
INSIGHTS & APPLICATIONS Recognizing the Warning Signs of a Runaway System Following are warning signs of a capital project out of control: Periodic reporting isn't occurring or is occurring less than once a month. - Users aren't directly involved, aren't asked to sign off on key facets of the project, and aren't attending planning meetings. Staff lacks technical expertise or experience in related technologies. No testing, inadequate testing, or test reports that fail to produce corrective actions. |
Failure to document project status, accomplishments, and system components.a
Project management tools (e.g., Gantt and PERT) used during implementation auditing assist both the project manager and management accountant to maintain tight control and prevent runaway projects. This assistance includes: Online query analysis Extensive tracking Schedule and cost variances reporting What-if analyses Change request prioritization Resource allocation |
|
aDeborah Asbrand, “Uncharted Waters Pose Risk of Runaway Projects,” Infoworld, June 28, 1993, p. 67. |
A postimplementation audit may be conducted by a team composed of user representatives, internal auditors, and management accountants. In some enterprises, however, an external consultant or independent auditor is brought in to conduct the audit to help increase objectivity and reduce any political ramifications that may exist among internal groups.
The following postimplementation audit areas merit the most attention:
• Feasibility factors
• Benefit factors
• Cash flows
AUDITING FEASIBILITY FACTORS. As discussed in Chapter 22, during the first stage of the capital budgeting methodology, managers assign ratings to the following feasibility factors:
• Technical
• Operational
• Economic
• Schedule
The results of auditing these feasibility factors are recorded in a Feasibility Factors Audit Rating Checklist. Exhibit 24-23 presents the checklist used to record the results of the postimplementation audit of Highland Manufacturing Company's new ICBIS. The checklist guides the audit team in reviewing the feasibility factors. Sample questions that the audit team addressed are disclosed in the checklist.
|
Feasibility Factors Audit Rating Checklist |
||||||
|
|
Estimated rating |
Audit rating |
Variance |
|||
|
Technical feasibility |
|
7 |
|
8 |
|
1 (F) |
|
Is the technology supporting the operations as originally specified? Did the capital project have to be modified to make it fit the operation? Does the vendor provide sufficient technical assistance? |
|
|
|
|
|
|
|
Operational feasibility: |
|
7 |
|
5 |
|
2 (U) |
|
Are employees committed to working with the capital project? Are employees sufficiently trained to operate, maintain, and use the capital project? |
|
|
|
|
|
|
|
Economic feasibility: |
|
9 |
|
5 |
|
4 (U) |
|
Were adequate funds available for development or acquisition of the capital project? Are adequate funds available for operating and maintaining the capital project? |
|
|
|
|
|
|
|
Schedule feasibility: |
|
9 |
|
6 |
|
3 (U) |
|
Was the overall schedule of the capital project met? |
|
|
|
|
|
|
|
Total |
|
32 |
|
24 |
|
8 (U) |
|
Final score |
(32/4) |
8 |
(24/4) |
6 |
(8/4) |
2 (U) |
|
Rating scale: 0 5 10 Poor Fair Excellent |
||||||
During the first stage of the capital budgeting methodology, management estimated the capital project's feasibility factors ratings at 7, 7, 9, and 9, respectively. During the postimplementation audit, the audit team discovered that the technical feasibility factor worked even better than was originally estimated, warranting a rating of 8. The other three feasibility factors have not fared as well, however. The users are not happy with the way the ICBIS was implemented because the training program was inadequate. But new training programs have been installed, and a turnaround in attitude is beginning to take place. Therefore, operational feasibility is rated 5. Economic feasibility is also rated 5 because adequate capital funds were not committed to the ICBIS, which required some design modifications. Currently, sufficient funds are available for operating and maintaining it. Schedule feasibility is rated 6. The target date for implementation of the ICBIS was late by three months. Part of the schedule problem, however, was due to the unanticipated modifications. The final audit rating is 6 compared to an earlier estimated rating of 8.
AUDITING BENEFIT FACTORS. The postimplementation audit of the feasibility factors is a formal process to determine how well the capital project is working, how it has been accepted, and whether adjustments or redesigns are needed. Another important reason for conducting a postimplementation audit is to compare actual benefits with those that were estimated during the first stage of the capital budgeting methodology. The Benefit Factors Audit Rating Checklist, illustrated in Exhibit 24-24, allows the audit team to do this.
|
|
Benefit Factors Audit Rating Checklist Estimated rating |
|
|
||
|
Tangible benefits: |
|
Audit rating |
|
Variance |
|
|
Reduce inventory costs |
4 |
|
9 |
|
5 (F) |
|
Reduce labor costs |
5 |
|
9 |
|
4 (F) |
|
Reduce scrap and rework costs |
3 |
|
9 |
|
6 (F) |
|
Reduce material costs |
4 |
|
9 |
|
5 (F) |
|
Reduce material handling costs |
4 |
|
9 |
|
5 (F) |
|
Tangible benefit rating (20/5) |
4 |
(45/5) |
9 |
(25/5) |
5 (F) |
|
Intangible benefits: |
|
|
|
|
|
|
Improve delivery and service |
2 |
|
10 |
|
8 (F) |
|
Increase product quality and reliability |
3 |
|
10 |
|
7 (F) |
|
Improve production performance and lead time |
2 |
|
10 |
|
8 (F) |
|
Enhance production flexibility |
4 |
|
10 |
|
6 (F) |
|
Improve employee safety |
4 |
|
10 |
|
6 (F) |
|
Intangible benefit rating (15/5) |
3 |
(50/5) |
10 |
(35/5) |
7 (F) |
|
Rating scale: 0 5 10 Poor Fair Excellent |
|
|
|
|
|
As the checklist indicates, the estimated ratings for Highland's ICBIS were mediocre at best. There were many reasons for these low ratings, most of them revolving around management's skepticism that the ICBIS would provide significant benefits. Those misgivings have proved to be unfounded. As both the Capital Project Request Form and several JID sessions (see Chapter 22 for a review of the Capital Project Request Form and JID) proposed, the ICBIS general design provides EDI linkage to major customers, suppliers, and carriers. The ICBIS is also based on an enterprisewide network that interconnects all the enterprise's activities, such as engineering, production, logistics, marketing, and accounting. The ICBIS includes activity-based costing (ABC), activity-based management (ABM), total quality management (TQM), flexible budgeting, an array of performance measurements, life cycle analysis and target costing methods, a completely integrated logistics system, and a revised responsibility accounting system. Thus far, the ICBIS has only been in operation for one year. Even though it had to be subjected to some design modifications and some people were unhappy with the early implementation and training programs, its ability to provide timely, accurate, and relevant information to management and other users has far exceeded earlier expectations.
The ABC and ABM systems have reduced material handling costs by 60 percent. The TQM system has reduced rework costs and external failure costs by 60 percent. Flexible budgeting has helped to reduce overhead. The performance measurements have had a substantial impact on all benefit factors, as have the new life cycle analysis and target costing methods. The integrated logistics system has reduced inventory, labor, and material handling costs, as well as improved delivery and service. The revised responsibility accounting system has also had an impact on all benefit factors. The postimplementation audit team is pleased with its findings and therefore has assigned high ratings to all benefit factors.
AUDITING CASH FLOWS. During the first stage (Chapter 22) of the capital budgeting methodology, the Cash Flow Estimate Form was used to record and document estimated cash flow data for the new ICBIS. The Cash Flow Estimate Form presented in Exhibit 24-25 is used during the postimplementation stage to disclose variances between estimated and actual cash flows for the first period.
|
Cash Flow Estimate Form |
||||
|
Project name: |
ICBIS |
Date: |
MM/DD/YY |
|
|
Estimators: |
Name Harry Cowan Margaret Sherer Marc Higgins Steve Ferranti Krishna Mani |
Title Chief information officer (CIO) Management accountant Systems analyst Manager of logistics Financial accountant |
||
|
Investment outlay |
Estimated |
Actual |
Variance |
|
|
Initial cost |
$5,000,000 |
$4,500,000 |
$500,000 |
(F) |
|
Sales tax |
10,000 |
20,000 |
10,000 |
(U) |
|
Freight |
20,000 |
40,000 |
20,000 |
(U) |
|
Installation |
400,000 |
600,000 |
200,000 |
(U) |
|
Training |
200,000 |
100,000 |
100,000 |
(F) |
|
Working capital |
200,000 |
100,000 |
100,000 |
(F) |
|
Test runs |
100,000 |
50,000 |
50,000 |
(F) |
|
Subtotal |
$5,930,000 |
$5,410,000 |
$520,000 |
(F) |
|
Less trade in |
<100,000> |
<20,000> |
<80,000> (U) |
|
|
Total investment |
$5,830,000 |
$5,390,000 |
$440,000 (F) |
|
|
|
|
Period |
|
|
|
Cash flow from operations |
1 |
2 |
3 |
4 |
|
Estimated cash inflow |
$2,000,000 |
$3,000,000 |
$4,000,000 |
$5,000,000 |
|
Estimated operating costs |
<1,000,000> |
<1,200,000> |
<1,400,000> |
<1,600,000> |
|
Estimated net cash inflow |
$1,000,000 |
$1,800,000 |
$2,600,000 |
$3,400,000 |
|
Actual cash inflow |
$2,300,000 |
|
|
|
|
Actual operating costs |
<1,100,000> |
|
|
|
|
Actual net cash inflow |
$1,200,000 |
|
|
|
|
Net cash inflow variance |
$ 200,000 (F) |
|
|
|
The initial cost of the ICBIS was estimated to be $5,000,000, but because of budget cutbacks forcing design modifications, the ICBIS actually had an initial cost of $4,500,000, giving a favorable variance of $500,000. Sales tax, freight, and installation costs were underestimated. Although costs for training, working capital, and test runs were overestimated, the postimplementation audit team, as well as users, learned that scrimping on training and testing will cost more in the long run. This issue was brought out while the audit team was auditing the operational feasibility factor. Consequently, favorable variances in areas such as installing, training, and testing may be misleading. In any event, the total actual investment is $5,390,000, which is $440,000 less than the $5,830,000 originally estimated.
The postimplementation audit team also audited the benefit factors and discovered that the actual cash inflow from benefits is $2,300,000 ($2,000,000 originally estimated) and cash outflow from operating costs is $1,100,000 ($1,000,000 originally estimated). Estimated net cash inflow of $1,000,000 ($2,000,000 - $1,000,000) less actual net cash inflow $1,200,000 ($2,300,000 - $1,200,000) yields a favorable net cash inflow variance of $200,000. The postimplementation audit team will audit the ICBIS again next year, which is period 2, along with other capital projects to determine if this year's findings represent a trend and to ascertain variances between estimated and actual cash inflows and outflows.
AUDITING ECONOMIC VALUE ADDED. A large number of companies, such as CSX, Briggs & Stratton, Coca-Cola, and AT&T, are using an evaluation tool called economic value added (EVA). Some predict that EVA will become the chief performance measurement of management's capital investment decisions. It takes into consideration the company's weighted-average cost of capital (discussed in Chapter 23) and aftertax operating profit.
Of course, nothing is new about an enterprise trying to earn more than its cost of capital. This is probably one of the oldest ideas in business as illustrated by return on investment (ROI) and residual income (RI) explained in Chapter 20. EVA is calculated in the following example.
Luminex Company has a capital base of $8,000,000, which is composed of 20 percent debt at a cost of 5 percent and 80 percent equity at a cost of 12 percent. Its operating profit is $1,800,000 and income taxes are $600,000. Luminex's EVA is calculated as follows:
|
|
|
|
|
|
|
|
|
|
|
|
|
|
|
|
After Tax Operating Profit |
<Minus> |
Cost Of Capital |
[Equals] |
EVA |
|
Operating profit |
$1,800,000 |
|
$8,000,000 |
|
|
|
Income taxes |
<600,000> |
|
X 10.6%* |
|
|
|
Aftertax operating profit |
$1,200,000 |
— |
$ 848,000 |
= |
$352,000 |
|
|
|
|
|
|
|
|
*Weighted-average cost of capital: |
|
|
|
|
|
|
|
|
|
|
|
|
|
|
Capital Structure |
Cost of Capital |
Weighted Average |
|
|
|
Debt |
20% |
5 % |
1.0°% |
|
|
|
Equity |
80% |
l2% |
9.6% |
|
|
|
|
|
|
10.6% |
|
|
As can be seen, EVA is a simple and fundamental measurement of return on capital. It can be used as a valuable tool in evaluating capital project investments, especially over the long run. Managements can increase their EVA by:
• Earning more profit without using more capital. As pointed out in several places in this book, this may lead to disastrous consequences in the long run because such an objective may dissuade management from making strategic capital project investments.
• Use less capital. If this objective results from reengineering, reduction in non-value-added activities, and continuous improvement, then it will increase EVA based on positive initiatives. If, on the other hand, it results in arbitrary cost-cutting, then the enterprise will suffer in the long run.
• Invest in high-return, strategic capital projects. This is the objective of making capital investments. Use of the capital budgeting methodology combined with EVA-based evaluations assists management in achieving this objective.
Summary Of Learning Objectives
The major goals of this chapter were to enable you to achieve four learning objectives:
Learning objective 1. Describe the Gantt chart and its use.
A Gantt chart is a very simple project management tool in which every activity is represented by a horizontal bar on a time scale. The purpose of Gantt charts is to organize and clarify the use of activities (resources) in a time framework. They serve as excellent visual aids for allocating resources and scheduling time.
Learning objective 2. Use the program evaluation and review technique (PERT) as a project management and modeling tool.
PERT can be used to estimate the probability that a project will be completed by a given deadline. Each activity has a set of predecessor activities that must be completed before the activity begins. A PERT network is used to indicate the precedence relationships between activities, which are represented by arrows. Events, which mark the beginning and ending of activities, are represented by circles.
The first step in building a PERT network is to list each activity and identify the activities that immediately precede it. The second step is to determine the proper sequencing of serial and parallel activities. In the third step, the basic PERT network is constructed. Next, in the fourth step, expected activity times are calculated. The fifth and final step is to find the critical path.
Once the PERT network is finished, a number of probabilistic statements can be made with respect to the total time of the project and individual project activities. For example, the estimated completion date may be calculated as 200 days. The project manager may want to know the probability that the project will be completed in less than 200 days.
In some situations, the project manager must complete the project within a time frame that is less than the length of the initial critical path. In such a situation, the project must be crashed by applying additional resources to critical activities.
Paths outside the critical path cannot be ignored, especially those with small amounts of slack, because one of them may eventually turn critical when the project is crashed. Only critical path activities are crashed, but the path where these activities lie is not always the same. As activities are crashed, the critical path changes.
Project modeling allows project managers to simulate outcomes of PERT time and cost networks according to a number of what-if assumptions. One popular simulation method is the Monte Carlo Simulation. This type of simulation uses a computer to randomly select cost or time quantities and apply them to the PERT model. This allows the project manager to approximate real-world uncertainty.
Learning objective 3. Explain why an implementation audit is conducted.
An implementation audit is performed to make sure that a capital project is implemented on time, within budget, in compliance with management standards and policies, and in accordance with user requirements. An implementation audit report discloses the purpose and scope of the audit. It also includes the results of audit work plus recommendations for corrective action.
Learning objective 4. Discuss the reason for conducting a postimplementation audit, and describe the tools used in conducting such an audit.
After implementation, capital projects should be audited to see if they have lived up to their earlier estimates, and if not, why not? Were there feasibility problems? Did the benefits and cash inflows materialize? Was management too optimistic? Too pessimistic? What was done right? What was done wrong? How can mistakes be corrected for future capital budgeting?
The following are the primary tools used in conducting a postimplementation audit:
• Feasibility Factors Audit Rating Checklist
• Benefit Factors Audit Rating Checklist
• Cash Flow Estimate Form
These tools help determine how close early estimates are to what actually occurred. Economic value added (EVA) is a tool that can be used to measure management's effectiveness in making capital project investments, especially over the long run.
Important Terms
Activity On a PERT network, a task that consumes resources in order to move from one event to another; it is designated by an arrow.
Benefit Factors Audit Rating Checklist A device used during the postimplementation audit for comparing estimated benefit factors to actual benefit factors and recording the variances.
Crashing Completing the project in a time that is less than the original initial critical path.
Critical path The path on the PERT network with the longest cumulative activity time.
Dummy activity A nonresource activity designated by a dashed arrow on the PERT network.
Early event time The earliest time an event can occur.
Event A circle on a PERT network that shows the beginning and ending of an activity or activities.
Expected activity time The estimated duration an activity will take.
Feasibility Factors Audit Rating Checklist A device used during the postimplementation audit for comparing estimated feasibility factors to actual feasibility factors and recording the variances.
Free slack (FS) The maximum amount of time an activity can be delayed without delaying the start of the next activity.
Gantt chart A bar chart, named after its developer Henry Gantt, that shows activities on the left side and units of time across the top or bottom.
Implementation audit A systematic process of reviewing and monitoring capital projects during their development and implementation.
Late event time The latest time an event can occur.
Monte Carlo Simulation A model that calculates multiple possible scenarios by randomly selecting a number within a given range and applying it to the project modelling system.
Most likely time An estimate of the activity's duration under normal conditions.
Optimistic time An estimate of the activity's duration under the most favorable conditions.
Pessimistic time An estimate of the activity's duration under the least favorable conditions.
Postimplementation audit A process that reviews the actual results of capital projects over time to see how well these actual results compare to earlier estimates.
Program evaluation and review technique (PERT) A network of activities and events of a project.
Project modeling Planning for problems and working out in advance by simulation what could go wrong on a project and developing a solution.
Total slack (TS) The maximum amount of time an activity can be delayed without affecting the completion time of the project.
Demonstration Problems
DEMONSTRATION PROBLEM 1 Planning and scheduling with a Gantt chart.
Fashions Galore, a retail store, is planning on moving to a larger building. The owner has requested that a Gantt chart be prepared identifying the major activities, time estimates for each activity, and their sequence.
After analysis of the move was made, it was determined that the first activity would be to locate the new building, which would require 8 weeks. Interviewing salespeople would start at the same time and would require 4 weeks. At the beginning of the fourth week, hiring and training of new salespeople would begin and require 10 weeks. Selecting and ordering fixtures would begin week 8 and require 6 weeks. Remodelling would also begin week 8 and require 11 weeks. Beginning week 14, fixtures would be received and would require 4 weeks for installation. Moving in would start week 19 and be completed week 20.
Required: Prepare a Gantt chart for the preceding information.
SOLUTION TO DEMONSTRATION PROBLEM 1
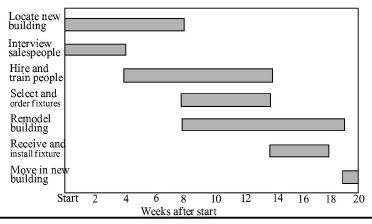
DEMONSTRATION PROBLEM 2 Determining the critical path. Following is a PERT network showing expected time for each activity:
Required: List all the paths in the network and determine which is the critical path.
SOLUTION TO DEMONSTRATION PROBLEM 2
|
Path |
Time |
|
1, 6, 9 |
14 |
|
1, 2, 5, 9 |
11 |
|
1, 2, 3, 4, 9 |
15 |
|
1, 3, 4, 9 |
6 |
|
1, 7, 8, 9 |
17 |
Path 1, 7, 8, 9 is the critical path because it has the longest time.

DEMONSTRATION PROBLEM 3 Implementing a local area network (LAN). General Hospital is planning to develop and implement a LAN to serve its physicians and nurses. The following information pertains to this plan:
|
Activity |
Activity description |
Te |
|
A |
Acquire workstations |
2 weeks |
|
B |
Install cable |
8 weeks |
|
C |
Install software |
4 weeks |
|
D |
Train users |
3 weeks |
|
E |
Connect and test |
2 weeks |

Required:
a. Calculate the early event time (ET), late event time (LT), slack times, and critical path.
b. Assume that the pessimistic and optimistic times for activity B are 24 and 6 days, respectively. For activity E, they are 8 days and 1day, respectively. Calculate the probability of completing the project in 8 days or less.
c. Illustrate three other ways to label a PERT network. In at least one illustration, designate the critical path.
d. The cost of performing the project is $2,200 per week. The cost per week to crash and other relevant data follow:
|
Activity |
Normal Time |
Crash Time |
Cost Per Week To Crash |
|
A |
2 |
1 |
$1,900 |
|
B |
8 |
4 |
500 |
|
C |
4 |
2 |
2,800 |
|
D |
3 |
2 |
4,000 |
|
E |
2 |
1 |
2,000 |
|
Calculate an optimum time-cost solution. |
|||
|
Event |
Early Event Time (Et) |
Late Event Time (Lt) |
Slack |
|
1 |
0 |
0 |
0 |
|
2 |
2 |
4 |
2 |
|
3 |
8 |
8 |
0 |
|
4 |
10 |
10 |
0 |
|
ET(1) =0 ET(2) =0+2 |
|
= 0 = 2 |
|
SOLUTION TO DEMONSTRATION PROBLEM 3 a.
|
ET(3) = max |
ET(2) + 4 = 6 |
= 8 |
|
|
ET(1) + 8 = 8 |
|
|
|
ET(2) + 3 = 5 |
|
|
ET(4) = max |
ET(3) + 2 = 10 |
= 10 |
|
LT(4) = 10 |
|
= 10 |
|
LT(3) = LT(4) - 2 |
|
= 8 |
|
LT(2) = min |
LT(4) - 3 = 7 |
= 4 |
|
|
LT(3) - 4 = 4 |
|
|
LT(1) = min |
LT(2) - 2 = 2 |
= 0 |
|
|
LT(3) - 8 = 0 |
The critical path is the one containing events 1, 3, and 4. Therefore, activities B and E will have to be closely monitored since neither has any slack.
b. The expected time to complete the LAN project is 10 weeks. The standard deviation (Q) and variance (Q2) of activities B and E on the critical path are calculated as follows:
|
Activity |
Standard Deviation |
Variance ( |
||
|
|
24 - 6 |
= 3.00 |
|
9.00 |
|
B |
6 |
|
||
|
|
|
|
|
|
|
|
8 - 1 |
= 1.17 |
|
|
|
E |
6 |
|
1.37 |
|
|
|
|
|
10.37 |
|
|
|
|
|
|
3.22 |


To determine the probability that the project will be completed on or before week 8, the following calculations are required:
Z = (8 - 10) / 3.22
= -2.00 / 3.22
= -0.6211
where Z equals the number of standard deviations from the mean. The area under the curve for Z = -0.6211 is approximately 0.2650. Therefore, the probability of completing the LAN project in 8 weeks is approximately 26.5%.
c. Events lettered with expected times on activities:
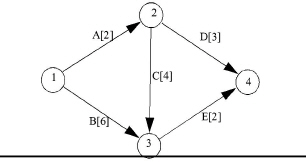
|
Activity |
Activity Description |
Te |
|
A-B |
Acquire workstations |
2 weeks |
|
A-C |
Install cable |
8 weeks |
|
B-C |
Install software |
4 weeks |
|
B-D |
Train users |
3 weeks |
|
C-D |
Connect and test |
2 weeks |
Events numbered and activities lettered with expected times on activities in parentheses:
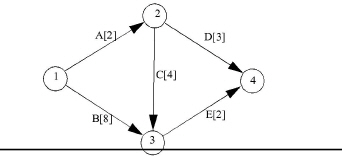
|
Activity |
Activity description |
Te |
|
A |
Acquire Workstations |
2 Weeks |
|
B |
Install Cable |
8 Weeks |
|
C |
Install Software |
4 Weeks |
|
D |
Train Users |
3 Weeks |
|
E |
Connect And Test |
2 Weeks |
Numbered events, lettered activities including expected times in parentheses, and critical path:
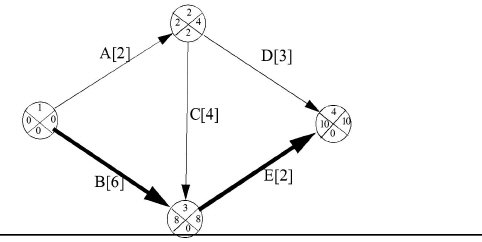
d. The critical path activities are ranked in order of lowest crashing cost and the number of weeks each can be crashed:
|
Activity |
Cost Per Week To Crash |
Available Weeks |
|
B |
$ 500 |
4 |
|
E |
2,000 |
1 |
The activity on the critical path with the lowest cost per week to crash ($500) is activity B. By crashing activity B for one week, thereby incurring an additional cost of $500, the project completion time can be reduced by one week to nine weeks.
Next, crashing activity B for a second week leaves the PERT network with two critical paths, A-C-E and B-E, both eight weeks in length. The remaining points for crashing and their costs are as follows:
|
Path |
Activity |
Cost Per Week to Crash |
|
A-C-E |
A |
$1,900 |
|
|
C |
2,800 |
|
|
E |
2,000 |
|
B-E |
B |
500 |
|
|
E |
2,000 |
Which activity or activities should be crashed? Activity E might seem to be out of the question since it has the highest crash cost of $2,000. However, E is on both critical paths, so crashing it will reduce the project by one week for a cost of $2,000. The other option of reducing the least expensive activity on each path would cost $2,400 ($1,900 for A plus $500 for B). The project duration is now seven weeks.
At this point, no additional improvement is cost-effective. The cost to crash A is $1,900 and the cost to crash B is $500, for a total of $2,400, which would exceed the project costs of $2,200 per week.
The crashing sequence is summarized as follows:
|
|
Length After crashing N Weeks |
|
|
|
|
Path |
n= 0 |
1 |
2 |
3 |
|
A-C-E |
8 |
8 |
8 |
7 |
|
B-E |
10 |
9 |
8 |
7 |
|
Activity crashed |
|
B |
B |
E |
|
Cost |
|
$500 |
$500 |
$2,000 |
DEMONSTRATION PROBLEM 4 Conducting an implementation audit. Refurbish It, Inc., has acquired a rundown building that was formerly occupied by a franchise restaurant outlet some ten years ago. The building has been unoccupied since that time and has had no general upkeep performed on it. A general contractor, hired by the company, began gutting the building three days ago. You, the management accountant at Refurbish It, have scheduled an implementation audit walk-through for tomorrow. You are currently finalizing the audit program checklist that you have developed to assist you in conducting the implementation audit.
Required:
a. Identify the three goals of your implementation audit.
b. Identify key items to look for during the physical on-site observation.
c. Identify key questions to ask the project contractor.
d. Identify key items to verify on documented deliverables.
SOLUTION TO DEMONSTRATION PROBLEM 4
a. The three goals of the implementation audit are:
1. To assess the performance of the construction crew to date.
2. To identify opportunities for improving the ongoing construction project.
3. To provide recommendations for corrective action.
b. Key items to look for during the physical on-site observation include:
1. Is electrical wiring adequately secured to prevent on-the-job injury?
2. Are still usable equipment and fixtures being segregated and accounted for and not allowed to leave the job site?
3. Are shipments of equipment and fixtures not being received until just prior to the installation date in order to prevent damage and theft?
4. Is the construction crew arriving on time, not leaving early, and not taking excessive breaks?
c. Key questions to ask the contractor include:
1. Have any problems with the construction project been encountered to date? If so, what if anything, can be done to help alleviate those problems?
2. Is the project on schedule?
24.18 During what time frame after bringing a capital project online should a post-implementation audit be conducted?
24.19 When should a company consider bringing in an external consultant or auditor to conduct the post-implementation audit?
24.20 Which audit form/checklist should be used during the post-implementation audit to assist in determining the project's success and acceptance and whether any redesign work is required?
Chapter-specific Problems
These problems require responses based directly on concepts and techniques presented in the text.
24.21 Critical path and cost. [CMA adapted] The following network diagram and table illustrate the time and costs associated with a particular project:

|
Activity |
Normal activity time |
Normal activity cost |
Total crashed time |
Crash activity cost |
|
A-B |
2 weeks |
$1,000 |
2 weeks |
$ 1,000 |
|
A-C |
1 |
800 |
1 |
800 |
|
B-D |
2 |
1,500 |
2 |
1,500 |
|
B-E |
5 |
5,100 |
3 |
10,200 |
|
C-D |
4 |
2,500 |
3 |
3,500 |
|
D-E |
1 |
600 |
1 |
600 |
|
E-F |
4 |
1,700 |
4 |
1,700 |
|
E-G |
3 |
1,200 |
2 |
2,600 |
|
F-H |
3 |
1,400 |
2 |
2,100 |
|
G-H |
3 |
1,300 |
3 |
1,300 |
Required:
a. Determine the project's critical path.
b. Compute the total cost of the project as planned.
c. Compute the incremental cost of completing the project in 12 weeks.
24.22 Calculating the probability of completing a project. Neptune Marina is planning to install a new docking facility for its customers' boats. The expected completion time is 70 weeks. Erika Loomis, chief operating officer, desires a completion date 18 weeks sooner.
Required: Calculate the probability of completing the project 18 weeks sooner, given a variance of 81.
24.23 Determining expected time, critical path, and slack. Because of continuing increases in enrollment, the School of Business building at Summa University has exceeded its capacity. To better serve students and faculty, the administration has provided the school with a choice among several underutilized buildings on campus that would meet the school's expansion needs.
After several committee meetings, eight major expansion project activities have been identified. Also, those people who will be involved in the expansion have been pooled to gather time estimates. From this work, the following data and PERT network have been prepared:

|
|
|
Time Estimates (Weeks) |
||
|
Activity |
Activity description |
Optimistic |
Most likely |
Pessimistic |
|
A |
Select building |
1 |
2 |
3 |
|
B |
Interview staff applicants |
2 |
3 |
4 |
|
C |
Develop remodelling plans |
1 |
2 |
3 |
|
D |
Select staff applicants |
2 |
4 |
6 |
|
F |
Remodel |
1 |
4 |
7 |
|
F |
Prepare parking spaces |
1 |
3 |
5 |
|
G |
Install facilities |
2 |
5 |
8 |
|
H |
Move in |
1 |
2 |
3 |
Required: Develop a PERT network indicating the critical path with a bold line. In each node (circle) include early event time (ET), late event time (LT), and slack. Also, calculate the amount of slack for all activities not on the critical path.
24.24 Crashing a project. California Building Corporation uses the PERT method to monitor construction jobs. The company is currently two weeks behind schedule on job 181, which is subject to a $10,500 per week completion penalty. Path A-B-C-F-G-H-I has a normal completion time of 20 weeks, and path A-D-E-F-G-H-I has a normal completion time of 22 weeks. The following activities can be crashed:
|
Activity |
Cost To Crash One Week |
Cost To Crash Two Weeks |
|
B-C |
$ 8,000 |
$15,000 |
|
D-E |
10,000 |
19,600 |
|
E-F |
8,800 |
19,500 |
California Building wants to reduce the normal completion time of job 181 and, at the same time, report the highest possible income for the year. California Building should crash: [CMA adapted]
a. Activity B-C one week and activity E-F one week.
b. Activity B-C two weeks.
c. Activity D-E one week and activity B-C one week.
d. Activity E-F two weeks.
e. Activity D-E one week and activity E-F one week.
24.25 Crashing a project. The PERT network diagram and corresponding activity cost chart for a manufacturing project at Networks, Inc., are presented below. The numbers in the diagram are the expected times (in days) to perform each activity in the project. [CMA adapted]

|
Activity |
Normal Cost |
Crash Time |
Crash Cost |
|
A-B |
$3,000 |
3.50 days |
$4,000 |
|
A-C |
5,000 |
4.50 |
5,250 |
|
A-D |
4,000 |
4.00 |
4.750 |
|
B-E |
6,000 |
5.00 |
7,000 |
|
C-E |
8,000 |
5.00 |
9,200 |
|
D-E |
6,000 |
6.00 |
6,750 |
|
B-C |
2,500 |
.50 |
3,500 |
|
B-D |
2,000 |
.25 |
2,500 |
Required:
a. Calculate total expected time on the critical path.
b. To keep costs at a minimum and decrease the completion time by one and one-half days, which activity or activities should Networks crash?
24.26 Conducting an implementation audit. Steve Loomis, owner of the Donut Stop, has decided to install an espresso/cappuccino corner in his donut shop due to heavy demand for fancier coffees by his current patrons. Due to space limitations and the desire to make the espresso/cappuccino corner a customer focal point, Steve plans to extend one wall 15 feet and redecorate it in an old European style. Since he will have to close his business for the duration of the construction, he wants to make sure that the project is completed in a timely manner and that he is not overcharged. Steve has therefore requested that you, his son, observe the construction to ensure timely project completion and cost containment.
Required:
a. Identify key items you should look for during the physical observation.
b. Identify key questions to ask the contractor.
c. Identify key items to verify on documented deliverables.
24.27 Conducting a post-implementation audit. The Monthly Magazine Company is a mid-sized company employing about 100 employees in a single-story building. In an effort to reduce the costs of intercompany mail sorting and delivery, the company purchased an automated mail cart and placed it in service six months ago. The cart follows a set route through the building, stopping at each mail stop location to allow each area to retrieve and distribute its mail. The mail cart cost the company $25,000 (including tax, freight, and installation) and requires an ongoing maintenance and service contract of $3,000 annually. Test run costs were $3,000 and training $2,500. Estimated costs were $22,000, $3,000, $4,000, and $2,000, respectively. Use of the mail cart enabled the company to eliminate the position of mail runner, who was compensated $20,000 annually, including company benefits. Senior management has asked you to perform a postimplementation audit to compare actual and expected results from a cash flow standpoint. Actual cash flows for the first four years were <$12,000>, $17,000, $17,000, and $18,000.
Required: Prepare a Cash Flow Estimate Form to reflect the post-implementation audit results.
Think-tank Problems
Although these problems are based on chapter material, reading extra material, reviewing previous chapters, and using creativity may be required to develop workable solutions.
24.28 PERT network and crashing the project. Silver Aviation assembles small aircraft for commercial use. The majority of Silver's business is with small freight airlines serving areas where the airport is too small to accommodate larger planes. The remainder of Silver's customers are commuter airlines and individuals who use planes in their businesses such as the owners of large ranches. Silver recently expanded its market into Central and South America, and the company expects to double its sales over the next three years.
Silver uses PERT to schedule work and keep track of all projects. The PERT diagram for the construction of a single cargo plane follows. The diagram shows that there are four alternative paths with the critical path being A-B-G-E-F-J-K.
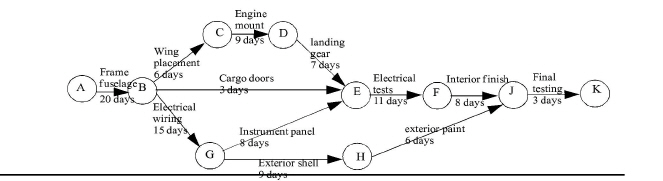
Bob Peterson, president of Coastal Airlines, has recently placed an order with Silver Aviation for five cargo planes. At the time of contract negotiations, Peterson agreed to a delivery time of 13 weeks (five working days per week) for the first plane with the balance of the planes being delivered at the rate of one every four weeks. Because of problems with some of the aircraft Coastal is currently using, Peterson has contacted Grace Vander, sales manager for Silver Aviation, to ask about improving the delivery date of the first cargo plane. Vander replied that she believed the schedule could be shortened by as much as ten working days or two weeks, but the cost of construction would increase as a result. Peterson said he would be willing to consider the increased costs, and they agreed to meet the following day to review a revised schedule that Vander would prepare.
Because Silver Aviation has assembled aircraft on an accelerated basis before, the company has compiled a list of crash costs for this purpose. Vander used the following to develop a plan to cut ten working days from the schedule at a minimum increase in cost to Coastal Airlines.
|
|
Crash Cost Listing |
|
|
||
|
|
Expected activity Times |
Direct Cost |
Added crash cost Per reduced Day |
||
|
Activity |
Regular |
Crash |
Regular |
Crash |
|
|
A-B Frame fuselage |
20 days |
16 days |
$12,000 |
$16,800 |
$1,200 |
|
B-C Wing placement |
6 |
5 |
3,600 |
5,000 |
1,400 |
|
C-D Engine mount |
9 |
7 |
6,600 |
8,000 |
700 |
|
D-E Landing gear |
7 |
5 |
5,100 |
6,700 |
800 |
|
B-E Cargo doors |
3 |
3 |
1,400 |
1,400 |
- |
|
B-G Electrical wiring |
15 |
13 |
9,000 |
11,000 |
1,000 |
|
G-E Instrument panel |
8 |
6 |
5,700 |
8,300 |
1,300 |
|
E-F Electrical tests |
11 |
10 |
6,800 |
7,600 |
800 |
|
G-H Exterior shell |
9 |
7 |
4,200 |
5,200 |
500 |
|
F-J Interior finish |
8 |
7 |
3,600 |
4,000 |
400 |
|
H-J Exterior paint |
6 |
5 |
3,600 |
4,000 |
400 |
|
J-K Final testing |
3 |
2 |
3,500 |
4,400 |
900 |
|
|
|
|
$65,100 |
$82,400 |
|
Upon completing her plan, Vander was pleased that she could report to Peterson that Silver would be able to cut ten working days from the schedule. The associated increase in cost would be $6,600. The following is Vander's plan for the accelerated delivery of the cargo plane starting from the regularly scheduled days and cost.
|
Completion time |
Activity crashed |
Additional cost per Day |
Total direct Cost |
|
65 days |
|
|
$65,100 |
|
64 |
H-J by one day |
$ 400 |
65,500 |
|
63 |
F-J by one day |
400 |
65,900 |
|
61 |
G-H by two days |
500 |
66,900 |
|
59 |
C-D by two days |
700 |
68,300 |
|
58 |
E-F by one day |
800 |
69,100 |
|
56 |
D-E by two days |
800 |
70,700 |
|
55 |
B-G by one day |
1,000 |
71,700 |
Required: [CMA adapted]
a. PERT is a form of network analysis.
1. Explain how the expected times for each activity are derived in using PERT.
2. Define the term “critical path” and explain why path ABGEFJK is the critical path in this situation.
b. Evaluate the accelerated delivery schedule prepared by Grace Vander.
1. Explain why Vander's plan as presented is unsatisfactory.
2. Revise the accelerated delivery schedule so that Coastal Airlines will take delivery of the first plane two weeks (ten working days) ahead of schedule at the least incremental cost to Coastal.
3. Calculate the incremental costs Bob Peterson will have to pay for this revised accelerated delivery.
24.29 PERT network and crashing the project. [CMA adapted] Barker Systems, founded by Janice Barker in 19X4, manufactures a highly sophisticated tracking system, FasTrac, which is used in conjunction with the Navy's PDQ2 water-to-water, antisubmarine missile guidance system.
FasTrac is largely hand-assembled from component parts in seven distinct steps at a manufacturing cost of $200,000 per unit. Barker Systems uses PERT to schedule and keep track of all projects. The following PERT chart shows the normal number of days required to complete a FasTrac unit:
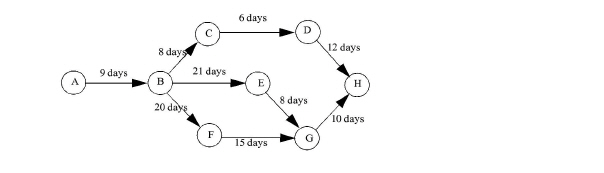
One Monday evening, Barker received a telephone call at her home from the PDQ2 missile staging base. Commander Grecon, procurement officer, requested delivery of a FasTrac unit ten days earlier than the normal delivery time, indicating the government would pay the additional costs associated with this accelerated delivery.
Barker called Howard Green, the company's production manager, and asked him to have a plan for meeting this delivery date, along with the incremental crash costs, ready for her review in the morning. Using the Crash Cost Listing presented next, Green prepared his plan for the accelerated delivery of a FasTrac unit, keeping in mind the need to minimize the cost impact.
|
|
Crash Cost Listing |
|
|
|
Activity |
Normal Time days |
Crash Time days |
Crash Cost per Reduced Day |
|
A-B |
9 |
6 |
$10,500 |
|
B-C |
8 |
6 |
1,000 |
|
C-D |
6 |
5 |
1,000 |
|
D-H |
12 |
8 |
6,000 |
|
B-E |
21 |
20 |
3,000 |
|
E-G |
8 |
6 |
4,500 |
|
G-H |
10 |
9 |
4,000 |
|
B-F |
20 |
16 |
5,000 |
|
F-G |
15 |
12 |
2,000 |
Following is the plan Green presented to Barker for her evaluation. He was pleased that the necessary ten days could be eliminated at the cost of only $25.000.
|
Accelerated Delivery Schedule |
||
|
Activity crashed |
Days crashed |
Total crash Cost |
|
B-C |
2 |
$ 2,000 |
|
C-D |
1 |
1,000 |
|
F-G |
3 |
6,000 |
|
B-F |
1 |
3,000 |
|
G-H |
1 |
4,000 |
|
E-G |
2 |
9,000 |
|
|
10 |
$25,000 |
Required:
a. By preparing a schedule of paths, with their total days, from the PERT network for the normal production of Barker's FasTrac unit, identify the critical path and explain why it is the critical path.
b. Janice Barker found Howard Green's plan for the accelerated delivery to be unsatisfactory. Explain why it is unsatisfactory.
c. Revise the Accelerated Delivery Schedule so that the delivery time of the FasTrac unit can be ten days ahead of the normal schedule at the least incremental cost.

24.30 Discussing the advantages and disadvantages of PERT. Caltron, Inc., produces computer-controlled components for a wide variety of military hardware. As a defense contractor, the company is often under severe time and scheduling constraints. The development of a new component, Vector-12, is no exception; the project has the potential for future contracts that could generate substantial revenue if development and testing can be accomplished in the allotted time.
The planning of the Vector-12 project has been assigned to Norm Robertson. This is Robertson's first assignment as a project director for Caltron, and he is eager to demonstrate his capabilities.
This project, like many of Caltron's projects, cuts across departments. Therefore, scheduling and coordination among departments are crucial. Caltron's management has long been an advocate of PERT. Therefore, Robertson prepared the following PERT diagram for the Vector-12 project:
The numbers by the activity arrows represent the expected time in weeks required to complete each activity. The responsibility for the critical path, Start-B-C-F-I-J-Finish, is shared by two departments, Electromechanical Engineering (EME) and Fabrication (FAB). Resource Appropriation and Processing (RAP) is responsible for Start-A-D-G-J.
Robertson developed the PERT diagram with minimal input from the department directors affected. He did review the preliminary diagrams with the directors of EME and FAB. Robertson was unable to contact the director of RAP, Shiela Neill, and he neglected to talk with Neill when she returned to the office. The directors of EME and FAB offered suggestions to Robertson on how to revise the diagrams in terms of ordering activities and time estimates. They also indicated how Neill's activities would coordinate with their activities. However, none of the directors reviewed the final PERT diagram.
As the Vector-12 project entered its fourth week, Robertson requested progress reports from the department directors. Neill told Robertson that activity A-D would take 10-12 weeks. When Robertson asked Neill to explain the delay, Neill replied, “I could have told you there would be a problem, but you never asked for my input. The time for activity A-D is understated as is, and I cannot even start until activity B-E is completed by FAB.” [CMA adapted]
Required:
a. Discuss the advantages and disadvantages of PERT as a means of organizing and coordinating projects.
b. Identify the specific reason that would cause Norm Robertson to be concerned about the delay in activity A-D.
c. Critique the way Norm Robertson developed the PERT diagram for the Vector-12 project.
d. Discuss the behavioral problems that could arise within Caltron as a consequence of the planning of the Vector-12 project.
24.31 Auditing implementation activities. Janine Wilson has been assigned to implement an order-entry processing program for the new ICBIS. Her supervisor provided the following activities and related time for each activity: Design program 50 hours; Code program 40 hours; Test program 70 hours; Document program 40 hours.
After several days, Angela Milam, management accountant, interviews Janine to determine her progress. Janine reports the following:
|
Activity |
Estimated |
Actual |
Remaining |
|
Design program |
50 |
20 |
0 |
|
Code program |
40 |
4 |
27 |
|
Test program |
70 |
0 |
15 |
|
Document program |
40 |
0 |
12 |
Required:
Discuss what reaction Angela Milam may have to this revised plan.
24.32 Postimplementation audit of cost and benefit estimates. You have plotted actual cost and benefit figures against those estimated early in the systems project as follows:
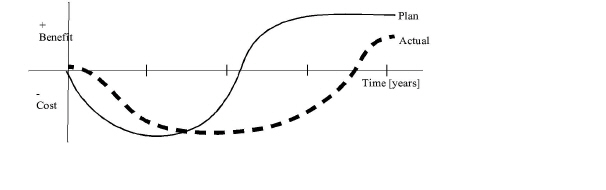 Required: What does this graph say about meeting cost and benefit expectations?
24.33 Conducting an implementation audit. The Electric Company is currently in its sixth year of construction on a waste-to-energy plant, a new and promising energy generation technology. Unfortunately, an accident has just occurred in a competitor's fully functioning waste-to-energy plant, forcing its immediate shutdown. This has added fuel to public outcry that the new plants are emitting an excessive amount of particulates into the atmosphere and causing increased health problems in surrounding areas.
As management accountant at the Electric Company, you have been asked to conduct an implementation audit to assess the continued feasibility of the study. The following are your findings:
1. The project was 80% complete at the time of the accident. Due to the imposition of stricter construction requirements, however, the project is now only 50% complete and will require extensive rework to existing structures to meet code.
2. The project was expected to cost $75 million in total. Total actual costs incurred to date, however, have exceeded this estimate by more than 50% and are $115 million.
3. The partially completed plant represents about 40% of the Electric Company's total assets.
4. The corporate hierarchy allowed construction to progress with little attention given to cost overruns, quality of engineering, and construction delays on the part of the subcontractors.
5. The primary contractor has no collateral that could be won if the Electric Company pursues a lawsuit.
6. There is strong statewide opposition to waste-to-energy burning plants.
7. There is increasing public pressure on the State Public Service Commission to force the company to keep its rates as low as possible and to use proven and dependable technology in its plants.
Required:What are your recommendations to senior management?
24.34 Conducting a postimplementation audit. The DLM Company installed a new production line over one year ago. One of the senior managers has just attended a seminar on the capital budgeting methodology in which the benefits of a postimplementation audit were touted. He has assigned the company's management accountant to conduct a postimplementation audit. The accountant has gathered the following information:
|
|
Estimated rating |
Audit rating |
|
Technical feasibility |
8.00 |
7.00 |
|
Operational feasibility |
7.00 |
9.00 |
|
Economic feasibility |
7.00 |
5.00 |
|
Schedule feasibility |
7.00 |
6.00 |
|
Tangible benefits |
7.00 |
7.00 |
|
Intangible benefits |
6.67 |
8.33 |
Required: Prepare Feasibility and Benefits Factors Audit Rating Checklists. Make any assumptions needed to solve this problem.
24.35 Postimplementation audit of systems performance. Terminal response time is the time that the user must wait to begin a transaction after completing the previous one. Definition of a good response time depends on the application and user. Typically, data-entry applications are the most demanding, because little thought on the part of the user is required. Therefore, any delay between the completion of one transaction and the beginning of the next is considered a significant interruption in work flow. Skilled data-entry operators complain bitterly about terminal response time greater than 2.5 seconds. You have been using a hardware monitor as part of your postimplementation audit. The following graph displays an average online response time during one month of monitoring operations:
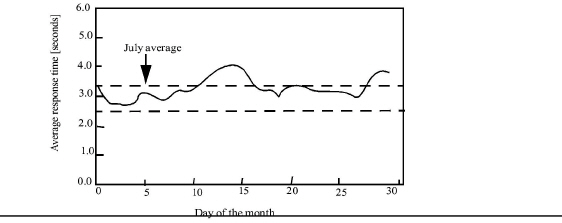
Required: Based on the information displayed in the graph, prepare a response to be included in your postimplementation audit report. If the system you are reviewing is designed to support mostly data-entry operations, is the system adequate? What might be some feasible changes in the system that would make it more adequate?
24.36 Postimplementation audit of systems performance. The percentage of systems availability time is closely related to terminal response time. A low percentage of availability and poor terminal response time, however, may be symptoms of different problems. The percentage of systems availability is considered an important measure of systems performance.
The percentage of systems availability is calculated with the following equation:
Percentage availability = ((Total scheduled availability - Downtime) x 100) / Total scheduled availability
Total scheduled availability is the total number of hours the system is scheduled to operate within a given time period. The time period may be a day, week, month, or year. Downtime is the number of hours the system is unavailable for use during the same time period.
You have monitored the system for a month immediately following systems conversion. The results of this monitoring are presented in the following graph:
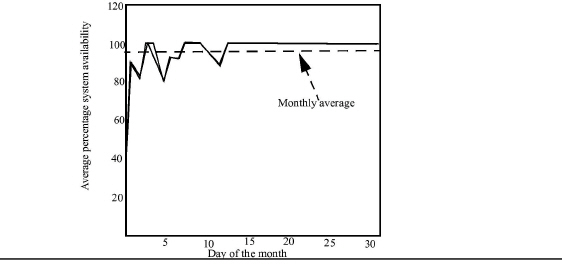
Required: What assessment of the system's availability can you make from this graph? Make any assumptions that you deem appropriate and explain the reason or reasons behind the fluctuations in the first half of the month. Do you plan to continue monitoring the system next month? Why or why not?
24.37 Postimplementation audit of systems performance. The new order-entry system has been in operation for four months after direct conversion. During this time, orders have been reported late 35% of the time because of system malfunctions and user incompetency. Reruns are common, and the order-entry software has suffered 14 abnormal terminations. On the first three abnormal terminations, operators took over two days to restart the system.
Required: Prepare a critique of this system's implementation. What should have been done to prevent these problems from occurring? Justify all of your answers and make any assumptions you deem necessary.